

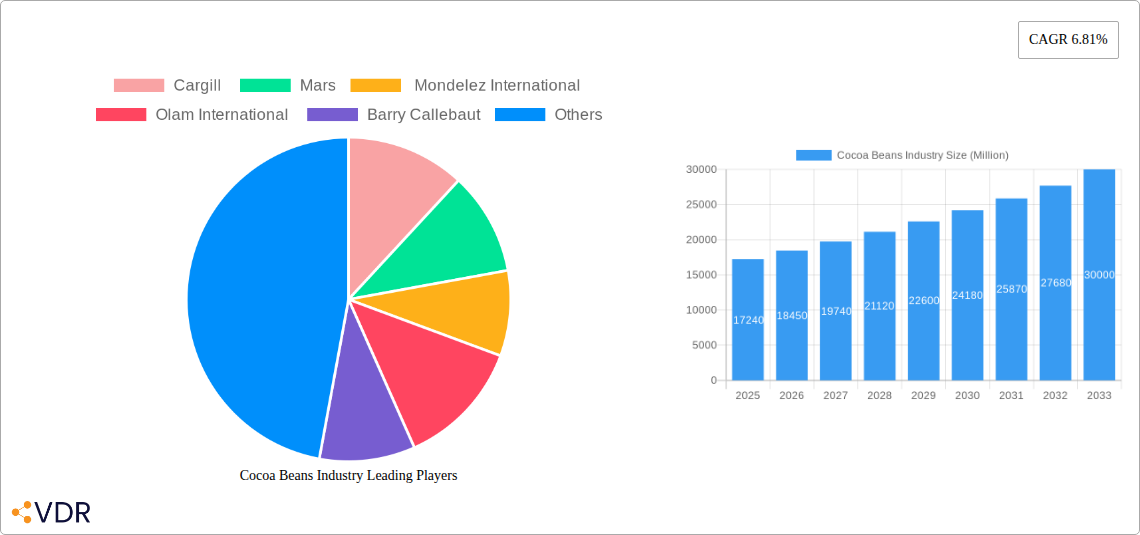
Key Insights
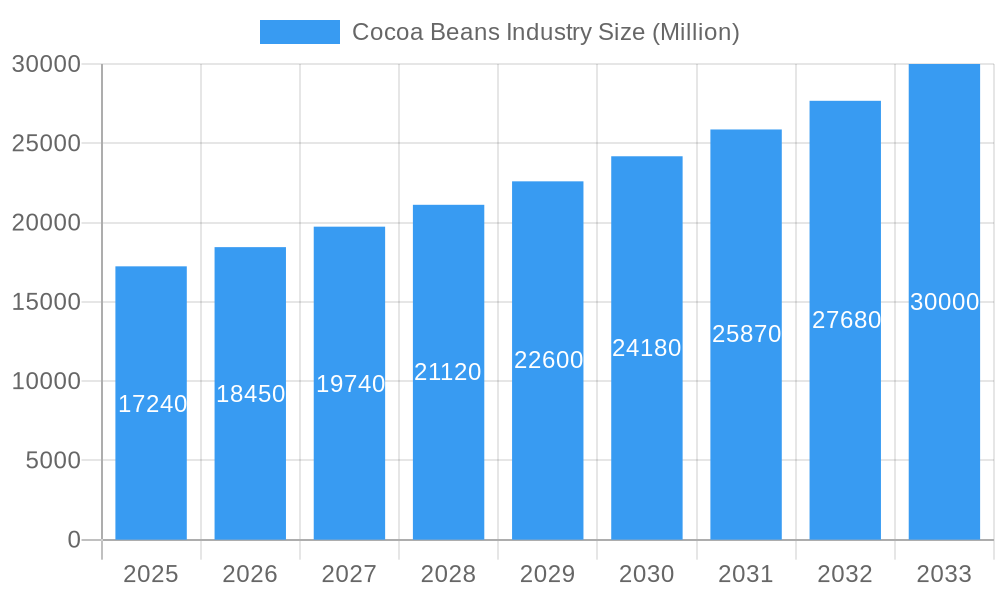
The global cocoa beans market, valued at $17.24 billion in 2025, is projected to experience robust growth, driven by rising chocolate consumption, particularly in developing economies. A compound annual growth rate (CAGR) of 6.81% from 2025 to 2033 indicates a significant expansion, reaching an estimated market size of approximately $30 billion by 2033. Key growth drivers include increasing demand for confectionery products, the expanding beverage industry's utilization of cocoa, and the growing popularity of cocoa-based health and wellness products. The market segmentation reveals significant opportunities across product types (bulk cocoa beans, cocoa butter, cocoa powder, chocolate), processing types (fermented and non-fermented), end-user industries (confectionery, beverages, bakery), and sales channels (online retail, supermarkets, specialty stores). Leading players like Cargill, Mars, Mondelez International, Olam International, and Barry Callebaut are strategically positioning themselves to capitalize on these trends through product diversification, supply chain optimization, and brand building. However, challenges such as fluctuations in cocoa bean prices, sustainability concerns regarding cocoa farming practices, and potential supply chain disruptions due to climate change present ongoing hurdles for market participants.
Cocoa Beans Industry Market Size (In Billion)
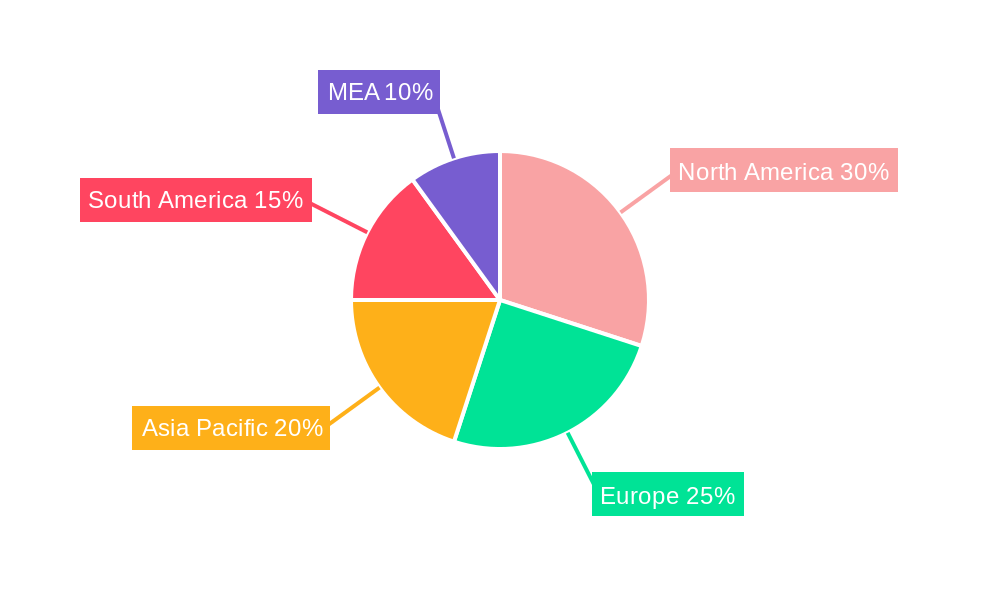
Geographic distribution reveals strong market presence in North America and Europe, driven by high per capita chocolate consumption. However, the Asia-Pacific region is poised for substantial growth due to rising disposable incomes and changing consumer preferences. The market's expansion within this region is further fueled by increased local production and processing of cocoa beans in countries like India and Indonesia. South America, with its significant cocoa bean production, is also an important market segment, although export-oriented economies in the region may face challenges related to international trade policies and logistical infrastructure. The Middle East and Africa (MEA) region exhibits moderate growth potential, largely influenced by evolving consumer tastes and increasing purchasing power within specific countries. The competitive landscape is characterized by both large multinational corporations and smaller, specialized businesses, leading to intense competition and a focus on innovation and differentiation within product offerings and sustainable sourcing practices.
Cocoa Beans Industry Company Market Share
Cocoa Beans Industry: A Comprehensive Market Report (2019-2033)
This in-depth report provides a comprehensive analysis of the global cocoa beans industry, encompassing market dynamics, growth trends, regional analysis, product landscape, and key players. The study period covers 2019-2033, with 2025 as the base and estimated year. This report is essential for industry professionals, investors, and stakeholders seeking a complete understanding of this dynamic market. We delve into parent markets (chocolate, confectionery) and child markets (bulk cocoa beans, cocoa butter, cocoa powder) to provide a granular view. The report's quantitative and qualitative insights are invaluable for strategic decision-making.
Expected Market Size (Million Units): xx (2025)
Projected CAGR (2025-2033): xx%
Cocoa Beans Industry Market Dynamics & Structure
The cocoa beans market is characterized by moderate concentration, with key players like Cargill, Mars, Mondelez International, Olam International, and Barry Callebaut holding significant market share. Technological advancements in processing and sustainable farming practices are major drivers, while regulatory frameworks concerning child labor and deforestation significantly influence operations. Substitute products, while existing (e.g., alternative sweeteners), pose a limited threat due to cocoa's unique flavor profile. End-user demographics show a growing preference for premium chocolate and cocoa-based products, particularly in emerging markets. M&A activity has been relatively stable, with xx deals recorded between 2019-2024, mostly focused on expanding supply chains and securing sustainable sourcing.
- Market Concentration: Moderately concentrated, with top 5 players holding xx% market share in 2024.
- Technological Innovation: Focus on automation in processing, sustainable farming techniques, and traceability initiatives.
- Regulatory Landscape: Stringent regulations regarding child labor, deforestation, and fair trade practices.
- Competitive Substitutes: Limited substitutes, primarily alternative sweeteners and flavorings.
- End-User Demographics: Increasing demand from health-conscious consumers and emerging markets.
- M&A Activity: xx deals between 2019 and 2024, focused on vertical integration and sustainable sourcing.
Cocoa Beans Industry Growth Trends & Insights
The global cocoa beans market witnessed a steady growth trajectory during the historical period (2019-2024), driven by increasing chocolate consumption and expanding application in various food and beverage products. The market experienced a slight slowdown in 2020 due to the pandemic, but quickly recovered, showcasing resilience. Technological disruptions, such as improved processing techniques and automation, are enhancing efficiency and quality. Consumer behavior shifts toward healthier options and sustainable sourcing are impacting demand, favoring fair-trade and ethically sourced cocoa. This trend is expected to continue driving growth throughout the forecast period (2025-2033), contributing to a projected CAGR of xx%.
Dominant Regions, Countries, or Segments in Cocoa Beans Industry
Ivory Coast and Ghana remain the dominant cocoa-producing countries, accounting for xx% of global production in 2024. The confectionery segment represents the largest end-user industry, followed by beverages and bakery products. Within product types, bulk cocoa beans hold the largest market share, while cocoa butter and cocoa powder are experiencing significant growth driven by increasing demand in specialized food applications. Supermarkets/hypermarkets are the primary sales channel, followed by specialty stores and online retail, indicating a potential for online sales expansion.
- Key Drivers: Favorable climate conditions in major producing regions, increasing chocolate consumption globally, rising demand for cocoa-based products in various industries.
- Dominant Regions: West Africa (Ivory Coast and Ghana) hold the largest market share in cocoa bean production.
- Dominant Segments: Confectionery remains the primary end-user industry, followed by beverages and bakery products.
- Growth Potential: Emerging markets in Asia and Latin America present significant growth opportunities.
Cocoa Beans Industry Product Landscape
The cocoa beans industry offers a range of products, including bulk cocoa beans, cocoa butter, cocoa powder, and chocolate. Recent innovations include sustainably sourced cocoa, organic cocoa products, and specialized cocoa powders tailored for specific applications like baking or beverages. These products often feature unique selling propositions based on origin, processing methods, and flavor profiles. Advancements in processing technologies are improving product consistency, yield, and reducing waste.
Key Drivers, Barriers & Challenges in Cocoa Beans Industry
Key Drivers: Rising global chocolate consumption, increasing demand from emerging markets, and the development of new cocoa-based products are key drivers. Favorable climatic conditions in major cocoa-producing regions also contribute. Government initiatives like India's reduction in custom duty on cocoa beans further accelerate market growth.
Key Challenges: Volatile cocoa prices due to climate change and supply chain disruptions, challenges in ensuring sustainable sourcing and tackling child labor, and competition from alternative sweeteners and flavorings. The impact of climate change on cocoa yields poses a significant long-term challenge, potentially affecting supply and price stability.
Emerging Opportunities in Cocoa Beans Industry
Emerging opportunities lie in expanding into untapped markets, particularly in Asia and Latin America. The increasing demand for sustainable and ethically sourced cocoa presents opportunities for companies emphasizing transparency and traceability in their supply chains. The development of new cocoa-based products with enhanced nutritional value or functional properties, such as high-protein cocoa or cocoa-based sports supplements, holds potential. Furthermore, opportunities exist in exploring new applications for cocoa byproducts, reducing waste and fostering a circular economy.
Growth Accelerators in the Cocoa Beans Industry Industry
Technological advancements in processing and farming techniques, fostering sustainable and efficient production. Strategic partnerships within the value chain, ensuring secure supply and enhanced traceability, are also crucial growth catalysts. Market expansion strategies targeting emerging markets with growing disposable incomes and a preference for chocolate and cocoa-based products drive long-term growth.
Key Players Shaping the Cocoa Beans Industry Market
Notable Milestones in Cocoa Beans Industry Sector
- June 2021: Ivory Coast initiates a biomass plant powered by cocoa waste, improving sustainability.
- February 2022: India reduces cocoa bean import duty to 15%, boosting domestic demand.
- October 2022: EU and partners pledge USD 442 million to combat child labor and deforestation in Ivory Coast's cocoa sector.
In-Depth Cocoa Beans Industry Market Outlook
The cocoa beans market is poised for sustained growth, fueled by rising global demand, increased focus on sustainability, and technological advancements. Strategic partnerships, investments in research and development, and expansion into new markets will be crucial for capturing future opportunities. Companies focusing on ethical sourcing, transparency, and product innovation are best positioned to succeed in this evolving market.
Cocoa Beans Industry Segmentation
-
1. North America
- 1.1. United States
- 1.2. Canada
-
2. Europe
- 2.1. Germany
- 2.2. Netherland
- 2.3. United Kingdom
- 2.4. France
- 2.5. Belgium
- 2.6. Russia
-
3. Asia-Pacific
- 3.1. India
- 3.2. Malaysia
- 3.3. Indonesia
- 3.4. Singapore
- 3.5. Japan
-
4. South America
- 4.1. Brazil
- 4.2. Ecuador
-
5. Africa
- 5.1. Ghana
- 5.2. Ivory Coast
- 5.3. Nigeria
- 5.4. Cote D'lvoire
- 5.5. Cameroon
-
6. North America
- 6.1. United States
- 6.2. Canada
-
7. Europe
- 7.1. Germany
- 7.2. Netherland
- 7.3. United Kingdom
- 7.4. France
- 7.5. Belgium
- 7.6. Russia
-
8. Asia-Pacific
- 8.1. India
- 8.2. Malaysia
- 8.3. Indonesia
- 8.4. Singapore
- 8.5. Japan
-
9. South America
- 9.1. Brazil
- 9.2. Ecuador
-
10. Africa
- 10.1. Ghana
- 10.2. Ivory Coast
- 10.3. Nigeria
- 10.4. Cote D'lvoire
- 10.5. Cameroon
Cocoa Beans Industry Segmentation By Geography
-
1. North America
- 1.1. United States
- 1.2. Canada
- 1.3. Mexico
-
2. South America
- 2.1. Brazil
- 2.2. Argentina
- 2.3. Rest of South America
-
3. Europe
- 3.1. United Kingdom
- 3.2. Germany
- 3.3. France
- 3.4. Italy
- 3.5. Spain
- 3.6. Russia
- 3.7. Benelux
- 3.8. Nordics
- 3.9. Rest of Europe
-
4. Middle East & Africa
- 4.1. Turkey
- 4.2. Israel
- 4.3. GCC
- 4.4. North Africa
- 4.5. South Africa
- 4.6. Rest of Middle East & Africa
-
5. Asia Pacific
- 5.1. China
- 5.2. India
- 5.3. Japan
- 5.4. South Korea
- 5.5. ASEAN
- 5.6. Oceania
- 5.7. Rest of Asia Pacific
Cocoa Beans Industry Regional Market Share
Geographic Coverage of Cocoa Beans Industry
Cocoa Beans Industry REPORT HIGHLIGHTS
| Aspects | Details |
|---|---|
| Study Period | 2020-2034 |
| Base Year | 2025 |
| Estimated Year | 2026 |
| Forecast Period | 2026-2034 |
| Historical Period | 2020-2025 |
| Growth Rate | CAGR of 6.81% from 2020-2034 |
| Segmentation |
|
Table of Contents
- 1. Introduction
- 1.1. Research Scope
- 1.2. Market Segmentation
- 1.3. Research Objective
- 1.4. Definitions and Assumptions
- 2. Executive Summary
- 2.1. Market Snapshot
- 3. Market Dynamics
- 3.1. Market Drivers
- 3.2. Market Restrains
- 3.3. Market Trends
- 3.4. Market Opportunities
- 4. Market Factor Analysis
- 4.1. Porters Five Forces
- 4.1.1. Bargaining Power of Suppliers
- 4.1.2. Bargaining Power of Buyers
- 4.1.3. Threat of New Entrants
- 4.1.4. Threat of Substitutes
- 4.1.5. Competitive Rivalry
- 4.2. PESTEL analysis
- 4.3. BCG Analysis
- 4.3.1. Stars (High Growth, High Market Share)
- 4.3.2. Cash Cows (Low Growth, High Market Share)
- 4.3.3. Question Mark (High Growth, Low Market Share)
- 4.3.4. Dogs (Low Growth, Low Market Share)
- 4.4. Ansoff Matrix Analysis
- 4.5. Supply Chain Analysis
- 4.6. Regulatory Landscape
- 4.7. Current Market Potential and Opportunity Assessment (TAM–SAM–SOM Framework)
- 4.8. VDR Analyst Note
- 4.1. Porters Five Forces
- 5. Market Analysis, Insights and Forecast 2021-2033
- 5.1. Market Analysis, Insights and Forecast - by North America
- 5.1.1. United States
- 5.1.2. Canada
- 5.2. Market Analysis, Insights and Forecast - by Europe
- 5.2.1. Germany
- 5.2.2. Netherland
- 5.2.3. United Kingdom
- 5.2.4. France
- 5.2.5. Belgium
- 5.2.6. Russia
- 5.3. Market Analysis, Insights and Forecast - by Asia-Pacific
- 5.3.1. India
- 5.3.2. Malaysia
- 5.3.3. Indonesia
- 5.3.4. Singapore
- 5.3.5. Japan
- 5.4. Market Analysis, Insights and Forecast - by South America
- 5.4.1. Brazil
- 5.4.2. Ecuador
- 5.5. Market Analysis, Insights and Forecast - by Africa
- 5.5.1. Ghana
- 5.5.2. Ivory Coast
- 5.5.3. Nigeria
- 5.5.4. Cote D'lvoire
- 5.5.5. Cameroon
- 5.6. Market Analysis, Insights and Forecast - by North America
- 5.6.1. United States
- 5.6.2. Canada
- 5.7. Market Analysis, Insights and Forecast - by Europe
- 5.7.1. Germany
- 5.7.2. Netherland
- 5.7.3. United Kingdom
- 5.7.4. France
- 5.7.5. Belgium
- 5.7.6. Russia
- 5.8. Market Analysis, Insights and Forecast - by Asia-Pacific
- 5.8.1. India
- 5.8.2. Malaysia
- 5.8.3. Indonesia
- 5.8.4. Singapore
- 5.8.5. Japan
- 5.9. Market Analysis, Insights and Forecast - by South America
- 5.9.1. Brazil
- 5.9.2. Ecuador
- 5.10. Market Analysis, Insights and Forecast - by Africa
- 5.10.1. Ghana
- 5.10.2. Ivory Coast
- 5.10.3. Nigeria
- 5.10.4. Cote D'lvoire
- 5.10.5. Cameroon
- 5.11. Market Analysis, Insights and Forecast - by Region
- 5.11.1. North America
- 5.11.2. South America
- 5.11.3. Europe
- 5.11.4. Middle East & Africa
- 5.11.5. Asia Pacific
- 5.1. Market Analysis, Insights and Forecast - by North America
- 6. Global Cocoa Beans Industry Analysis, Insights and Forecast, 2021-2033
- 6.1. Market Analysis, Insights and Forecast - by North America
- 6.1.1. United States
- 6.1.2. Canada
- 6.2. Market Analysis, Insights and Forecast - by Europe
- 6.2.1. Germany
- 6.2.2. Netherland
- 6.2.3. United Kingdom
- 6.2.4. France
- 6.2.5. Belgium
- 6.2.6. Russia
- 6.3. Market Analysis, Insights and Forecast - by Asia-Pacific
- 6.3.1. India
- 6.3.2. Malaysia
- 6.3.3. Indonesia
- 6.3.4. Singapore
- 6.3.5. Japan
- 6.4. Market Analysis, Insights and Forecast - by South America
- 6.4.1. Brazil
- 6.4.2. Ecuador
- 6.5. Market Analysis, Insights and Forecast - by Africa
- 6.5.1. Ghana
- 6.5.2. Ivory Coast
- 6.5.3. Nigeria
- 6.5.4. Cote D'lvoire
- 6.5.5. Cameroon
- 6.6. Market Analysis, Insights and Forecast - by North America
- 6.6.1. United States
- 6.6.2. Canada
- 6.7. Market Analysis, Insights and Forecast - by Europe
- 6.7.1. Germany
- 6.7.2. Netherland
- 6.7.3. United Kingdom
- 6.7.4. France
- 6.7.5. Belgium
- 6.7.6. Russia
- 6.8. Market Analysis, Insights and Forecast - by Asia-Pacific
- 6.8.1. India
- 6.8.2. Malaysia
- 6.8.3. Indonesia
- 6.8.4. Singapore
- 6.8.5. Japan
- 6.9. Market Analysis, Insights and Forecast - by South America
- 6.9.1. Brazil
- 6.9.2. Ecuador
- 6.10. Market Analysis, Insights and Forecast - by Africa
- 6.10.1. Ghana
- 6.10.2. Ivory Coast
- 6.10.3. Nigeria
- 6.10.4. Cote D'lvoire
- 6.10.5. Cameroon
- 6.1. Market Analysis, Insights and Forecast - by North America
- 7. North America Cocoa Beans Industry Analysis, Insights and Forecast, 2021-2033
- 7.1. Market Analysis, Insights and Forecast - by North America
- 7.1.1. United States
- 7.1.2. Canada
- 7.2. Market Analysis, Insights and Forecast - by Europe
- 7.2.1. Germany
- 7.2.2. Netherland
- 7.2.3. United Kingdom
- 7.2.4. France
- 7.2.5. Belgium
- 7.2.6. Russia
- 7.3. Market Analysis, Insights and Forecast - by Asia-Pacific
- 7.3.1. India
- 7.3.2. Malaysia
- 7.3.3. Indonesia
- 7.3.4. Singapore
- 7.3.5. Japan
- 7.4. Market Analysis, Insights and Forecast - by South America
- 7.4.1. Brazil
- 7.4.2. Ecuador
- 7.5. Market Analysis, Insights and Forecast - by Africa
- 7.5.1. Ghana
- 7.5.2. Ivory Coast
- 7.5.3. Nigeria
- 7.5.4. Cote D'lvoire
- 7.5.5. Cameroon
- 7.6. Market Analysis, Insights and Forecast - by North America
- 7.6.1. United States
- 7.6.2. Canada
- 7.7. Market Analysis, Insights and Forecast - by Europe
- 7.7.1. Germany
- 7.7.2. Netherland
- 7.7.3. United Kingdom
- 7.7.4. France
- 7.7.5. Belgium
- 7.7.6. Russia
- 7.8. Market Analysis, Insights and Forecast - by Asia-Pacific
- 7.8.1. India
- 7.8.2. Malaysia
- 7.8.3. Indonesia
- 7.8.4. Singapore
- 7.8.5. Japan
- 7.9. Market Analysis, Insights and Forecast - by South America
- 7.9.1. Brazil
- 7.9.2. Ecuador
- 7.10. Market Analysis, Insights and Forecast - by Africa
- 7.10.1. Ghana
- 7.10.2. Ivory Coast
- 7.10.3. Nigeria
- 7.10.4. Cote D'lvoire
- 7.10.5. Cameroon
- 7.1. Market Analysis, Insights and Forecast - by North America
- 8. South America Cocoa Beans Industry Analysis, Insights and Forecast, 2021-2033
- 8.1. Market Analysis, Insights and Forecast - by North America
- 8.1.1. United States
- 8.1.2. Canada
- 8.2. Market Analysis, Insights and Forecast - by Europe
- 8.2.1. Germany
- 8.2.2. Netherland
- 8.2.3. United Kingdom
- 8.2.4. France
- 8.2.5. Belgium
- 8.2.6. Russia
- 8.3. Market Analysis, Insights and Forecast - by Asia-Pacific
- 8.3.1. India
- 8.3.2. Malaysia
- 8.3.3. Indonesia
- 8.3.4. Singapore
- 8.3.5. Japan
- 8.4. Market Analysis, Insights and Forecast - by South America
- 8.4.1. Brazil
- 8.4.2. Ecuador
- 8.5. Market Analysis, Insights and Forecast - by Africa
- 8.5.1. Ghana
- 8.5.2. Ivory Coast
- 8.5.3. Nigeria
- 8.5.4. Cote D'lvoire
- 8.5.5. Cameroon
- 8.6. Market Analysis, Insights and Forecast - by North America
- 8.6.1. United States
- 8.6.2. Canada
- 8.7. Market Analysis, Insights and Forecast - by Europe
- 8.7.1. Germany
- 8.7.2. Netherland
- 8.7.3. United Kingdom
- 8.7.4. France
- 8.7.5. Belgium
- 8.7.6. Russia
- 8.8. Market Analysis, Insights and Forecast - by Asia-Pacific
- 8.8.1. India
- 8.8.2. Malaysia
- 8.8.3. Indonesia
- 8.8.4. Singapore
- 8.8.5. Japan
- 8.9. Market Analysis, Insights and Forecast - by South America
- 8.9.1. Brazil
- 8.9.2. Ecuador
- 8.10. Market Analysis, Insights and Forecast - by Africa
- 8.10.1. Ghana
- 8.10.2. Ivory Coast
- 8.10.3. Nigeria
- 8.10.4. Cote D'lvoire
- 8.10.5. Cameroon
- 8.1. Market Analysis, Insights and Forecast - by North America
- 9. Europe Cocoa Beans Industry Analysis, Insights and Forecast, 2021-2033
- 9.1. Market Analysis, Insights and Forecast - by North America
- 9.1.1. United States
- 9.1.2. Canada
- 9.2. Market Analysis, Insights and Forecast - by Europe
- 9.2.1. Germany
- 9.2.2. Netherland
- 9.2.3. United Kingdom
- 9.2.4. France
- 9.2.5. Belgium
- 9.2.6. Russia
- 9.3. Market Analysis, Insights and Forecast - by Asia-Pacific
- 9.3.1. India
- 9.3.2. Malaysia
- 9.3.3. Indonesia
- 9.3.4. Singapore
- 9.3.5. Japan
- 9.4. Market Analysis, Insights and Forecast - by South America
- 9.4.1. Brazil
- 9.4.2. Ecuador
- 9.5. Market Analysis, Insights and Forecast - by Africa
- 9.5.1. Ghana
- 9.5.2. Ivory Coast
- 9.5.3. Nigeria
- 9.5.4. Cote D'lvoire
- 9.5.5. Cameroon
- 9.6. Market Analysis, Insights and Forecast - by North America
- 9.6.1. United States
- 9.6.2. Canada
- 9.7. Market Analysis, Insights and Forecast - by Europe
- 9.7.1. Germany
- 9.7.2. Netherland
- 9.7.3. United Kingdom
- 9.7.4. France
- 9.7.5. Belgium
- 9.7.6. Russia
- 9.8. Market Analysis, Insights and Forecast - by Asia-Pacific
- 9.8.1. India
- 9.8.2. Malaysia
- 9.8.3. Indonesia
- 9.8.4. Singapore
- 9.8.5. Japan
- 9.9. Market Analysis, Insights and Forecast - by South America
- 9.9.1. Brazil
- 9.9.2. Ecuador
- 9.10. Market Analysis, Insights and Forecast - by Africa
- 9.10.1. Ghana
- 9.10.2. Ivory Coast
- 9.10.3. Nigeria
- 9.10.4. Cote D'lvoire
- 9.10.5. Cameroon
- 9.1. Market Analysis, Insights and Forecast - by North America
- 10. Middle East & Africa Cocoa Beans Industry Analysis, Insights and Forecast, 2021-2033
- 10.1. Market Analysis, Insights and Forecast - by North America
- 10.1.1. United States
- 10.1.2. Canada
- 10.2. Market Analysis, Insights and Forecast - by Europe
- 10.2.1. Germany
- 10.2.2. Netherland
- 10.2.3. United Kingdom
- 10.2.4. France
- 10.2.5. Belgium
- 10.2.6. Russia
- 10.3. Market Analysis, Insights and Forecast - by Asia-Pacific
- 10.3.1. India
- 10.3.2. Malaysia
- 10.3.3. Indonesia
- 10.3.4. Singapore
- 10.3.5. Japan
- 10.4. Market Analysis, Insights and Forecast - by South America
- 10.4.1. Brazil
- 10.4.2. Ecuador
- 10.5. Market Analysis, Insights and Forecast - by Africa
- 10.5.1. Ghana
- 10.5.2. Ivory Coast
- 10.5.3. Nigeria
- 10.5.4. Cote D'lvoire
- 10.5.5. Cameroon
- 10.6. Market Analysis, Insights and Forecast - by North America
- 10.6.1. United States
- 10.6.2. Canada
- 10.7. Market Analysis, Insights and Forecast - by Europe
- 10.7.1. Germany
- 10.7.2. Netherland
- 10.7.3. United Kingdom
- 10.7.4. France
- 10.7.5. Belgium
- 10.7.6. Russia
- 10.8. Market Analysis, Insights and Forecast - by Asia-Pacific
- 10.8.1. India
- 10.8.2. Malaysia
- 10.8.3. Indonesia
- 10.8.4. Singapore
- 10.8.5. Japan
- 10.9. Market Analysis, Insights and Forecast - by South America
- 10.9.1. Brazil
- 10.9.2. Ecuador
- 10.10. Market Analysis, Insights and Forecast - by Africa
- 10.10.1. Ghana
- 10.10.2. Ivory Coast
- 10.10.3. Nigeria
- 10.10.4. Cote D'lvoire
- 10.10.5. Cameroon
- 10.1. Market Analysis, Insights and Forecast - by North America
- 11. Asia Pacific Cocoa Beans Industry Analysis, Insights and Forecast, 2021-2033
- 11.1. Market Analysis, Insights and Forecast - by North America
- 11.1.1. United States
- 11.1.2. Canada
- 11.2. Market Analysis, Insights and Forecast - by Europe
- 11.2.1. Germany
- 11.2.2. Netherland
- 11.2.3. United Kingdom
- 11.2.4. France
- 11.2.5. Belgium
- 11.2.6. Russia
- 11.3. Market Analysis, Insights and Forecast - by Asia-Pacific
- 11.3.1. India
- 11.3.2. Malaysia
- 11.3.3. Indonesia
- 11.3.4. Singapore
- 11.3.5. Japan
- 11.4. Market Analysis, Insights and Forecast - by South America
- 11.4.1. Brazil
- 11.4.2. Ecuador
- 11.5. Market Analysis, Insights and Forecast - by Africa
- 11.5.1. Ghana
- 11.5.2. Ivory Coast
- 11.5.3. Nigeria
- 11.5.4. Cote D'lvoire
- 11.5.5. Cameroon
- 11.6. Market Analysis, Insights and Forecast - by North America
- 11.6.1. United States
- 11.6.2. Canada
- 11.7. Market Analysis, Insights and Forecast - by Europe
- 11.7.1. Germany
- 11.7.2. Netherland
- 11.7.3. United Kingdom
- 11.7.4. France
- 11.7.5. Belgium
- 11.7.6. Russia
- 11.8. Market Analysis, Insights and Forecast - by Asia-Pacific
- 11.8.1. India
- 11.8.2. Malaysia
- 11.8.3. Indonesia
- 11.8.4. Singapore
- 11.8.5. Japan
- 11.9. Market Analysis, Insights and Forecast - by South America
- 11.9.1. Brazil
- 11.9.2. Ecuador
- 11.10. Market Analysis, Insights and Forecast - by Africa
- 11.10.1. Ghana
- 11.10.2. Ivory Coast
- 11.10.3. Nigeria
- 11.10.4. Cote D'lvoire
- 11.10.5. Cameroon
- 11.1. Market Analysis, Insights and Forecast - by North America
- 12. Competitive Analysis
- 12.1. Company Profiles
- 12.1.1 Cargill
- 12.1.1.1. Company Overview
- 12.1.1.2. Products
- 12.1.1.3. Company Financials
- 12.1.1.4. SWOT Analysis
- 12.1.2 Mars
- 12.1.2.1. Company Overview
- 12.1.2.2. Products
- 12.1.2.3. Company Financials
- 12.1.2.4. SWOT Analysis
- 12.1.3 Mondelez International
- 12.1.3.1. Company Overview
- 12.1.3.2. Products
- 12.1.3.3. Company Financials
- 12.1.3.4. SWOT Analysis
- 12.1.4 Olam International
- 12.1.4.1. Company Overview
- 12.1.4.2. Products
- 12.1.4.3. Company Financials
- 12.1.4.4. SWOT Analysis
- 12.1.5 Barry Callebaut
- 12.1.5.1. Company Overview
- 12.1.5.2. Products
- 12.1.5.3. Company Financials
- 12.1.5.4. SWOT Analysis
- 12.1.1 Cargill
- 12.2. Market Entropy
- 12.2.1 Company's Key Areas Served
- 12.2.2 Recent Developments
- 12.3. Company Market Share Analysis 2025
- 12.3.1 Top 5 Companies Market Share Analysis
- 12.3.2 Top 3 Companies Market Share Analysis
- 12.4. List of Potential Customers
- 13. Research Methodology
List of Figures
- Figure 1: Global Cocoa Beans Industry Revenue Breakdown (Million, %) by Region 2025 & 2033
- Figure 2: North America Cocoa Beans Industry Revenue (Million), by North America 2025 & 2033
- Figure 3: North America Cocoa Beans Industry Revenue Share (%), by North America 2025 & 2033
- Figure 4: North America Cocoa Beans Industry Revenue (Million), by Europe 2025 & 2033
- Figure 5: North America Cocoa Beans Industry Revenue Share (%), by Europe 2025 & 2033
- Figure 6: North America Cocoa Beans Industry Revenue (Million), by Asia-Pacific 2025 & 2033
- Figure 7: North America Cocoa Beans Industry Revenue Share (%), by Asia-Pacific 2025 & 2033
- Figure 8: North America Cocoa Beans Industry Revenue (Million), by South America 2025 & 2033
- Figure 9: North America Cocoa Beans Industry Revenue Share (%), by South America 2025 & 2033
- Figure 10: North America Cocoa Beans Industry Revenue (Million), by Africa 2025 & 2033
- Figure 11: North America Cocoa Beans Industry Revenue Share (%), by Africa 2025 & 2033
- Figure 12: North America Cocoa Beans Industry Revenue (Million), by North America 2025 & 2033
- Figure 13: North America Cocoa Beans Industry Revenue Share (%), by North America 2025 & 2033
- Figure 14: North America Cocoa Beans Industry Revenue (Million), by Europe 2025 & 2033
- Figure 15: North America Cocoa Beans Industry Revenue Share (%), by Europe 2025 & 2033
- Figure 16: North America Cocoa Beans Industry Revenue (Million), by Asia-Pacific 2025 & 2033
- Figure 17: North America Cocoa Beans Industry Revenue Share (%), by Asia-Pacific 2025 & 2033
- Figure 18: North America Cocoa Beans Industry Revenue (Million), by South America 2025 & 2033
- Figure 19: North America Cocoa Beans Industry Revenue Share (%), by South America 2025 & 2033
- Figure 20: North America Cocoa Beans Industry Revenue (Million), by Africa 2025 & 2033
- Figure 21: North America Cocoa Beans Industry Revenue Share (%), by Africa 2025 & 2033
- Figure 22: North America Cocoa Beans Industry Revenue (Million), by Country 2025 & 2033
- Figure 23: North America Cocoa Beans Industry Revenue Share (%), by Country 2025 & 2033
- Figure 24: South America Cocoa Beans Industry Revenue (Million), by North America 2025 & 2033
- Figure 25: South America Cocoa Beans Industry Revenue Share (%), by North America 2025 & 2033
- Figure 26: South America Cocoa Beans Industry Revenue (Million), by Europe 2025 & 2033
- Figure 27: South America Cocoa Beans Industry Revenue Share (%), by Europe 2025 & 2033
- Figure 28: South America Cocoa Beans Industry Revenue (Million), by Asia-Pacific 2025 & 2033
- Figure 29: South America Cocoa Beans Industry Revenue Share (%), by Asia-Pacific 2025 & 2033
- Figure 30: South America Cocoa Beans Industry Revenue (Million), by South America 2025 & 2033
- Figure 31: South America Cocoa Beans Industry Revenue Share (%), by South America 2025 & 2033
- Figure 32: South America Cocoa Beans Industry Revenue (Million), by Africa 2025 & 2033
- Figure 33: South America Cocoa Beans Industry Revenue Share (%), by Africa 2025 & 2033
- Figure 34: South America Cocoa Beans Industry Revenue (Million), by North America 2025 & 2033
- Figure 35: South America Cocoa Beans Industry Revenue Share (%), by North America 2025 & 2033
- Figure 36: South America Cocoa Beans Industry Revenue (Million), by Europe 2025 & 2033
- Figure 37: South America Cocoa Beans Industry Revenue Share (%), by Europe 2025 & 2033
- Figure 38: South America Cocoa Beans Industry Revenue (Million), by Asia-Pacific 2025 & 2033
- Figure 39: South America Cocoa Beans Industry Revenue Share (%), by Asia-Pacific 2025 & 2033
- Figure 40: South America Cocoa Beans Industry Revenue (Million), by South America 2025 & 2033
- Figure 41: South America Cocoa Beans Industry Revenue Share (%), by South America 2025 & 2033
- Figure 42: South America Cocoa Beans Industry Revenue (Million), by Africa 2025 & 2033
- Figure 43: South America Cocoa Beans Industry Revenue Share (%), by Africa 2025 & 2033
- Figure 44: South America Cocoa Beans Industry Revenue (Million), by Country 2025 & 2033
- Figure 45: South America Cocoa Beans Industry Revenue Share (%), by Country 2025 & 2033
- Figure 46: Europe Cocoa Beans Industry Revenue (Million), by North America 2025 & 2033
- Figure 47: Europe Cocoa Beans Industry Revenue Share (%), by North America 2025 & 2033
- Figure 48: Europe Cocoa Beans Industry Revenue (Million), by Europe 2025 & 2033
- Figure 49: Europe Cocoa Beans Industry Revenue Share (%), by Europe 2025 & 2033
- Figure 50: Europe Cocoa Beans Industry Revenue (Million), by Asia-Pacific 2025 & 2033
- Figure 51: Europe Cocoa Beans Industry Revenue Share (%), by Asia-Pacific 2025 & 2033
- Figure 52: Europe Cocoa Beans Industry Revenue (Million), by South America 2025 & 2033
- Figure 53: Europe Cocoa Beans Industry Revenue Share (%), by South America 2025 & 2033
- Figure 54: Europe Cocoa Beans Industry Revenue (Million), by Africa 2025 & 2033
- Figure 55: Europe Cocoa Beans Industry Revenue Share (%), by Africa 2025 & 2033
- Figure 56: Europe Cocoa Beans Industry Revenue (Million), by North America 2025 & 2033
- Figure 57: Europe Cocoa Beans Industry Revenue Share (%), by North America 2025 & 2033
- Figure 58: Europe Cocoa Beans Industry Revenue (Million), by Europe 2025 & 2033
- Figure 59: Europe Cocoa Beans Industry Revenue Share (%), by Europe 2025 & 2033
- Figure 60: Europe Cocoa Beans Industry Revenue (Million), by Asia-Pacific 2025 & 2033
- Figure 61: Europe Cocoa Beans Industry Revenue Share (%), by Asia-Pacific 2025 & 2033
- Figure 62: Europe Cocoa Beans Industry Revenue (Million), by South America 2025 & 2033
- Figure 63: Europe Cocoa Beans Industry Revenue Share (%), by South America 2025 & 2033
- Figure 64: Europe Cocoa Beans Industry Revenue (Million), by Africa 2025 & 2033
- Figure 65: Europe Cocoa Beans Industry Revenue Share (%), by Africa 2025 & 2033
- Figure 66: Europe Cocoa Beans Industry Revenue (Million), by Country 2025 & 2033
- Figure 67: Europe Cocoa Beans Industry Revenue Share (%), by Country 2025 & 2033
- Figure 68: Middle East & Africa Cocoa Beans Industry Revenue (Million), by North America 2025 & 2033
- Figure 69: Middle East & Africa Cocoa Beans Industry Revenue Share (%), by North America 2025 & 2033
- Figure 70: Middle East & Africa Cocoa Beans Industry Revenue (Million), by Europe 2025 & 2033
- Figure 71: Middle East & Africa Cocoa Beans Industry Revenue Share (%), by Europe 2025 & 2033
- Figure 72: Middle East & Africa Cocoa Beans Industry Revenue (Million), by Asia-Pacific 2025 & 2033
- Figure 73: Middle East & Africa Cocoa Beans Industry Revenue Share (%), by Asia-Pacific 2025 & 2033
- Figure 74: Middle East & Africa Cocoa Beans Industry Revenue (Million), by South America 2025 & 2033
- Figure 75: Middle East & Africa Cocoa Beans Industry Revenue Share (%), by South America 2025 & 2033
- Figure 76: Middle East & Africa Cocoa Beans Industry Revenue (Million), by Africa 2025 & 2033
- Figure 77: Middle East & Africa Cocoa Beans Industry Revenue Share (%), by Africa 2025 & 2033
- Figure 78: Middle East & Africa Cocoa Beans Industry Revenue (Million), by North America 2025 & 2033
- Figure 79: Middle East & Africa Cocoa Beans Industry Revenue Share (%), by North America 2025 & 2033
- Figure 80: Middle East & Africa Cocoa Beans Industry Revenue (Million), by Europe 2025 & 2033
- Figure 81: Middle East & Africa Cocoa Beans Industry Revenue Share (%), by Europe 2025 & 2033
- Figure 82: Middle East & Africa Cocoa Beans Industry Revenue (Million), by Asia-Pacific 2025 & 2033
- Figure 83: Middle East & Africa Cocoa Beans Industry Revenue Share (%), by Asia-Pacific 2025 & 2033
- Figure 84: Middle East & Africa Cocoa Beans Industry Revenue (Million), by South America 2025 & 2033
- Figure 85: Middle East & Africa Cocoa Beans Industry Revenue Share (%), by South America 2025 & 2033
- Figure 86: Middle East & Africa Cocoa Beans Industry Revenue (Million), by Africa 2025 & 2033
- Figure 87: Middle East & Africa Cocoa Beans Industry Revenue Share (%), by Africa 2025 & 2033
- Figure 88: Middle East & Africa Cocoa Beans Industry Revenue (Million), by Country 2025 & 2033
- Figure 89: Middle East & Africa Cocoa Beans Industry Revenue Share (%), by Country 2025 & 2033
- Figure 90: Asia Pacific Cocoa Beans Industry Revenue (Million), by North America 2025 & 2033
- Figure 91: Asia Pacific Cocoa Beans Industry Revenue Share (%), by North America 2025 & 2033
- Figure 92: Asia Pacific Cocoa Beans Industry Revenue (Million), by Europe 2025 & 2033
- Figure 93: Asia Pacific Cocoa Beans Industry Revenue Share (%), by Europe 2025 & 2033
- Figure 94: Asia Pacific Cocoa Beans Industry Revenue (Million), by Asia-Pacific 2025 & 2033
- Figure 95: Asia Pacific Cocoa Beans Industry Revenue Share (%), by Asia-Pacific 2025 & 2033
- Figure 96: Asia Pacific Cocoa Beans Industry Revenue (Million), by South America 2025 & 2033
- Figure 97: Asia Pacific Cocoa Beans Industry Revenue Share (%), by South America 2025 & 2033
- Figure 98: Asia Pacific Cocoa Beans Industry Revenue (Million), by Africa 2025 & 2033
- Figure 99: Asia Pacific Cocoa Beans Industry Revenue Share (%), by Africa 2025 & 2033
- Figure 100: Asia Pacific Cocoa Beans Industry Revenue (Million), by North America 2025 & 2033
- Figure 101: Asia Pacific Cocoa Beans Industry Revenue Share (%), by North America 2025 & 2033
- Figure 102: Asia Pacific Cocoa Beans Industry Revenue (Million), by Europe 2025 & 2033
- Figure 103: Asia Pacific Cocoa Beans Industry Revenue Share (%), by Europe 2025 & 2033
- Figure 104: Asia Pacific Cocoa Beans Industry Revenue (Million), by Asia-Pacific 2025 & 2033
- Figure 105: Asia Pacific Cocoa Beans Industry Revenue Share (%), by Asia-Pacific 2025 & 2033
- Figure 106: Asia Pacific Cocoa Beans Industry Revenue (Million), by South America 2025 & 2033
- Figure 107: Asia Pacific Cocoa Beans Industry Revenue Share (%), by South America 2025 & 2033
- Figure 108: Asia Pacific Cocoa Beans Industry Revenue (Million), by Africa 2025 & 2033
- Figure 109: Asia Pacific Cocoa Beans Industry Revenue Share (%), by Africa 2025 & 2033
- Figure 110: Asia Pacific Cocoa Beans Industry Revenue (Million), by Country 2025 & 2033
- Figure 111: Asia Pacific Cocoa Beans Industry Revenue Share (%), by Country 2025 & 2033
List of Tables
- Table 1: Global Cocoa Beans Industry Revenue Million Forecast, by North America 2020 & 2033
- Table 2: Global Cocoa Beans Industry Revenue Million Forecast, by Europe 2020 & 2033
- Table 3: Global Cocoa Beans Industry Revenue Million Forecast, by Asia-Pacific 2020 & 2033
- Table 4: Global Cocoa Beans Industry Revenue Million Forecast, by South America 2020 & 2033
- Table 5: Global Cocoa Beans Industry Revenue Million Forecast, by Africa 2020 & 2033
- Table 6: Global Cocoa Beans Industry Revenue Million Forecast, by North America 2020 & 2033
- Table 7: Global Cocoa Beans Industry Revenue Million Forecast, by Europe 2020 & 2033
- Table 8: Global Cocoa Beans Industry Revenue Million Forecast, by Asia-Pacific 2020 & 2033
- Table 9: Global Cocoa Beans Industry Revenue Million Forecast, by South America 2020 & 2033
- Table 10: Global Cocoa Beans Industry Revenue Million Forecast, by Africa 2020 & 2033
- Table 11: Global Cocoa Beans Industry Revenue Million Forecast, by Region 2020 & 2033
- Table 12: Global Cocoa Beans Industry Revenue Million Forecast, by North America 2020 & 2033
- Table 13: Global Cocoa Beans Industry Revenue Million Forecast, by Europe 2020 & 2033
- Table 14: Global Cocoa Beans Industry Revenue Million Forecast, by Asia-Pacific 2020 & 2033
- Table 15: Global Cocoa Beans Industry Revenue Million Forecast, by South America 2020 & 2033
- Table 16: Global Cocoa Beans Industry Revenue Million Forecast, by Africa 2020 & 2033
- Table 17: Global Cocoa Beans Industry Revenue Million Forecast, by North America 2020 & 2033
- Table 18: Global Cocoa Beans Industry Revenue Million Forecast, by Europe 2020 & 2033
- Table 19: Global Cocoa Beans Industry Revenue Million Forecast, by Asia-Pacific 2020 & 2033
- Table 20: Global Cocoa Beans Industry Revenue Million Forecast, by South America 2020 & 2033
- Table 21: Global Cocoa Beans Industry Revenue Million Forecast, by Africa 2020 & 2033
- Table 22: Global Cocoa Beans Industry Revenue Million Forecast, by Country 2020 & 2033
- Table 23: United States Cocoa Beans Industry Revenue (Million) Forecast, by Application 2020 & 2033
- Table 24: Canada Cocoa Beans Industry Revenue (Million) Forecast, by Application 2020 & 2033
- Table 25: Mexico Cocoa Beans Industry Revenue (Million) Forecast, by Application 2020 & 2033
- Table 26: Global Cocoa Beans Industry Revenue Million Forecast, by North America 2020 & 2033
- Table 27: Global Cocoa Beans Industry Revenue Million Forecast, by Europe 2020 & 2033
- Table 28: Global Cocoa Beans Industry Revenue Million Forecast, by Asia-Pacific 2020 & 2033
- Table 29: Global Cocoa Beans Industry Revenue Million Forecast, by South America 2020 & 2033
- Table 30: Global Cocoa Beans Industry Revenue Million Forecast, by Africa 2020 & 2033
- Table 31: Global Cocoa Beans Industry Revenue Million Forecast, by North America 2020 & 2033
- Table 32: Global Cocoa Beans Industry Revenue Million Forecast, by Europe 2020 & 2033
- Table 33: Global Cocoa Beans Industry Revenue Million Forecast, by Asia-Pacific 2020 & 2033
- Table 34: Global Cocoa Beans Industry Revenue Million Forecast, by South America 2020 & 2033
- Table 35: Global Cocoa Beans Industry Revenue Million Forecast, by Africa 2020 & 2033
- Table 36: Global Cocoa Beans Industry Revenue Million Forecast, by Country 2020 & 2033
- Table 37: Brazil Cocoa Beans Industry Revenue (Million) Forecast, by Application 2020 & 2033
- Table 38: Argentina Cocoa Beans Industry Revenue (Million) Forecast, by Application 2020 & 2033
- Table 39: Rest of South America Cocoa Beans Industry Revenue (Million) Forecast, by Application 2020 & 2033
- Table 40: Global Cocoa Beans Industry Revenue Million Forecast, by North America 2020 & 2033
- Table 41: Global Cocoa Beans Industry Revenue Million Forecast, by Europe 2020 & 2033
- Table 42: Global Cocoa Beans Industry Revenue Million Forecast, by Asia-Pacific 2020 & 2033
- Table 43: Global Cocoa Beans Industry Revenue Million Forecast, by South America 2020 & 2033
- Table 44: Global Cocoa Beans Industry Revenue Million Forecast, by Africa 2020 & 2033
- Table 45: Global Cocoa Beans Industry Revenue Million Forecast, by North America 2020 & 2033
- Table 46: Global Cocoa Beans Industry Revenue Million Forecast, by Europe 2020 & 2033
- Table 47: Global Cocoa Beans Industry Revenue Million Forecast, by Asia-Pacific 2020 & 2033
- Table 48: Global Cocoa Beans Industry Revenue Million Forecast, by South America 2020 & 2033
- Table 49: Global Cocoa Beans Industry Revenue Million Forecast, by Africa 2020 & 2033
- Table 50: Global Cocoa Beans Industry Revenue Million Forecast, by Country 2020 & 2033
- Table 51: United Kingdom Cocoa Beans Industry Revenue (Million) Forecast, by Application 2020 & 2033
- Table 52: Germany Cocoa Beans Industry Revenue (Million) Forecast, by Application 2020 & 2033
- Table 53: France Cocoa Beans Industry Revenue (Million) Forecast, by Application 2020 & 2033
- Table 54: Italy Cocoa Beans Industry Revenue (Million) Forecast, by Application 2020 & 2033
- Table 55: Spain Cocoa Beans Industry Revenue (Million) Forecast, by Application 2020 & 2033
- Table 56: Russia Cocoa Beans Industry Revenue (Million) Forecast, by Application 2020 & 2033
- Table 57: Benelux Cocoa Beans Industry Revenue (Million) Forecast, by Application 2020 & 2033
- Table 58: Nordics Cocoa Beans Industry Revenue (Million) Forecast, by Application 2020 & 2033
- Table 59: Rest of Europe Cocoa Beans Industry Revenue (Million) Forecast, by Application 2020 & 2033
- Table 60: Global Cocoa Beans Industry Revenue Million Forecast, by North America 2020 & 2033
- Table 61: Global Cocoa Beans Industry Revenue Million Forecast, by Europe 2020 & 2033
- Table 62: Global Cocoa Beans Industry Revenue Million Forecast, by Asia-Pacific 2020 & 2033
- Table 63: Global Cocoa Beans Industry Revenue Million Forecast, by South America 2020 & 2033
- Table 64: Global Cocoa Beans Industry Revenue Million Forecast, by Africa 2020 & 2033
- Table 65: Global Cocoa Beans Industry Revenue Million Forecast, by North America 2020 & 2033
- Table 66: Global Cocoa Beans Industry Revenue Million Forecast, by Europe 2020 & 2033
- Table 67: Global Cocoa Beans Industry Revenue Million Forecast, by Asia-Pacific 2020 & 2033
- Table 68: Global Cocoa Beans Industry Revenue Million Forecast, by South America 2020 & 2033
- Table 69: Global Cocoa Beans Industry Revenue Million Forecast, by Africa 2020 & 2033
- Table 70: Global Cocoa Beans Industry Revenue Million Forecast, by Country 2020 & 2033
- Table 71: Turkey Cocoa Beans Industry Revenue (Million) Forecast, by Application 2020 & 2033
- Table 72: Israel Cocoa Beans Industry Revenue (Million) Forecast, by Application 2020 & 2033
- Table 73: GCC Cocoa Beans Industry Revenue (Million) Forecast, by Application 2020 & 2033
- Table 74: North Africa Cocoa Beans Industry Revenue (Million) Forecast, by Application 2020 & 2033
- Table 75: South Africa Cocoa Beans Industry Revenue (Million) Forecast, by Application 2020 & 2033
- Table 76: Rest of Middle East & Africa Cocoa Beans Industry Revenue (Million) Forecast, by Application 2020 & 2033
- Table 77: Global Cocoa Beans Industry Revenue Million Forecast, by North America 2020 & 2033
- Table 78: Global Cocoa Beans Industry Revenue Million Forecast, by Europe 2020 & 2033
- Table 79: Global Cocoa Beans Industry Revenue Million Forecast, by Asia-Pacific 2020 & 2033
- Table 80: Global Cocoa Beans Industry Revenue Million Forecast, by South America 2020 & 2033
- Table 81: Global Cocoa Beans Industry Revenue Million Forecast, by Africa 2020 & 2033
- Table 82: Global Cocoa Beans Industry Revenue Million Forecast, by North America 2020 & 2033
- Table 83: Global Cocoa Beans Industry Revenue Million Forecast, by Europe 2020 & 2033
- Table 84: Global Cocoa Beans Industry Revenue Million Forecast, by Asia-Pacific 2020 & 2033
- Table 85: Global Cocoa Beans Industry Revenue Million Forecast, by South America 2020 & 2033
- Table 86: Global Cocoa Beans Industry Revenue Million Forecast, by Africa 2020 & 2033
- Table 87: Global Cocoa Beans Industry Revenue Million Forecast, by Country 2020 & 2033
- Table 88: China Cocoa Beans Industry Revenue (Million) Forecast, by Application 2020 & 2033
- Table 89: India Cocoa Beans Industry Revenue (Million) Forecast, by Application 2020 & 2033
- Table 90: Japan Cocoa Beans Industry Revenue (Million) Forecast, by Application 2020 & 2033
- Table 91: South Korea Cocoa Beans Industry Revenue (Million) Forecast, by Application 2020 & 2033
- Table 92: ASEAN Cocoa Beans Industry Revenue (Million) Forecast, by Application 2020 & 2033
- Table 93: Oceania Cocoa Beans Industry Revenue (Million) Forecast, by Application 2020 & 2033
- Table 94: Rest of Asia Pacific Cocoa Beans Industry Revenue (Million) Forecast, by Application 2020 & 2033
Frequently Asked Questions
1. What is the projected Compound Annual Growth Rate (CAGR) of the Cocoa Beans Industry?
The projected CAGR is approximately 6.81%.
2. Which companies are prominent players in the Cocoa Beans Industry?
Key companies in the market include Cargill , Mars, Mondelez International , Olam International , Barry Callebaut.
3. What are the main segments of the Cocoa Beans Industry?
The market segments include North America, Europe, Asia-Pacific, South America, Africa, North America, Europe, Asia-Pacific, South America, Africa.
4. Can you provide details about the market size?
The market size is estimated to be USD 17.24 Million as of 2022.
5. What are some drivers contributing to market growth?
Increasing Demand for Indian Rice; Enhancing Production Capacities; Increasing Government Initiatives.
6. What are the notable trends driving market growth?
Wide Application of Cocoa in Different End-user Industries.
7. Are there any restraints impacting market growth?
Abiotic and Biotic Stresses in Rice Cultivation; High Market Entry Costs.
8. Can you provide examples of recent developments in the market?
October 2022: The European Union and its partners have collectively planned to raise 450 million euros (USD442 million) to support Ivory Coast's push to tackle child labor and deforestation linked to cocoa production.
9. What pricing options are available for accessing the report?
Pricing options include single-user, multi-user, and enterprise licenses priced at USD 4750, USD 5250, and USD 8750 respectively.
10. Is the market size provided in terms of value or volume?
The market size is provided in terms of value, measured in Million.
11. Are there any specific market keywords associated with the report?
Yes, the market keyword associated with the report is "Cocoa Beans Industry," which aids in identifying and referencing the specific market segment covered.
12. How do I determine which pricing option suits my needs best?
The pricing options vary based on user requirements and access needs. Individual users may opt for single-user licenses, while businesses requiring broader access may choose multi-user or enterprise licenses for cost-effective access to the report.
13. Are there any additional resources or data provided in the Cocoa Beans Industry report?
While the report offers comprehensive insights, it's advisable to review the specific contents or supplementary materials provided to ascertain if additional resources or data are available.
14. How can I stay updated on further developments or reports in the Cocoa Beans Industry?
To stay informed about further developments, trends, and reports in the Cocoa Beans Industry, consider subscribing to industry newsletters, following relevant companies and organizations, or regularly checking reputable industry news sources and publications.
Methodology
Step 1 - Identification of Relevant Samples Size from Population Database


Step 2 - Approaches for Defining Global Market Size (Value, Volume* & Price*)

Note*: In applicable scenarios
Step 3 - Data Sources
Primary Research
- Web Analytics
- Survey Reports
- Research Institute
- Latest Research Reports
- Opinion Leaders
Secondary Research
- Annual Reports
- White Paper
- Latest Press Release
- Industry Association
- Paid Database
- Investor Presentations

Step 4 - Data Triangulation
Involves using different sources of information in order to increase the validity of a study
These sources are likely to be stakeholders in a program - participants, other researchers, program staff, other community members, and so on.
Then we put all data in single framework & apply various statistical tools to find out the dynamic on the market.
During the analysis stage, feedback from the stakeholder groups would be compared to determine areas of agreement as well as areas of divergence