

Key Insights
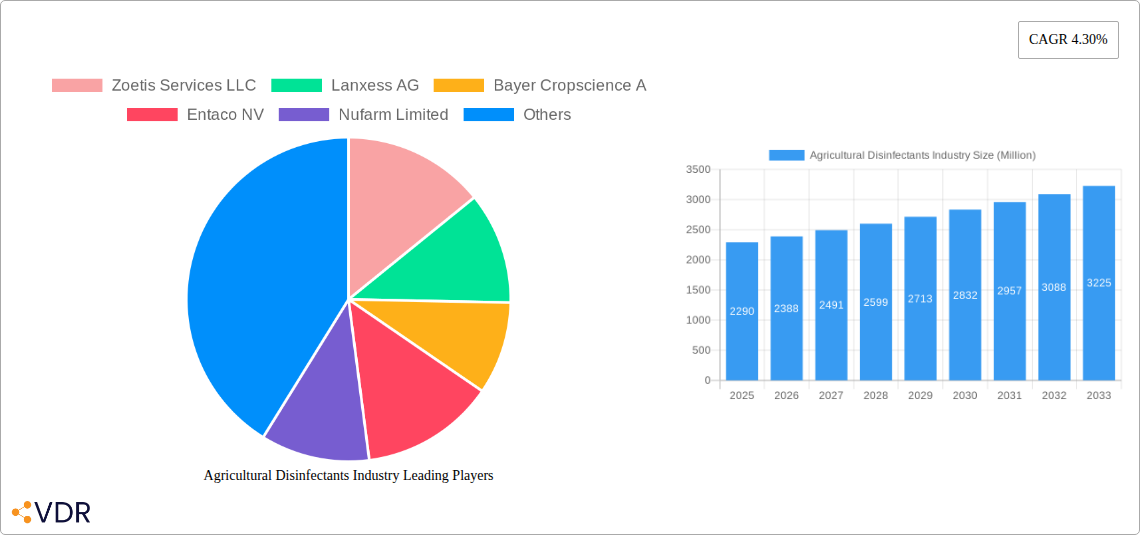
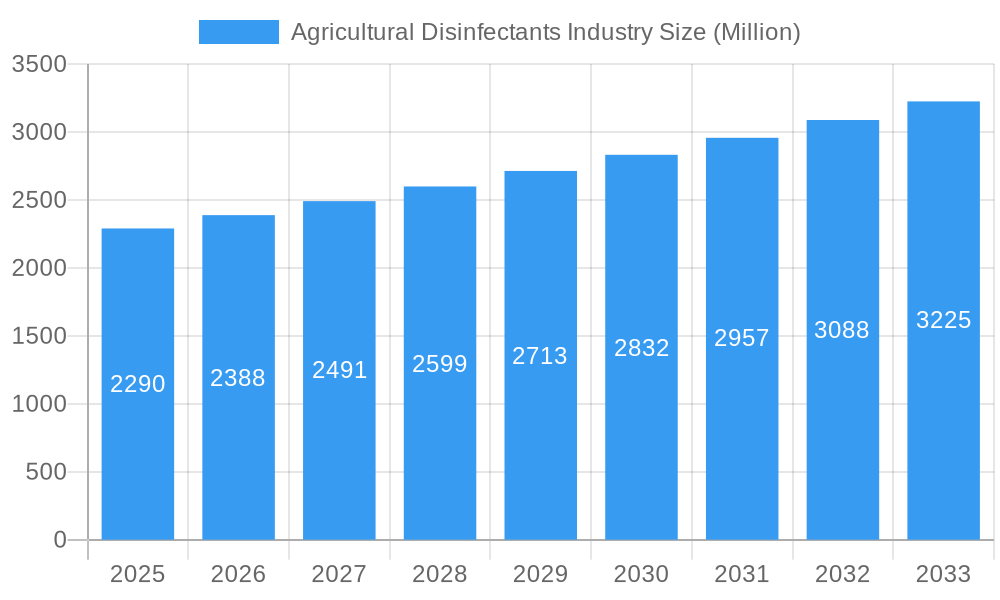
The agricultural disinfectants market, valued at $2.29 billion in 2025, is projected to experience robust growth, driven by the increasing prevalence of animal and plant diseases, stringent regulations concerning food safety, and the rising demand for high-quality agricultural produce. The market's compound annual growth rate (CAGR) of 4.30% from 2025 to 2033 indicates a steady expansion, fueled by factors such as advancements in disinfectant technology, leading to more effective and environmentally friendly solutions. Key segments contributing to this growth include liquid formulations, which offer ease of application and broader usage across various agricultural settings, and the surface application segment due to its critical role in preventing contamination in farming environments. Quaternary Ammonium Chloride Salts are expected to dominate the chemical type segment due to their established efficacy and cost-effectiveness. The growing adoption of integrated pest management (IPM) strategies further supports market expansion by promoting the judicious use of disinfectants alongside other pest control methods. Geographic growth is expected to be driven by developing economies in Asia-Pacific, fueled by rising agricultural activities and increasing awareness of hygiene protocols.
Agricultural Disinfectants Industry Market Size (In Billion)
However, factors like the stringent regulatory landscape surrounding the use of chemical disinfectants, concerns about potential environmental impacts, and the availability of alternative pest control methods could pose challenges to market growth. Further research and development into eco-friendly and biodegradable disinfectants will be crucial to address these concerns and ensure sustainable market expansion. The competitive landscape is characterized by a mix of large multinational corporations and specialized smaller firms, leading to innovation and diverse product offerings. Future market success will hinge on companies’ ability to adapt to evolving regulatory frameworks, develop sustainable products, and cater to the growing demand for effective and environmentally responsible agricultural disinfection solutions.
Agricultural Disinfectants Industry Company Market Share
Agricultural Disinfectants Industry Market Report: 2019-2033
This comprehensive report provides a detailed analysis of the Agricultural Disinfectants market, encompassing its dynamics, growth trends, dominant segments, and key players. The study period covers 2019-2033, with a base year of 2025 and a forecast period of 2025-2033. The report utilizes data from the historical period (2019-2024) to predict future market trends. Market values are presented in Million Units.
Keywords: Agricultural Disinfectants, Quaternary Ammonium Chloride Salts, Hydrogen Dioxide, Pyeroxyacetic Acid, Hypochlorites, Halogens, Liquid Disinfectants, Powder Disinfectants, Surface Disinfectants, Aerial Disinfectants, Water Sanitizing, Zoetis, Lanxess, Bayer, Entaco, Nufarm, Corteva, Stepan, Neogen, Thymox, Ceva, Animal Health, Crop Protection, Hygiene, Market Size, Market Share, CAGR, Growth Forecast.
Agricultural Disinfectants Industry Market Dynamics & Structure
The agricultural disinfectants market is characterized by moderate concentration, with a few major players holding significant market share. Technological innovation, driven by the need for more effective and environmentally friendly solutions, is a key driver. Stringent regulatory frameworks regarding chemical usage significantly impact market dynamics. Competitive substitutes, including natural disinfectants, pose a challenge. The end-user demographic comprises agricultural producers, veterinary clinics, and food processing facilities. Mergers and acquisitions (M&A) activity has played a role in consolidating market share.
- Market Concentration: Moderately concentrated, with top 5 players holding approximately xx% market share in 2024.
- Technological Innovation: Focus on developing broader-spectrum, environmentally benign, and cost-effective disinfectants. Barriers include high R&D costs and stringent regulatory approvals.
- Regulatory Frameworks: Stringent regulations concerning the use of specific chemicals impact product development and market access.
- Competitive Substitutes: Growing interest in natural and bio-based disinfectants is posing a competitive threat.
- End-User Demographics: Diverse, encompassing large-scale farms, smallholder farmers, livestock producers, and food processing units.
- M&A Trends: Consolidation is occurring through acquisitions of smaller companies with specialized technologies or regional presence. xx M&A deals were recorded between 2019 and 2024.
Agricultural Disinfectants Industry Growth Trends & Insights
The agricultural disinfectants market experienced robust growth during the historical period (2019-2024), driven by increasing demand for food safety and animal health. The market is projected to maintain a healthy growth trajectory during the forecast period (2025-2033), with a Compound Annual Growth Rate (CAGR) of xx%. Increased adoption of advanced farming techniques, rising concerns regarding antimicrobial resistance, and growing awareness of biosecurity are major growth catalysts. Technological disruptions, such as the introduction of novel formulations and delivery systems, are further shaping market dynamics. Consumer behavior shifts towards sustainably produced food are influencing demand for environmentally friendly disinfectants.
- Market Size: The global market size was valued at xx Million Units in 2024 and is projected to reach xx Million Units by 2033.
- CAGR: Projected CAGR of xx% during 2025-2033.
- Market Penetration: xx% penetration rate in key agricultural regions as of 2024.
- Technological Disruptions: Increasing adoption of nanotechnology-based and other advanced formulations.
- Consumer Behavior: Growing preference for environmentally friendly and residue-free disinfectants.
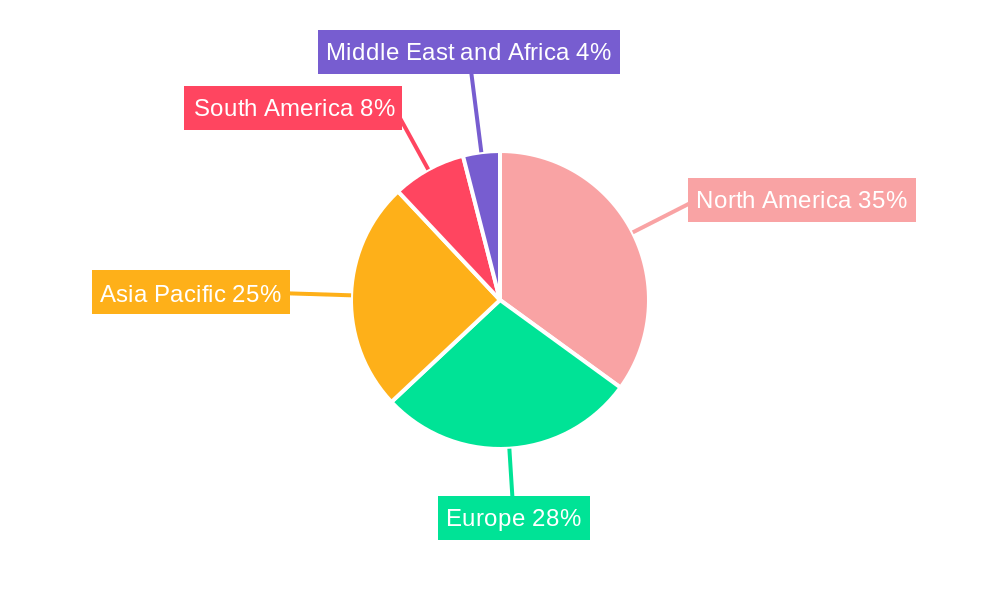
Dominant Regions, Countries, or Segments in Agricultural Disinfectants Industry
The North American and European markets currently dominate the agricultural disinfectants industry, driven by high adoption rates, stringent regulations, and a robust animal health sector. Within chemical types, Quaternary Ammonium Chloride Salts hold the largest market share due to its effectiveness and affordability. Liquid formulations dominate due to ease of application, while surface application remains the primary method.
- Leading Regions: North America and Europe command the largest market share, due to stringent regulations and high adoption rates. The Asia-Pacific region exhibits significant growth potential.
- Leading Chemical Type: Quaternary Ammonium Chloride Salts hold the largest market share (xx%), followed by Hydrogen Dioxide and Pyeroxyacetic Acid (xx%).
- Leading Form: Liquid formulations (xx%) are preferred for ease of application.
- Leading Application: Surface disinfection (xx%) accounts for the majority of usage.
- Growth Drivers: Stringent food safety regulations, growing awareness of biosecurity, and favorable government policies are contributing to regional growth.
Agricultural Disinfectants Industry Product Landscape
The agricultural disinfectants market offers a diverse range of products tailored to specific applications. Innovations focus on enhancing efficacy, safety, and environmental compatibility. Products are differentiated based on chemical composition, formulation, application method, and target pathogens. Unique selling propositions include broad-spectrum efficacy, reduced environmental impact, and user-friendly application methods. Technological advancements include the development of nanotechnology-based formulations and controlled-release systems.
Key Drivers, Barriers & Challenges in Agricultural Disinfectants Industry
Key Drivers:
- Growing awareness of biosecurity and food safety.
- Stringent government regulations promoting disease prevention.
- Rising livestock and crop production.
- Technological advancements leading to improved efficacy and environmental profiles.
Challenges and Restraints:
- High cost of research and development for novel formulations.
- Stringent regulatory approvals and labeling requirements.
- Increasing competition from bio-based and natural alternatives.
- Fluctuations in raw material prices and supply chain disruptions. Supply chain disruptions resulted in a xx% price increase in 2022.
Emerging Opportunities in Agricultural Disinfectants Industry
- Growing demand for organic and sustainable agricultural practices.
- Expanding application in aquaculture and other specialized agricultural segments.
- Development of new formulations targeting specific pathogens.
- Increased focus on personalized disinfection strategies.
Growth Accelerators in the Agricultural Disinfectants Industry
Strategic collaborations, expansion into emerging markets, and the development of innovative product formulations are key catalysts driving long-term growth in the agricultural disinfectants market. Technological breakthroughs, such as nanotechnology and AI-driven solutions for optimized application, will propel market expansion.
Key Players Shaping the Agricultural Disinfectants Industry Market
- Zoetis Services LLC
- Lanxess AG
- Bayer Cropscience A
- Entaco NV
- Nufarm Limited
- Corteva Agri Science
- Stepan Company
- Neogen Corporation
- Thymox Technology
- Ceva Sante Animale Group
Notable Milestones in Agricultural Disinfectants Industry Sector
- 2021 (Q4): Ceva Santé Animale Group and INRAE Technologies signed a collaboration agreement focusing on animal, human, and environmental health, particularly infectious disease prevention and animal welfare improvement.
- 2021 (Q3): Lanxess AG acquired Theseo, a disinfection and hygiene solutions provider, strengthening its position in animal hygiene.
In-Depth Agricultural Disinfectants Industry Market Outlook
The agricultural disinfectants market exhibits strong growth potential driven by the increasing demand for food safety and biosecurity, coupled with technological advancements. Strategic partnerships and expansion into emerging markets will further contribute to market expansion. The market is poised for substantial growth in the coming years, with significant opportunities for companies to innovate and capture market share.
Agricultural Disinfectants Industry Segmentation
- 1. Production Analysis
- 2. Consumption Analysis
- 3. Import Market Analysis (Value & Volume)
- 4. Export Market Analysis (Value & Volume)
- 5. Price Trend Analysis
Agricultural Disinfectants Industry Segmentation By Geography
-
1. North America
- 1.1. United States
- 1.2. Canada
- 1.3. Mexico
-
2. South America
- 2.1. Brazil
- 2.2. Argentina
- 2.3. Rest of South America
-
3. Europe
- 3.1. United Kingdom
- 3.2. Germany
- 3.3. France
- 3.4. Italy
- 3.5. Spain
- 3.6. Russia
- 3.7. Benelux
- 3.8. Nordics
- 3.9. Rest of Europe
-
4. Middle East & Africa
- 4.1. Turkey
- 4.2. Israel
- 4.3. GCC
- 4.4. North Africa
- 4.5. South Africa
- 4.6. Rest of Middle East & Africa
-
5. Asia Pacific
- 5.1. China
- 5.2. India
- 5.3. Japan
- 5.4. South Korea
- 5.5. ASEAN
- 5.6. Oceania
- 5.7. Rest of Asia Pacific
Agricultural Disinfectants Industry Regional Market Share
Geographic Coverage of Agricultural Disinfectants Industry
Agricultural Disinfectants Industry REPORT HIGHLIGHTS
| Aspects | Details |
|---|---|
| Study Period | 2020-2034 |
| Base Year | 2025 |
| Estimated Year | 2026 |
| Forecast Period | 2026-2034 |
| Historical Period | 2020-2025 |
| Growth Rate | CAGR of 4.30% from 2020-2034 |
| Segmentation |
|
Table of Contents
- 1. Introduction
- 1.1. Research Scope
- 1.2. Market Segmentation
- 1.3. Research Objective
- 1.4. Definitions and Assumptions
- 2. Executive Summary
- 2.1. Market Snapshot
- 3. Market Dynamics
- 3.1. Market Drivers
- 3.2. Market Restrains
- 3.3. Market Trends
- 3.4. Market Opportunities
- 4. Market Factor Analysis
- 4.1. Porters Five Forces
- 4.1.1. Bargaining Power of Suppliers
- 4.1.2. Bargaining Power of Buyers
- 4.1.3. Threat of New Entrants
- 4.1.4. Threat of Substitutes
- 4.1.5. Competitive Rivalry
- 4.2. PESTEL analysis
- 4.3. BCG Analysis
- 4.3.1. Stars (High Growth, High Market Share)
- 4.3.2. Cash Cows (Low Growth, High Market Share)
- 4.3.3. Question Mark (High Growth, Low Market Share)
- 4.3.4. Dogs (Low Growth, Low Market Share)
- 4.4. Ansoff Matrix Analysis
- 4.5. Supply Chain Analysis
- 4.6. Regulatory Landscape
- 4.7. Current Market Potential and Opportunity Assessment (TAM–SAM–SOM Framework)
- 4.8. VDR Analyst Note
- 4.1. Porters Five Forces
- 5. Market Analysis, Insights and Forecast 2021-2033
- 5.1. Market Analysis, Insights and Forecast - by Production Analysis
- 5.2. Market Analysis, Insights and Forecast - by Consumption Analysis
- 5.3. Market Analysis, Insights and Forecast - by Import Market Analysis (Value & Volume)
- 5.4. Market Analysis, Insights and Forecast - by Export Market Analysis (Value & Volume)
- 5.5. Market Analysis, Insights and Forecast - by Price Trend Analysis
- 5.6. Market Analysis, Insights and Forecast - by Region
- 5.6.1. North America
- 5.6.2. South America
- 5.6.3. Europe
- 5.6.4. Middle East & Africa
- 5.6.5. Asia Pacific
- 6. Global Agricultural Disinfectants Industry Analysis, Insights and Forecast, 2021-2033
- 6.1. Market Analysis, Insights and Forecast - by Production Analysis
- 6.2. Market Analysis, Insights and Forecast - by Consumption Analysis
- 6.3. Market Analysis, Insights and Forecast - by Import Market Analysis (Value & Volume)
- 6.4. Market Analysis, Insights and Forecast - by Export Market Analysis (Value & Volume)
- 6.5. Market Analysis, Insights and Forecast - by Price Trend Analysis
- 7. North America Agricultural Disinfectants Industry Analysis, Insights and Forecast, 2021-2033
- 7.1. Market Analysis, Insights and Forecast - by Production Analysis
- 7.2. Market Analysis, Insights and Forecast - by Consumption Analysis
- 7.3. Market Analysis, Insights and Forecast - by Import Market Analysis (Value & Volume)
- 7.4. Market Analysis, Insights and Forecast - by Export Market Analysis (Value & Volume)
- 7.5. Market Analysis, Insights and Forecast - by Price Trend Analysis
- 8. South America Agricultural Disinfectants Industry Analysis, Insights and Forecast, 2021-2033
- 8.1. Market Analysis, Insights and Forecast - by Production Analysis
- 8.2. Market Analysis, Insights and Forecast - by Consumption Analysis
- 8.3. Market Analysis, Insights and Forecast - by Import Market Analysis (Value & Volume)
- 8.4. Market Analysis, Insights and Forecast - by Export Market Analysis (Value & Volume)
- 8.5. Market Analysis, Insights and Forecast - by Price Trend Analysis
- 9. Europe Agricultural Disinfectants Industry Analysis, Insights and Forecast, 2021-2033
- 9.1. Market Analysis, Insights and Forecast - by Production Analysis
- 9.2. Market Analysis, Insights and Forecast - by Consumption Analysis
- 9.3. Market Analysis, Insights and Forecast - by Import Market Analysis (Value & Volume)
- 9.4. Market Analysis, Insights and Forecast - by Export Market Analysis (Value & Volume)
- 9.5. Market Analysis, Insights and Forecast - by Price Trend Analysis
- 10. Middle East & Africa Agricultural Disinfectants Industry Analysis, Insights and Forecast, 2021-2033
- 10.1. Market Analysis, Insights and Forecast - by Production Analysis
- 10.2. Market Analysis, Insights and Forecast - by Consumption Analysis
- 10.3. Market Analysis, Insights and Forecast - by Import Market Analysis (Value & Volume)
- 10.4. Market Analysis, Insights and Forecast - by Export Market Analysis (Value & Volume)
- 10.5. Market Analysis, Insights and Forecast - by Price Trend Analysis
- 11. Asia Pacific Agricultural Disinfectants Industry Analysis, Insights and Forecast, 2021-2033
- 11.1. Market Analysis, Insights and Forecast - by Production Analysis
- 11.2. Market Analysis, Insights and Forecast - by Consumption Analysis
- 11.3. Market Analysis, Insights and Forecast - by Import Market Analysis (Value & Volume)
- 11.4. Market Analysis, Insights and Forecast - by Export Market Analysis (Value & Volume)
- 11.5. Market Analysis, Insights and Forecast - by Price Trend Analysis
- 12. Competitive Analysis
- 12.1. Company Profiles
- 12.1.1 Zoetis Services LLC
- 12.1.1.1. Company Overview
- 12.1.1.2. Products
- 12.1.1.3. Company Financials
- 12.1.1.4. SWOT Analysis
- 12.1.2 Lanxess AG
- 12.1.2.1. Company Overview
- 12.1.2.2. Products
- 12.1.2.3. Company Financials
- 12.1.2.4. SWOT Analysis
- 12.1.3 Bayer Cropscience A
- 12.1.3.1. Company Overview
- 12.1.3.2. Products
- 12.1.3.3. Company Financials
- 12.1.3.4. SWOT Analysis
- 12.1.4 Entaco NV
- 12.1.4.1. Company Overview
- 12.1.4.2. Products
- 12.1.4.3. Company Financials
- 12.1.4.4. SWOT Analysis
- 12.1.5 Nufarm Limited
- 12.1.5.1. Company Overview
- 12.1.5.2. Products
- 12.1.5.3. Company Financials
- 12.1.5.4. SWOT Analysis
- 12.1.6 Corteva Agri Science
- 12.1.6.1. Company Overview
- 12.1.6.2. Products
- 12.1.6.3. Company Financials
- 12.1.6.4. SWOT Analysis
- 12.1.7 Stepan Company
- 12.1.7.1. Company Overview
- 12.1.7.2. Products
- 12.1.7.3. Company Financials
- 12.1.7.4. SWOT Analysis
- 12.1.8 Neogen Corporation
- 12.1.8.1. Company Overview
- 12.1.8.2. Products
- 12.1.8.3. Company Financials
- 12.1.8.4. SWOT Analysis
- 12.1.9 Thymox Technology
- 12.1.9.1. Company Overview
- 12.1.9.2. Products
- 12.1.9.3. Company Financials
- 12.1.9.4. SWOT Analysis
- 12.1.10 Ceva Sante Animale Group
- 12.1.10.1. Company Overview
- 12.1.10.2. Products
- 12.1.10.3. Company Financials
- 12.1.10.4. SWOT Analysis
- 12.1.1 Zoetis Services LLC
- 12.2. Market Entropy
- 12.2.1 Company's Key Areas Served
- 12.2.2 Recent Developments
- 12.3. Company Market Share Analysis 2025
- 12.3.1 Top 5 Companies Market Share Analysis
- 12.3.2 Top 3 Companies Market Share Analysis
- 12.4. List of Potential Customers
- 13. Research Methodology
List of Figures
- Figure 1: Global Agricultural Disinfectants Industry Revenue Breakdown (Million, %) by Region 2025 & 2033
- Figure 2: North America Agricultural Disinfectants Industry Revenue (Million), by Production Analysis 2025 & 2033
- Figure 3: North America Agricultural Disinfectants Industry Revenue Share (%), by Production Analysis 2025 & 2033
- Figure 4: North America Agricultural Disinfectants Industry Revenue (Million), by Consumption Analysis 2025 & 2033
- Figure 5: North America Agricultural Disinfectants Industry Revenue Share (%), by Consumption Analysis 2025 & 2033
- Figure 6: North America Agricultural Disinfectants Industry Revenue (Million), by Import Market Analysis (Value & Volume) 2025 & 2033
- Figure 7: North America Agricultural Disinfectants Industry Revenue Share (%), by Import Market Analysis (Value & Volume) 2025 & 2033
- Figure 8: North America Agricultural Disinfectants Industry Revenue (Million), by Export Market Analysis (Value & Volume) 2025 & 2033
- Figure 9: North America Agricultural Disinfectants Industry Revenue Share (%), by Export Market Analysis (Value & Volume) 2025 & 2033
- Figure 10: North America Agricultural Disinfectants Industry Revenue (Million), by Price Trend Analysis 2025 & 2033
- Figure 11: North America Agricultural Disinfectants Industry Revenue Share (%), by Price Trend Analysis 2025 & 2033
- Figure 12: North America Agricultural Disinfectants Industry Revenue (Million), by Country 2025 & 2033
- Figure 13: North America Agricultural Disinfectants Industry Revenue Share (%), by Country 2025 & 2033
- Figure 14: South America Agricultural Disinfectants Industry Revenue (Million), by Production Analysis 2025 & 2033
- Figure 15: South America Agricultural Disinfectants Industry Revenue Share (%), by Production Analysis 2025 & 2033
- Figure 16: South America Agricultural Disinfectants Industry Revenue (Million), by Consumption Analysis 2025 & 2033
- Figure 17: South America Agricultural Disinfectants Industry Revenue Share (%), by Consumption Analysis 2025 & 2033
- Figure 18: South America Agricultural Disinfectants Industry Revenue (Million), by Import Market Analysis (Value & Volume) 2025 & 2033
- Figure 19: South America Agricultural Disinfectants Industry Revenue Share (%), by Import Market Analysis (Value & Volume) 2025 & 2033
- Figure 20: South America Agricultural Disinfectants Industry Revenue (Million), by Export Market Analysis (Value & Volume) 2025 & 2033
- Figure 21: South America Agricultural Disinfectants Industry Revenue Share (%), by Export Market Analysis (Value & Volume) 2025 & 2033
- Figure 22: South America Agricultural Disinfectants Industry Revenue (Million), by Price Trend Analysis 2025 & 2033
- Figure 23: South America Agricultural Disinfectants Industry Revenue Share (%), by Price Trend Analysis 2025 & 2033
- Figure 24: South America Agricultural Disinfectants Industry Revenue (Million), by Country 2025 & 2033
- Figure 25: South America Agricultural Disinfectants Industry Revenue Share (%), by Country 2025 & 2033
- Figure 26: Europe Agricultural Disinfectants Industry Revenue (Million), by Production Analysis 2025 & 2033
- Figure 27: Europe Agricultural Disinfectants Industry Revenue Share (%), by Production Analysis 2025 & 2033
- Figure 28: Europe Agricultural Disinfectants Industry Revenue (Million), by Consumption Analysis 2025 & 2033
- Figure 29: Europe Agricultural Disinfectants Industry Revenue Share (%), by Consumption Analysis 2025 & 2033
- Figure 30: Europe Agricultural Disinfectants Industry Revenue (Million), by Import Market Analysis (Value & Volume) 2025 & 2033
- Figure 31: Europe Agricultural Disinfectants Industry Revenue Share (%), by Import Market Analysis (Value & Volume) 2025 & 2033
- Figure 32: Europe Agricultural Disinfectants Industry Revenue (Million), by Export Market Analysis (Value & Volume) 2025 & 2033
- Figure 33: Europe Agricultural Disinfectants Industry Revenue Share (%), by Export Market Analysis (Value & Volume) 2025 & 2033
- Figure 34: Europe Agricultural Disinfectants Industry Revenue (Million), by Price Trend Analysis 2025 & 2033
- Figure 35: Europe Agricultural Disinfectants Industry Revenue Share (%), by Price Trend Analysis 2025 & 2033
- Figure 36: Europe Agricultural Disinfectants Industry Revenue (Million), by Country 2025 & 2033
- Figure 37: Europe Agricultural Disinfectants Industry Revenue Share (%), by Country 2025 & 2033
- Figure 38: Middle East & Africa Agricultural Disinfectants Industry Revenue (Million), by Production Analysis 2025 & 2033
- Figure 39: Middle East & Africa Agricultural Disinfectants Industry Revenue Share (%), by Production Analysis 2025 & 2033
- Figure 40: Middle East & Africa Agricultural Disinfectants Industry Revenue (Million), by Consumption Analysis 2025 & 2033
- Figure 41: Middle East & Africa Agricultural Disinfectants Industry Revenue Share (%), by Consumption Analysis 2025 & 2033
- Figure 42: Middle East & Africa Agricultural Disinfectants Industry Revenue (Million), by Import Market Analysis (Value & Volume) 2025 & 2033
- Figure 43: Middle East & Africa Agricultural Disinfectants Industry Revenue Share (%), by Import Market Analysis (Value & Volume) 2025 & 2033
- Figure 44: Middle East & Africa Agricultural Disinfectants Industry Revenue (Million), by Export Market Analysis (Value & Volume) 2025 & 2033
- Figure 45: Middle East & Africa Agricultural Disinfectants Industry Revenue Share (%), by Export Market Analysis (Value & Volume) 2025 & 2033
- Figure 46: Middle East & Africa Agricultural Disinfectants Industry Revenue (Million), by Price Trend Analysis 2025 & 2033
- Figure 47: Middle East & Africa Agricultural Disinfectants Industry Revenue Share (%), by Price Trend Analysis 2025 & 2033
- Figure 48: Middle East & Africa Agricultural Disinfectants Industry Revenue (Million), by Country 2025 & 2033
- Figure 49: Middle East & Africa Agricultural Disinfectants Industry Revenue Share (%), by Country 2025 & 2033
- Figure 50: Asia Pacific Agricultural Disinfectants Industry Revenue (Million), by Production Analysis 2025 & 2033
- Figure 51: Asia Pacific Agricultural Disinfectants Industry Revenue Share (%), by Production Analysis 2025 & 2033
- Figure 52: Asia Pacific Agricultural Disinfectants Industry Revenue (Million), by Consumption Analysis 2025 & 2033
- Figure 53: Asia Pacific Agricultural Disinfectants Industry Revenue Share (%), by Consumption Analysis 2025 & 2033
- Figure 54: Asia Pacific Agricultural Disinfectants Industry Revenue (Million), by Import Market Analysis (Value & Volume) 2025 & 2033
- Figure 55: Asia Pacific Agricultural Disinfectants Industry Revenue Share (%), by Import Market Analysis (Value & Volume) 2025 & 2033
- Figure 56: Asia Pacific Agricultural Disinfectants Industry Revenue (Million), by Export Market Analysis (Value & Volume) 2025 & 2033
- Figure 57: Asia Pacific Agricultural Disinfectants Industry Revenue Share (%), by Export Market Analysis (Value & Volume) 2025 & 2033
- Figure 58: Asia Pacific Agricultural Disinfectants Industry Revenue (Million), by Price Trend Analysis 2025 & 2033
- Figure 59: Asia Pacific Agricultural Disinfectants Industry Revenue Share (%), by Price Trend Analysis 2025 & 2033
- Figure 60: Asia Pacific Agricultural Disinfectants Industry Revenue (Million), by Country 2025 & 2033
- Figure 61: Asia Pacific Agricultural Disinfectants Industry Revenue Share (%), by Country 2025 & 2033
List of Tables
- Table 1: Global Agricultural Disinfectants Industry Revenue Million Forecast, by Production Analysis 2020 & 2033
- Table 2: Global Agricultural Disinfectants Industry Revenue Million Forecast, by Consumption Analysis 2020 & 2033
- Table 3: Global Agricultural Disinfectants Industry Revenue Million Forecast, by Import Market Analysis (Value & Volume) 2020 & 2033
- Table 4: Global Agricultural Disinfectants Industry Revenue Million Forecast, by Export Market Analysis (Value & Volume) 2020 & 2033
- Table 5: Global Agricultural Disinfectants Industry Revenue Million Forecast, by Price Trend Analysis 2020 & 2033
- Table 6: Global Agricultural Disinfectants Industry Revenue Million Forecast, by Region 2020 & 2033
- Table 7: Global Agricultural Disinfectants Industry Revenue Million Forecast, by Production Analysis 2020 & 2033
- Table 8: Global Agricultural Disinfectants Industry Revenue Million Forecast, by Consumption Analysis 2020 & 2033
- Table 9: Global Agricultural Disinfectants Industry Revenue Million Forecast, by Import Market Analysis (Value & Volume) 2020 & 2033
- Table 10: Global Agricultural Disinfectants Industry Revenue Million Forecast, by Export Market Analysis (Value & Volume) 2020 & 2033
- Table 11: Global Agricultural Disinfectants Industry Revenue Million Forecast, by Price Trend Analysis 2020 & 2033
- Table 12: Global Agricultural Disinfectants Industry Revenue Million Forecast, by Country 2020 & 2033
- Table 13: United States Agricultural Disinfectants Industry Revenue (Million) Forecast, by Application 2020 & 2033
- Table 14: Canada Agricultural Disinfectants Industry Revenue (Million) Forecast, by Application 2020 & 2033
- Table 15: Mexico Agricultural Disinfectants Industry Revenue (Million) Forecast, by Application 2020 & 2033
- Table 16: Global Agricultural Disinfectants Industry Revenue Million Forecast, by Production Analysis 2020 & 2033
- Table 17: Global Agricultural Disinfectants Industry Revenue Million Forecast, by Consumption Analysis 2020 & 2033
- Table 18: Global Agricultural Disinfectants Industry Revenue Million Forecast, by Import Market Analysis (Value & Volume) 2020 & 2033
- Table 19: Global Agricultural Disinfectants Industry Revenue Million Forecast, by Export Market Analysis (Value & Volume) 2020 & 2033
- Table 20: Global Agricultural Disinfectants Industry Revenue Million Forecast, by Price Trend Analysis 2020 & 2033
- Table 21: Global Agricultural Disinfectants Industry Revenue Million Forecast, by Country 2020 & 2033
- Table 22: Brazil Agricultural Disinfectants Industry Revenue (Million) Forecast, by Application 2020 & 2033
- Table 23: Argentina Agricultural Disinfectants Industry Revenue (Million) Forecast, by Application 2020 & 2033
- Table 24: Rest of South America Agricultural Disinfectants Industry Revenue (Million) Forecast, by Application 2020 & 2033
- Table 25: Global Agricultural Disinfectants Industry Revenue Million Forecast, by Production Analysis 2020 & 2033
- Table 26: Global Agricultural Disinfectants Industry Revenue Million Forecast, by Consumption Analysis 2020 & 2033
- Table 27: Global Agricultural Disinfectants Industry Revenue Million Forecast, by Import Market Analysis (Value & Volume) 2020 & 2033
- Table 28: Global Agricultural Disinfectants Industry Revenue Million Forecast, by Export Market Analysis (Value & Volume) 2020 & 2033
- Table 29: Global Agricultural Disinfectants Industry Revenue Million Forecast, by Price Trend Analysis 2020 & 2033
- Table 30: Global Agricultural Disinfectants Industry Revenue Million Forecast, by Country 2020 & 2033
- Table 31: United Kingdom Agricultural Disinfectants Industry Revenue (Million) Forecast, by Application 2020 & 2033
- Table 32: Germany Agricultural Disinfectants Industry Revenue (Million) Forecast, by Application 2020 & 2033
- Table 33: France Agricultural Disinfectants Industry Revenue (Million) Forecast, by Application 2020 & 2033
- Table 34: Italy Agricultural Disinfectants Industry Revenue (Million) Forecast, by Application 2020 & 2033
- Table 35: Spain Agricultural Disinfectants Industry Revenue (Million) Forecast, by Application 2020 & 2033
- Table 36: Russia Agricultural Disinfectants Industry Revenue (Million) Forecast, by Application 2020 & 2033
- Table 37: Benelux Agricultural Disinfectants Industry Revenue (Million) Forecast, by Application 2020 & 2033
- Table 38: Nordics Agricultural Disinfectants Industry Revenue (Million) Forecast, by Application 2020 & 2033
- Table 39: Rest of Europe Agricultural Disinfectants Industry Revenue (Million) Forecast, by Application 2020 & 2033
- Table 40: Global Agricultural Disinfectants Industry Revenue Million Forecast, by Production Analysis 2020 & 2033
- Table 41: Global Agricultural Disinfectants Industry Revenue Million Forecast, by Consumption Analysis 2020 & 2033
- Table 42: Global Agricultural Disinfectants Industry Revenue Million Forecast, by Import Market Analysis (Value & Volume) 2020 & 2033
- Table 43: Global Agricultural Disinfectants Industry Revenue Million Forecast, by Export Market Analysis (Value & Volume) 2020 & 2033
- Table 44: Global Agricultural Disinfectants Industry Revenue Million Forecast, by Price Trend Analysis 2020 & 2033
- Table 45: Global Agricultural Disinfectants Industry Revenue Million Forecast, by Country 2020 & 2033
- Table 46: Turkey Agricultural Disinfectants Industry Revenue (Million) Forecast, by Application 2020 & 2033
- Table 47: Israel Agricultural Disinfectants Industry Revenue (Million) Forecast, by Application 2020 & 2033
- Table 48: GCC Agricultural Disinfectants Industry Revenue (Million) Forecast, by Application 2020 & 2033
- Table 49: North Africa Agricultural Disinfectants Industry Revenue (Million) Forecast, by Application 2020 & 2033
- Table 50: South Africa Agricultural Disinfectants Industry Revenue (Million) Forecast, by Application 2020 & 2033
- Table 51: Rest of Middle East & Africa Agricultural Disinfectants Industry Revenue (Million) Forecast, by Application 2020 & 2033
- Table 52: Global Agricultural Disinfectants Industry Revenue Million Forecast, by Production Analysis 2020 & 2033
- Table 53: Global Agricultural Disinfectants Industry Revenue Million Forecast, by Consumption Analysis 2020 & 2033
- Table 54: Global Agricultural Disinfectants Industry Revenue Million Forecast, by Import Market Analysis (Value & Volume) 2020 & 2033
- Table 55: Global Agricultural Disinfectants Industry Revenue Million Forecast, by Export Market Analysis (Value & Volume) 2020 & 2033
- Table 56: Global Agricultural Disinfectants Industry Revenue Million Forecast, by Price Trend Analysis 2020 & 2033
- Table 57: Global Agricultural Disinfectants Industry Revenue Million Forecast, by Country 2020 & 2033
- Table 58: China Agricultural Disinfectants Industry Revenue (Million) Forecast, by Application 2020 & 2033
- Table 59: India Agricultural Disinfectants Industry Revenue (Million) Forecast, by Application 2020 & 2033
- Table 60: Japan Agricultural Disinfectants Industry Revenue (Million) Forecast, by Application 2020 & 2033
- Table 61: South Korea Agricultural Disinfectants Industry Revenue (Million) Forecast, by Application 2020 & 2033
- Table 62: ASEAN Agricultural Disinfectants Industry Revenue (Million) Forecast, by Application 2020 & 2033
- Table 63: Oceania Agricultural Disinfectants Industry Revenue (Million) Forecast, by Application 2020 & 2033
- Table 64: Rest of Asia Pacific Agricultural Disinfectants Industry Revenue (Million) Forecast, by Application 2020 & 2033
Frequently Asked Questions
1. What is the projected Compound Annual Growth Rate (CAGR) of the Agricultural Disinfectants Industry?
The projected CAGR is approximately 4.30%.
2. Which companies are prominent players in the Agricultural Disinfectants Industry?
Key companies in the market include Zoetis Services LLC, Lanxess AG, Bayer Cropscience A, Entaco NV, Nufarm Limited, Corteva Agri Science, Stepan Company, Neogen Corporation, Thymox Technology, Ceva Sante Animale Group.
3. What are the main segments of the Agricultural Disinfectants Industry?
The market segments include Production Analysis, Consumption Analysis, Import Market Analysis (Value & Volume), Export Market Analysis (Value & Volume), Price Trend Analysis.
4. Can you provide details about the market size?
The market size is estimated to be USD 2.29 Million as of 2022.
5. What are some drivers contributing to market growth?
Skilled Labor Shortage; Favorable Government Policies.
6. What are the notable trends driving market growth?
Growing Area Under Protected Cultivation.
7. Are there any restraints impacting market growth?
Fragmentation of Land Holdings; Increasing Interest of Farmers Toward Custom Hiring Center.
8. Can you provide examples of recent developments in the market?
In 2021, Ceva Santé Animale Group and INRAE Technologies signed an agreement to consolidate their collaboration in animal health. This collaboration will focus on the animal, human, and environmental health. It will particularly focus on the prevention of infectious diseases of animal origin and the improvement of animal welfare.
9. What pricing options are available for accessing the report?
Pricing options include single-user, multi-user, and enterprise licenses priced at USD 4750, USD 5250, and USD 8750 respectively.
10. Is the market size provided in terms of value or volume?
The market size is provided in terms of value, measured in Million.
11. Are there any specific market keywords associated with the report?
Yes, the market keyword associated with the report is "Agricultural Disinfectants Industry," which aids in identifying and referencing the specific market segment covered.
12. How do I determine which pricing option suits my needs best?
The pricing options vary based on user requirements and access needs. Individual users may opt for single-user licenses, while businesses requiring broader access may choose multi-user or enterprise licenses for cost-effective access to the report.
13. Are there any additional resources or data provided in the Agricultural Disinfectants Industry report?
While the report offers comprehensive insights, it's advisable to review the specific contents or supplementary materials provided to ascertain if additional resources or data are available.
14. How can I stay updated on further developments or reports in the Agricultural Disinfectants Industry?
To stay informed about further developments, trends, and reports in the Agricultural Disinfectants Industry, consider subscribing to industry newsletters, following relevant companies and organizations, or regularly checking reputable industry news sources and publications.
Methodology
Step 1 - Identification of Relevant Samples Size from Population Database


Step 2 - Approaches for Defining Global Market Size (Value, Volume* & Price*)

Note*: In applicable scenarios
Step 3 - Data Sources
Primary Research
- Web Analytics
- Survey Reports
- Research Institute
- Latest Research Reports
- Opinion Leaders
Secondary Research
- Annual Reports
- White Paper
- Latest Press Release
- Industry Association
- Paid Database
- Investor Presentations

Step 4 - Data Triangulation
Involves using different sources of information in order to increase the validity of a study
These sources are likely to be stakeholders in a program - participants, other researchers, program staff, other community members, and so on.
Then we put all data in single framework & apply various statistical tools to find out the dynamic on the market.
During the analysis stage, feedback from the stakeholder groups would be compared to determine areas of agreement as well as areas of divergence