

Key Insights
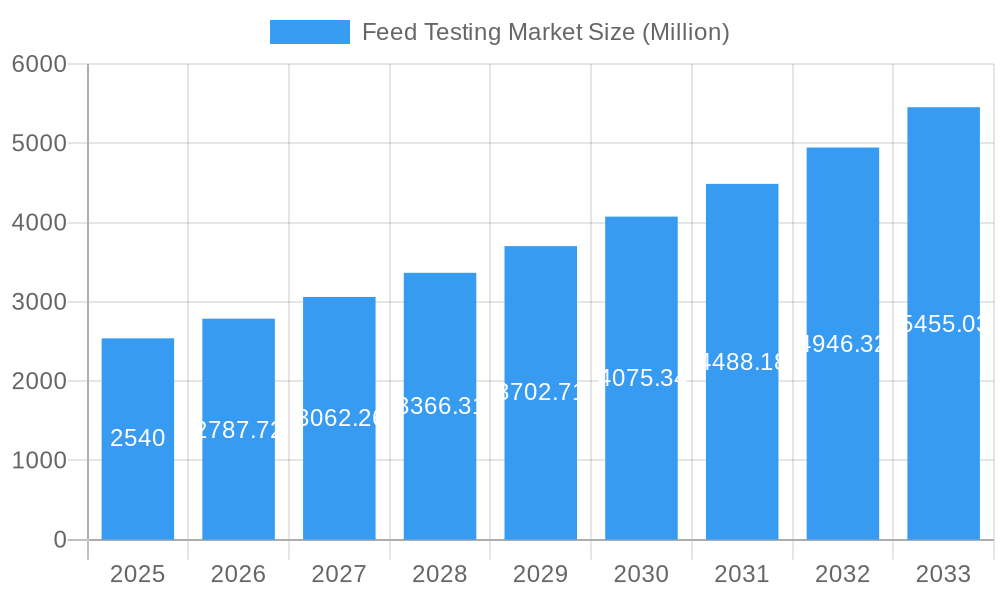
The global feed testing market, valued at $2.54 billion in 2025, is projected to experience robust growth, driven by increasing demand for safe and high-quality animal feed. A Compound Annual Growth Rate (CAGR) of 9.80% from 2025 to 2033 indicates a significant expansion of this market. Key drivers include stringent government regulations regarding feed safety and quality, rising consumer awareness of food safety, and the growing need for efficient feed management practices to enhance animal productivity. The increasing prevalence of foodborne illnesses linked to contaminated feed is further propelling market growth. Market segmentation reveals significant opportunities across various feed types, with ruminant, poultry, and swine feed segments dominating the market share. Pathogen testing constitutes a substantial portion of the overall market, reflecting concerns about bacterial and viral contamination. The rise of advanced analytical techniques, such as PCR and ELISA, is also contributing to market expansion, enabling faster and more accurate testing. Geographic distribution shows strong market presence in North America and Europe, attributed to established regulatory frameworks and robust agricultural industries. However, the Asia-Pacific region is anticipated to witness substantial growth driven by increasing livestock production and rising disposable incomes. Challenges for the market include high testing costs and the need for continuous technological advancements to meet evolving regulatory standards.
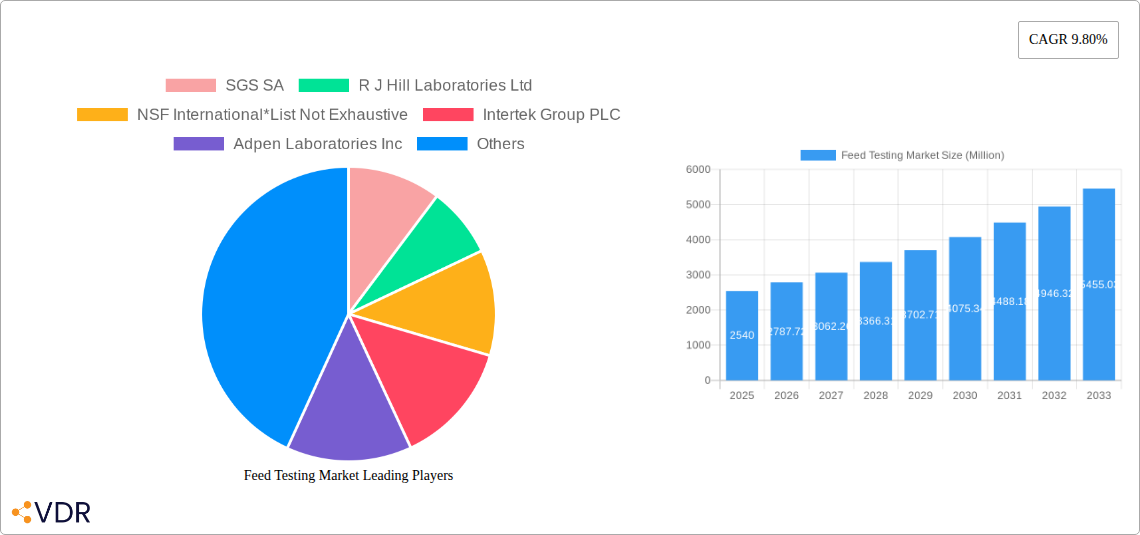
Feed Testing Market Market Size (In Billion)
The market's future growth trajectory will likely be influenced by several factors, including technological advancements in testing methods, expansion into emerging economies, and the evolving regulatory landscape. Companies are investing heavily in research and development to improve the accuracy, speed, and affordability of feed testing. The increasing adoption of automation and digitalization in laboratories further contributes to operational efficiency. The emergence of new testing methodologies targeting specific pathogens and toxins will create further niche market opportunities. The feed testing market's success depends on effective collaboration between stakeholders, including feed producers, testing laboratories, and regulatory bodies, to ensure the consistent supply of safe and nutritious animal feed, ultimately contributing to global food security.
Feed Testing Market Company Market Share
Feed Testing Market: A Comprehensive Market Report (2019-2033)
This comprehensive report provides an in-depth analysis of the Feed Testing Market, encompassing market dynamics, growth trends, regional dominance, product landscape, key players, and future outlook. The study period covers 2019-2033, with a base year of 2025 and a forecast period of 2025-2033. The report segments the market by Type (Pathogen Testing, Pesticide Residue Analysis, Nutritional Labeling Analysis, Fats and Oils Analysis, Mycotoxin Testing, Other Types) and Feed Type (Ruminant Feed, Poultry Feed, Swine Feed, Aquaculture Feed, Pet Food). The global market size is projected to reach xx Million by 2033.
Key Players: SGS SA, R J Hill Laboratories Ltd, NSF International, Intertek Group PLC, Adpen Laboratories Inc, Bruker Biosciences Corporation, Genetic ID NA Inc, Genon Laboratories Ltd, Eurofins Scientific, Invisible Sentinel Inc
Feed Testing Market Dynamics & Structure
The Feed Testing market is characterized by moderate concentration, with several large players and numerous smaller, specialized labs competing. Technological advancements, particularly in molecular diagnostics and rapid testing methods, are major drivers of growth. Stringent regulatory frameworks regarding food safety and animal health globally influence market demand, pushing for higher accuracy and faster turnaround times. Competitive substitutes include in-house testing capabilities for larger feed producers, but specialized labs often offer greater expertise and wider testing capabilities. The market witnesses frequent M&A activity, as larger companies consolidate their market share and expand their testing portfolios.
- Market Concentration: Moderately concentrated, with a few dominant players holding significant market share (estimated at xx% for the top 5 players in 2025).
- Technological Innovation: Rapid advancements in genomics, proteomics, and biosensors are driving faster, more accurate, and higher-throughput testing solutions.
- Regulatory Landscape: Stringent regulations related to food safety and animal feed quality in regions like the EU and North America significantly impact demand.
- Competitive Substitutes: In-house testing by large feed producers poses some competition, but specialized labs maintain an advantage in terms of expertise and breadth of services.
- M&A Activity: A significant number of mergers and acquisitions (estimated xx deals annually in the past 5 years) have shaped the market landscape.
- End-User Demographics: Growth is fueled by increased demand from large-scale commercial feed producers and growing awareness of food safety among consumers.
Feed Testing Market Growth Trends & Insights
The Feed Testing market exhibits a steady growth trajectory, driven by rising consumer awareness regarding food safety and animal health. The market experienced a CAGR of xx% during the historical period (2019-2024) and is projected to grow at a CAGR of xx% during the forecast period (2025-2033). This growth is fueled by the increasing demand for high-quality feed, technological advancements enabling rapid and efficient testing, and stricter regulatory compliance requirements. Consumer preferences for sustainably produced feed are also contributing to the market expansion. Increased adoption of advanced testing technologies is leading to improved accuracy and reduced testing times, impacting the market's overall growth and efficiency.
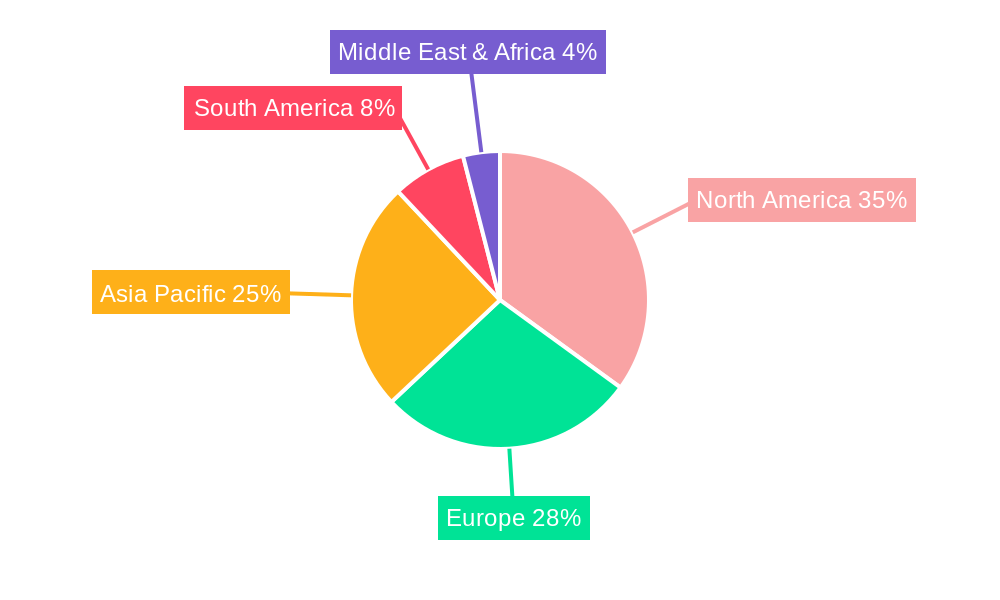
Dominant Regions, Countries, or Segments in Feed Testing Market
North America currently dominates the Feed Testing market, followed by Europe. The dominance of these regions is attributed to stringent regulatory frameworks, higher consumer awareness regarding food safety, and the presence of several large and established testing labs. Within the segment breakdown, Pathogen Testing and Pesticide Residue Analysis represent the largest segments by type, driven by concerns over foodborne illnesses and potential health risks associated with pesticide residues. Similarly, Ruminant Feed and Poultry Feed constitute major portions of the market by feed type, reflecting the high volume of these feed categories globally. Rapid economic development in Asia-Pacific is expected to drive significant future growth in this region.
- North America: Strong regulatory landscape, high consumer awareness, and presence of major testing companies drive market leadership.
- Europe: Stringent regulations and focus on food safety contribute to significant market share.
- Asia-Pacific: Rapid economic growth and increasing demand for animal protein are fueling significant growth potential.
- Pathogen Testing & Pesticide Residue Analysis: Largest segments by type due to stringent food safety regulations and consumer concerns.
- Ruminant Feed & Poultry Feed: Largest segments by feed type due to their high volume and global demand.
Feed Testing Market Product Landscape
The Feed Testing market offers a range of services, from basic pathogen detection to sophisticated analysis of pesticide residues, mycotoxins, and nutritional components. Recent innovations include rapid diagnostic tools utilizing PCR, ELISA, and other molecular techniques, enabling faster turnaround times and improved accuracy. These advancements enhance efficiency and cost-effectiveness for feed producers and testing labs alike. Key selling propositions include accuracy, speed, and comprehensive testing capabilities, catering to the specific needs of diverse clients.
Key Drivers, Barriers & Challenges in Feed Testing Market
Key Drivers: Increased awareness of food safety and animal health, stringent regulatory compliance, rising demand for high-quality feed, and technological advancements in testing methodologies.
Challenges: High cost of advanced testing technologies, potential supply chain disruptions impacting reagent availability, and intense competition among testing labs. Regulatory changes and their interpretation also pose a challenge. The total market impact of these challenges is estimated at xx Million annually.
Emerging Opportunities in Feed Testing Market
Emerging opportunities lie in the development and adoption of rapid, point-of-care testing devices for on-site analysis. Further growth is also expected from expanding into emerging markets, developing specialized testing solutions for niche feed types (e.g., insect-based feed), and addressing the growing demand for comprehensive data analytics and reporting. Utilizing AI and machine learning for predictive modeling and improved quality control presents a considerable opportunity.
Growth Accelerators in the Feed Testing Market Industry
Strategic partnerships between testing laboratories and feed producers, coupled with investments in R&D for novel testing technologies, significantly accelerate market growth. Expansion into untapped markets like developing economies and proactive adaptation to emerging regulatory changes further drive long-term growth. The continuous development and implementation of advanced testing methods and automation technologies also contribute to market expansion and growth.
Notable Milestones in Feed Testing Market Sector
- 2020: Increased adoption of rapid diagnostic tests due to pandemic-related supply chain disruptions.
- 2022: Launch of several new advanced analytical instruments by major players.
- 2023: Several significant mergers and acquisitions took place within the sector.
In-Depth Feed Testing Market Market Outlook
The Feed Testing market is poised for significant growth in the coming years. The rising demand for safe and high-quality feed, driven by increasing global populations and heightened consumer awareness, will be a primary driver. Strategic investments in R&D, technological advancements, and the expansion of testing capabilities in emerging markets will further shape the market's positive outlook. The adoption of innovative solutions, improved data analytics, and strategic collaborations will remain key to unlocking the significant future potential of the market.
Feed Testing Market Segmentation
- 1. Production Analysis
- 2. Consumption Analysis
- 3. Import Market Analysis (Value & Volume)
- 4. Export Market Analysis (Value & Volume)
- 5. Price Trend Analysis
Feed Testing Market Segmentation By Geography
-
1. North America
- 1.1. United States
- 1.2. Canada
- 1.3. Mexico
-
2. South America
- 2.1. Brazil
- 2.2. Argentina
- 2.3. Rest of South America
-
3. Europe
- 3.1. United Kingdom
- 3.2. Germany
- 3.3. France
- 3.4. Italy
- 3.5. Spain
- 3.6. Russia
- 3.7. Benelux
- 3.8. Nordics
- 3.9. Rest of Europe
-
4. Middle East & Africa
- 4.1. Turkey
- 4.2. Israel
- 4.3. GCC
- 4.4. North Africa
- 4.5. South Africa
- 4.6. Rest of Middle East & Africa
-
5. Asia Pacific
- 5.1. China
- 5.2. India
- 5.3. Japan
- 5.4. South Korea
- 5.5. ASEAN
- 5.6. Oceania
- 5.7. Rest of Asia Pacific
Feed Testing Market Regional Market Share
Geographic Coverage of Feed Testing Market
Feed Testing Market REPORT HIGHLIGHTS
| Aspects | Details |
|---|---|
| Study Period | 2020-2034 |
| Base Year | 2025 |
| Estimated Year | 2026 |
| Forecast Period | 2026-2034 |
| Historical Period | 2020-2025 |
| Growth Rate | CAGR of 9.80% from 2020-2034 |
| Segmentation |
|
Table of Contents
- 1. Introduction
- 1.1. Research Scope
- 1.2. Market Segmentation
- 1.3. Research Objective
- 1.4. Definitions and Assumptions
- 2. Executive Summary
- 2.1. Market Snapshot
- 3. Market Dynamics
- 3.1. Market Drivers
- 3.2. Market Restrains
- 3.3. Market Trends
- 3.4. Market Opportunities
- 4. Market Factor Analysis
- 4.1. Porters Five Forces
- 4.1.1. Bargaining Power of Suppliers
- 4.1.2. Bargaining Power of Buyers
- 4.1.3. Threat of New Entrants
- 4.1.4. Threat of Substitutes
- 4.1.5. Competitive Rivalry
- 4.2. PESTEL analysis
- 4.3. BCG Analysis
- 4.3.1. Stars (High Growth, High Market Share)
- 4.3.2. Cash Cows (Low Growth, High Market Share)
- 4.3.3. Question Mark (High Growth, Low Market Share)
- 4.3.4. Dogs (Low Growth, Low Market Share)
- 4.4. Ansoff Matrix Analysis
- 4.5. Supply Chain Analysis
- 4.6. Regulatory Landscape
- 4.7. Current Market Potential and Opportunity Assessment (TAM–SAM–SOM Framework)
- 4.8. VDR Analyst Note
- 4.1. Porters Five Forces
- 5. Market Analysis, Insights and Forecast 2021-2033
- 5.1. Market Analysis, Insights and Forecast - by Production Analysis
- 5.2. Market Analysis, Insights and Forecast - by Consumption Analysis
- 5.3. Market Analysis, Insights and Forecast - by Import Market Analysis (Value & Volume)
- 5.4. Market Analysis, Insights and Forecast - by Export Market Analysis (Value & Volume)
- 5.5. Market Analysis, Insights and Forecast - by Price Trend Analysis
- 5.6. Market Analysis, Insights and Forecast - by Region
- 5.6.1. North America
- 5.6.2. South America
- 5.6.3. Europe
- 5.6.4. Middle East & Africa
- 5.6.5. Asia Pacific
- 6. Global Feed Testing Market Analysis, Insights and Forecast, 2021-2033
- 6.1. Market Analysis, Insights and Forecast - by Production Analysis
- 6.2. Market Analysis, Insights and Forecast - by Consumption Analysis
- 6.3. Market Analysis, Insights and Forecast - by Import Market Analysis (Value & Volume)
- 6.4. Market Analysis, Insights and Forecast - by Export Market Analysis (Value & Volume)
- 6.5. Market Analysis, Insights and Forecast - by Price Trend Analysis
- 7. North America Feed Testing Market Analysis, Insights and Forecast, 2021-2033
- 7.1. Market Analysis, Insights and Forecast - by Production Analysis
- 7.2. Market Analysis, Insights and Forecast - by Consumption Analysis
- 7.3. Market Analysis, Insights and Forecast - by Import Market Analysis (Value & Volume)
- 7.4. Market Analysis, Insights and Forecast - by Export Market Analysis (Value & Volume)
- 7.5. Market Analysis, Insights and Forecast - by Price Trend Analysis
- 8. South America Feed Testing Market Analysis, Insights and Forecast, 2021-2033
- 8.1. Market Analysis, Insights and Forecast - by Production Analysis
- 8.2. Market Analysis, Insights and Forecast - by Consumption Analysis
- 8.3. Market Analysis, Insights and Forecast - by Import Market Analysis (Value & Volume)
- 8.4. Market Analysis, Insights and Forecast - by Export Market Analysis (Value & Volume)
- 8.5. Market Analysis, Insights and Forecast - by Price Trend Analysis
- 9. Europe Feed Testing Market Analysis, Insights and Forecast, 2021-2033
- 9.1. Market Analysis, Insights and Forecast - by Production Analysis
- 9.2. Market Analysis, Insights and Forecast - by Consumption Analysis
- 9.3. Market Analysis, Insights and Forecast - by Import Market Analysis (Value & Volume)
- 9.4. Market Analysis, Insights and Forecast - by Export Market Analysis (Value & Volume)
- 9.5. Market Analysis, Insights and Forecast - by Price Trend Analysis
- 10. Middle East & Africa Feed Testing Market Analysis, Insights and Forecast, 2021-2033
- 10.1. Market Analysis, Insights and Forecast - by Production Analysis
- 10.2. Market Analysis, Insights and Forecast - by Consumption Analysis
- 10.3. Market Analysis, Insights and Forecast - by Import Market Analysis (Value & Volume)
- 10.4. Market Analysis, Insights and Forecast - by Export Market Analysis (Value & Volume)
- 10.5. Market Analysis, Insights and Forecast - by Price Trend Analysis
- 11. Asia Pacific Feed Testing Market Analysis, Insights and Forecast, 2021-2033
- 11.1. Market Analysis, Insights and Forecast - by Production Analysis
- 11.2. Market Analysis, Insights and Forecast - by Consumption Analysis
- 11.3. Market Analysis, Insights and Forecast - by Import Market Analysis (Value & Volume)
- 11.4. Market Analysis, Insights and Forecast - by Export Market Analysis (Value & Volume)
- 11.5. Market Analysis, Insights and Forecast - by Price Trend Analysis
- 12. Competitive Analysis
- 12.1. Company Profiles
- 12.1.1 SGS SA
- 12.1.1.1. Company Overview
- 12.1.1.2. Products
- 12.1.1.3. Company Financials
- 12.1.1.4. SWOT Analysis
- 12.1.2 R J Hill Laboratories Ltd
- 12.1.2.1. Company Overview
- 12.1.2.2. Products
- 12.1.2.3. Company Financials
- 12.1.2.4. SWOT Analysis
- 12.1.3 NSF International*List Not Exhaustive
- 12.1.3.1. Company Overview
- 12.1.3.2. Products
- 12.1.3.3. Company Financials
- 12.1.3.4. SWOT Analysis
- 12.1.4 Intertek Group PLC
- 12.1.4.1. Company Overview
- 12.1.4.2. Products
- 12.1.4.3. Company Financials
- 12.1.4.4. SWOT Analysis
- 12.1.5 Adpen Laboratories Inc
- 12.1.5.1. Company Overview
- 12.1.5.2. Products
- 12.1.5.3. Company Financials
- 12.1.5.4. SWOT Analysis
- 12.1.6 Bruker Biosciences Corporation
- 12.1.6.1. Company Overview
- 12.1.6.2. Products
- 12.1.6.3. Company Financials
- 12.1.6.4. SWOT Analysis
- 12.1.7 Genetic ID NA Inc
- 12.1.7.1. Company Overview
- 12.1.7.2. Products
- 12.1.7.3. Company Financials
- 12.1.7.4. SWOT Analysis
- 12.1.8 Genon Laboratories Ltd
- 12.1.8.1. Company Overview
- 12.1.8.2. Products
- 12.1.8.3. Company Financials
- 12.1.8.4. SWOT Analysis
- 12.1.9 Eurofins Scientific
- 12.1.9.1. Company Overview
- 12.1.9.2. Products
- 12.1.9.3. Company Financials
- 12.1.9.4. SWOT Analysis
- 12.1.10 Invisible Sentinel Inc
- 12.1.10.1. Company Overview
- 12.1.10.2. Products
- 12.1.10.3. Company Financials
- 12.1.10.4. SWOT Analysis
- 12.1.1 SGS SA
- 12.2. Market Entropy
- 12.2.1 Company's Key Areas Served
- 12.2.2 Recent Developments
- 12.3. Company Market Share Analysis 2025
- 12.3.1 Top 5 Companies Market Share Analysis
- 12.3.2 Top 3 Companies Market Share Analysis
- 12.4. List of Potential Customers
- 13. Research Methodology
List of Figures
- Figure 1: Global Feed Testing Market Revenue Breakdown (Million, %) by Region 2025 & 2033
- Figure 2: Global Feed Testing Market Volume Breakdown (Kiloton, %) by Region 2025 & 2033
- Figure 3: North America Feed Testing Market Revenue (Million), by Production Analysis 2025 & 2033
- Figure 4: North America Feed Testing Market Volume (Kiloton), by Production Analysis 2025 & 2033
- Figure 5: North America Feed Testing Market Revenue Share (%), by Production Analysis 2025 & 2033
- Figure 6: North America Feed Testing Market Volume Share (%), by Production Analysis 2025 & 2033
- Figure 7: North America Feed Testing Market Revenue (Million), by Consumption Analysis 2025 & 2033
- Figure 8: North America Feed Testing Market Volume (Kiloton), by Consumption Analysis 2025 & 2033
- Figure 9: North America Feed Testing Market Revenue Share (%), by Consumption Analysis 2025 & 2033
- Figure 10: North America Feed Testing Market Volume Share (%), by Consumption Analysis 2025 & 2033
- Figure 11: North America Feed Testing Market Revenue (Million), by Import Market Analysis (Value & Volume) 2025 & 2033
- Figure 12: North America Feed Testing Market Volume (Kiloton), by Import Market Analysis (Value & Volume) 2025 & 2033
- Figure 13: North America Feed Testing Market Revenue Share (%), by Import Market Analysis (Value & Volume) 2025 & 2033
- Figure 14: North America Feed Testing Market Volume Share (%), by Import Market Analysis (Value & Volume) 2025 & 2033
- Figure 15: North America Feed Testing Market Revenue (Million), by Export Market Analysis (Value & Volume) 2025 & 2033
- Figure 16: North America Feed Testing Market Volume (Kiloton), by Export Market Analysis (Value & Volume) 2025 & 2033
- Figure 17: North America Feed Testing Market Revenue Share (%), by Export Market Analysis (Value & Volume) 2025 & 2033
- Figure 18: North America Feed Testing Market Volume Share (%), by Export Market Analysis (Value & Volume) 2025 & 2033
- Figure 19: North America Feed Testing Market Revenue (Million), by Price Trend Analysis 2025 & 2033
- Figure 20: North America Feed Testing Market Volume (Kiloton), by Price Trend Analysis 2025 & 2033
- Figure 21: North America Feed Testing Market Revenue Share (%), by Price Trend Analysis 2025 & 2033
- Figure 22: North America Feed Testing Market Volume Share (%), by Price Trend Analysis 2025 & 2033
- Figure 23: North America Feed Testing Market Revenue (Million), by Country 2025 & 2033
- Figure 24: North America Feed Testing Market Volume (Kiloton), by Country 2025 & 2033
- Figure 25: North America Feed Testing Market Revenue Share (%), by Country 2025 & 2033
- Figure 26: North America Feed Testing Market Volume Share (%), by Country 2025 & 2033
- Figure 27: South America Feed Testing Market Revenue (Million), by Production Analysis 2025 & 2033
- Figure 28: South America Feed Testing Market Volume (Kiloton), by Production Analysis 2025 & 2033
- Figure 29: South America Feed Testing Market Revenue Share (%), by Production Analysis 2025 & 2033
- Figure 30: South America Feed Testing Market Volume Share (%), by Production Analysis 2025 & 2033
- Figure 31: South America Feed Testing Market Revenue (Million), by Consumption Analysis 2025 & 2033
- Figure 32: South America Feed Testing Market Volume (Kiloton), by Consumption Analysis 2025 & 2033
- Figure 33: South America Feed Testing Market Revenue Share (%), by Consumption Analysis 2025 & 2033
- Figure 34: South America Feed Testing Market Volume Share (%), by Consumption Analysis 2025 & 2033
- Figure 35: South America Feed Testing Market Revenue (Million), by Import Market Analysis (Value & Volume) 2025 & 2033
- Figure 36: South America Feed Testing Market Volume (Kiloton), by Import Market Analysis (Value & Volume) 2025 & 2033
- Figure 37: South America Feed Testing Market Revenue Share (%), by Import Market Analysis (Value & Volume) 2025 & 2033
- Figure 38: South America Feed Testing Market Volume Share (%), by Import Market Analysis (Value & Volume) 2025 & 2033
- Figure 39: South America Feed Testing Market Revenue (Million), by Export Market Analysis (Value & Volume) 2025 & 2033
- Figure 40: South America Feed Testing Market Volume (Kiloton), by Export Market Analysis (Value & Volume) 2025 & 2033
- Figure 41: South America Feed Testing Market Revenue Share (%), by Export Market Analysis (Value & Volume) 2025 & 2033
- Figure 42: South America Feed Testing Market Volume Share (%), by Export Market Analysis (Value & Volume) 2025 & 2033
- Figure 43: South America Feed Testing Market Revenue (Million), by Price Trend Analysis 2025 & 2033
- Figure 44: South America Feed Testing Market Volume (Kiloton), by Price Trend Analysis 2025 & 2033
- Figure 45: South America Feed Testing Market Revenue Share (%), by Price Trend Analysis 2025 & 2033
- Figure 46: South America Feed Testing Market Volume Share (%), by Price Trend Analysis 2025 & 2033
- Figure 47: South America Feed Testing Market Revenue (Million), by Country 2025 & 2033
- Figure 48: South America Feed Testing Market Volume (Kiloton), by Country 2025 & 2033
- Figure 49: South America Feed Testing Market Revenue Share (%), by Country 2025 & 2033
- Figure 50: South America Feed Testing Market Volume Share (%), by Country 2025 & 2033
- Figure 51: Europe Feed Testing Market Revenue (Million), by Production Analysis 2025 & 2033
- Figure 52: Europe Feed Testing Market Volume (Kiloton), by Production Analysis 2025 & 2033
- Figure 53: Europe Feed Testing Market Revenue Share (%), by Production Analysis 2025 & 2033
- Figure 54: Europe Feed Testing Market Volume Share (%), by Production Analysis 2025 & 2033
- Figure 55: Europe Feed Testing Market Revenue (Million), by Consumption Analysis 2025 & 2033
- Figure 56: Europe Feed Testing Market Volume (Kiloton), by Consumption Analysis 2025 & 2033
- Figure 57: Europe Feed Testing Market Revenue Share (%), by Consumption Analysis 2025 & 2033
- Figure 58: Europe Feed Testing Market Volume Share (%), by Consumption Analysis 2025 & 2033
- Figure 59: Europe Feed Testing Market Revenue (Million), by Import Market Analysis (Value & Volume) 2025 & 2033
- Figure 60: Europe Feed Testing Market Volume (Kiloton), by Import Market Analysis (Value & Volume) 2025 & 2033
- Figure 61: Europe Feed Testing Market Revenue Share (%), by Import Market Analysis (Value & Volume) 2025 & 2033
- Figure 62: Europe Feed Testing Market Volume Share (%), by Import Market Analysis (Value & Volume) 2025 & 2033
- Figure 63: Europe Feed Testing Market Revenue (Million), by Export Market Analysis (Value & Volume) 2025 & 2033
- Figure 64: Europe Feed Testing Market Volume (Kiloton), by Export Market Analysis (Value & Volume) 2025 & 2033
- Figure 65: Europe Feed Testing Market Revenue Share (%), by Export Market Analysis (Value & Volume) 2025 & 2033
- Figure 66: Europe Feed Testing Market Volume Share (%), by Export Market Analysis (Value & Volume) 2025 & 2033
- Figure 67: Europe Feed Testing Market Revenue (Million), by Price Trend Analysis 2025 & 2033
- Figure 68: Europe Feed Testing Market Volume (Kiloton), by Price Trend Analysis 2025 & 2033
- Figure 69: Europe Feed Testing Market Revenue Share (%), by Price Trend Analysis 2025 & 2033
- Figure 70: Europe Feed Testing Market Volume Share (%), by Price Trend Analysis 2025 & 2033
- Figure 71: Europe Feed Testing Market Revenue (Million), by Country 2025 & 2033
- Figure 72: Europe Feed Testing Market Volume (Kiloton), by Country 2025 & 2033
- Figure 73: Europe Feed Testing Market Revenue Share (%), by Country 2025 & 2033
- Figure 74: Europe Feed Testing Market Volume Share (%), by Country 2025 & 2033
- Figure 75: Middle East & Africa Feed Testing Market Revenue (Million), by Production Analysis 2025 & 2033
- Figure 76: Middle East & Africa Feed Testing Market Volume (Kiloton), by Production Analysis 2025 & 2033
- Figure 77: Middle East & Africa Feed Testing Market Revenue Share (%), by Production Analysis 2025 & 2033
- Figure 78: Middle East & Africa Feed Testing Market Volume Share (%), by Production Analysis 2025 & 2033
- Figure 79: Middle East & Africa Feed Testing Market Revenue (Million), by Consumption Analysis 2025 & 2033
- Figure 80: Middle East & Africa Feed Testing Market Volume (Kiloton), by Consumption Analysis 2025 & 2033
- Figure 81: Middle East & Africa Feed Testing Market Revenue Share (%), by Consumption Analysis 2025 & 2033
- Figure 82: Middle East & Africa Feed Testing Market Volume Share (%), by Consumption Analysis 2025 & 2033
- Figure 83: Middle East & Africa Feed Testing Market Revenue (Million), by Import Market Analysis (Value & Volume) 2025 & 2033
- Figure 84: Middle East & Africa Feed Testing Market Volume (Kiloton), by Import Market Analysis (Value & Volume) 2025 & 2033
- Figure 85: Middle East & Africa Feed Testing Market Revenue Share (%), by Import Market Analysis (Value & Volume) 2025 & 2033
- Figure 86: Middle East & Africa Feed Testing Market Volume Share (%), by Import Market Analysis (Value & Volume) 2025 & 2033
- Figure 87: Middle East & Africa Feed Testing Market Revenue (Million), by Export Market Analysis (Value & Volume) 2025 & 2033
- Figure 88: Middle East & Africa Feed Testing Market Volume (Kiloton), by Export Market Analysis (Value & Volume) 2025 & 2033
- Figure 89: Middle East & Africa Feed Testing Market Revenue Share (%), by Export Market Analysis (Value & Volume) 2025 & 2033
- Figure 90: Middle East & Africa Feed Testing Market Volume Share (%), by Export Market Analysis (Value & Volume) 2025 & 2033
- Figure 91: Middle East & Africa Feed Testing Market Revenue (Million), by Price Trend Analysis 2025 & 2033
- Figure 92: Middle East & Africa Feed Testing Market Volume (Kiloton), by Price Trend Analysis 2025 & 2033
- Figure 93: Middle East & Africa Feed Testing Market Revenue Share (%), by Price Trend Analysis 2025 & 2033
- Figure 94: Middle East & Africa Feed Testing Market Volume Share (%), by Price Trend Analysis 2025 & 2033
- Figure 95: Middle East & Africa Feed Testing Market Revenue (Million), by Country 2025 & 2033
- Figure 96: Middle East & Africa Feed Testing Market Volume (Kiloton), by Country 2025 & 2033
- Figure 97: Middle East & Africa Feed Testing Market Revenue Share (%), by Country 2025 & 2033
- Figure 98: Middle East & Africa Feed Testing Market Volume Share (%), by Country 2025 & 2033
- Figure 99: Asia Pacific Feed Testing Market Revenue (Million), by Production Analysis 2025 & 2033
- Figure 100: Asia Pacific Feed Testing Market Volume (Kiloton), by Production Analysis 2025 & 2033
- Figure 101: Asia Pacific Feed Testing Market Revenue Share (%), by Production Analysis 2025 & 2033
- Figure 102: Asia Pacific Feed Testing Market Volume Share (%), by Production Analysis 2025 & 2033
- Figure 103: Asia Pacific Feed Testing Market Revenue (Million), by Consumption Analysis 2025 & 2033
- Figure 104: Asia Pacific Feed Testing Market Volume (Kiloton), by Consumption Analysis 2025 & 2033
- Figure 105: Asia Pacific Feed Testing Market Revenue Share (%), by Consumption Analysis 2025 & 2033
- Figure 106: Asia Pacific Feed Testing Market Volume Share (%), by Consumption Analysis 2025 & 2033
- Figure 107: Asia Pacific Feed Testing Market Revenue (Million), by Import Market Analysis (Value & Volume) 2025 & 2033
- Figure 108: Asia Pacific Feed Testing Market Volume (Kiloton), by Import Market Analysis (Value & Volume) 2025 & 2033
- Figure 109: Asia Pacific Feed Testing Market Revenue Share (%), by Import Market Analysis (Value & Volume) 2025 & 2033
- Figure 110: Asia Pacific Feed Testing Market Volume Share (%), by Import Market Analysis (Value & Volume) 2025 & 2033
- Figure 111: Asia Pacific Feed Testing Market Revenue (Million), by Export Market Analysis (Value & Volume) 2025 & 2033
- Figure 112: Asia Pacific Feed Testing Market Volume (Kiloton), by Export Market Analysis (Value & Volume) 2025 & 2033
- Figure 113: Asia Pacific Feed Testing Market Revenue Share (%), by Export Market Analysis (Value & Volume) 2025 & 2033
- Figure 114: Asia Pacific Feed Testing Market Volume Share (%), by Export Market Analysis (Value & Volume) 2025 & 2033
- Figure 115: Asia Pacific Feed Testing Market Revenue (Million), by Price Trend Analysis 2025 & 2033
- Figure 116: Asia Pacific Feed Testing Market Volume (Kiloton), by Price Trend Analysis 2025 & 2033
- Figure 117: Asia Pacific Feed Testing Market Revenue Share (%), by Price Trend Analysis 2025 & 2033
- Figure 118: Asia Pacific Feed Testing Market Volume Share (%), by Price Trend Analysis 2025 & 2033
- Figure 119: Asia Pacific Feed Testing Market Revenue (Million), by Country 2025 & 2033
- Figure 120: Asia Pacific Feed Testing Market Volume (Kiloton), by Country 2025 & 2033
- Figure 121: Asia Pacific Feed Testing Market Revenue Share (%), by Country 2025 & 2033
- Figure 122: Asia Pacific Feed Testing Market Volume Share (%), by Country 2025 & 2033
List of Tables
- Table 1: Global Feed Testing Market Revenue Million Forecast, by Production Analysis 2020 & 2033
- Table 2: Global Feed Testing Market Volume Kiloton Forecast, by Production Analysis 2020 & 2033
- Table 3: Global Feed Testing Market Revenue Million Forecast, by Consumption Analysis 2020 & 2033
- Table 4: Global Feed Testing Market Volume Kiloton Forecast, by Consumption Analysis 2020 & 2033
- Table 5: Global Feed Testing Market Revenue Million Forecast, by Import Market Analysis (Value & Volume) 2020 & 2033
- Table 6: Global Feed Testing Market Volume Kiloton Forecast, by Import Market Analysis (Value & Volume) 2020 & 2033
- Table 7: Global Feed Testing Market Revenue Million Forecast, by Export Market Analysis (Value & Volume) 2020 & 2033
- Table 8: Global Feed Testing Market Volume Kiloton Forecast, by Export Market Analysis (Value & Volume) 2020 & 2033
- Table 9: Global Feed Testing Market Revenue Million Forecast, by Price Trend Analysis 2020 & 2033
- Table 10: Global Feed Testing Market Volume Kiloton Forecast, by Price Trend Analysis 2020 & 2033
- Table 11: Global Feed Testing Market Revenue Million Forecast, by Region 2020 & 2033
- Table 12: Global Feed Testing Market Volume Kiloton Forecast, by Region 2020 & 2033
- Table 13: Global Feed Testing Market Revenue Million Forecast, by Production Analysis 2020 & 2033
- Table 14: Global Feed Testing Market Volume Kiloton Forecast, by Production Analysis 2020 & 2033
- Table 15: Global Feed Testing Market Revenue Million Forecast, by Consumption Analysis 2020 & 2033
- Table 16: Global Feed Testing Market Volume Kiloton Forecast, by Consumption Analysis 2020 & 2033
- Table 17: Global Feed Testing Market Revenue Million Forecast, by Import Market Analysis (Value & Volume) 2020 & 2033
- Table 18: Global Feed Testing Market Volume Kiloton Forecast, by Import Market Analysis (Value & Volume) 2020 & 2033
- Table 19: Global Feed Testing Market Revenue Million Forecast, by Export Market Analysis (Value & Volume) 2020 & 2033
- Table 20: Global Feed Testing Market Volume Kiloton Forecast, by Export Market Analysis (Value & Volume) 2020 & 2033
- Table 21: Global Feed Testing Market Revenue Million Forecast, by Price Trend Analysis 2020 & 2033
- Table 22: Global Feed Testing Market Volume Kiloton Forecast, by Price Trend Analysis 2020 & 2033
- Table 23: Global Feed Testing Market Revenue Million Forecast, by Country 2020 & 2033
- Table 24: Global Feed Testing Market Volume Kiloton Forecast, by Country 2020 & 2033
- Table 25: United States Feed Testing Market Revenue (Million) Forecast, by Application 2020 & 2033
- Table 26: United States Feed Testing Market Volume (Kiloton) Forecast, by Application 2020 & 2033
- Table 27: Canada Feed Testing Market Revenue (Million) Forecast, by Application 2020 & 2033
- Table 28: Canada Feed Testing Market Volume (Kiloton) Forecast, by Application 2020 & 2033
- Table 29: Mexico Feed Testing Market Revenue (Million) Forecast, by Application 2020 & 2033
- Table 30: Mexico Feed Testing Market Volume (Kiloton) Forecast, by Application 2020 & 2033
- Table 31: Global Feed Testing Market Revenue Million Forecast, by Production Analysis 2020 & 2033
- Table 32: Global Feed Testing Market Volume Kiloton Forecast, by Production Analysis 2020 & 2033
- Table 33: Global Feed Testing Market Revenue Million Forecast, by Consumption Analysis 2020 & 2033
- Table 34: Global Feed Testing Market Volume Kiloton Forecast, by Consumption Analysis 2020 & 2033
- Table 35: Global Feed Testing Market Revenue Million Forecast, by Import Market Analysis (Value & Volume) 2020 & 2033
- Table 36: Global Feed Testing Market Volume Kiloton Forecast, by Import Market Analysis (Value & Volume) 2020 & 2033
- Table 37: Global Feed Testing Market Revenue Million Forecast, by Export Market Analysis (Value & Volume) 2020 & 2033
- Table 38: Global Feed Testing Market Volume Kiloton Forecast, by Export Market Analysis (Value & Volume) 2020 & 2033
- Table 39: Global Feed Testing Market Revenue Million Forecast, by Price Trend Analysis 2020 & 2033
- Table 40: Global Feed Testing Market Volume Kiloton Forecast, by Price Trend Analysis 2020 & 2033
- Table 41: Global Feed Testing Market Revenue Million Forecast, by Country 2020 & 2033
- Table 42: Global Feed Testing Market Volume Kiloton Forecast, by Country 2020 & 2033
- Table 43: Brazil Feed Testing Market Revenue (Million) Forecast, by Application 2020 & 2033
- Table 44: Brazil Feed Testing Market Volume (Kiloton) Forecast, by Application 2020 & 2033
- Table 45: Argentina Feed Testing Market Revenue (Million) Forecast, by Application 2020 & 2033
- Table 46: Argentina Feed Testing Market Volume (Kiloton) Forecast, by Application 2020 & 2033
- Table 47: Rest of South America Feed Testing Market Revenue (Million) Forecast, by Application 2020 & 2033
- Table 48: Rest of South America Feed Testing Market Volume (Kiloton) Forecast, by Application 2020 & 2033
- Table 49: Global Feed Testing Market Revenue Million Forecast, by Production Analysis 2020 & 2033
- Table 50: Global Feed Testing Market Volume Kiloton Forecast, by Production Analysis 2020 & 2033
- Table 51: Global Feed Testing Market Revenue Million Forecast, by Consumption Analysis 2020 & 2033
- Table 52: Global Feed Testing Market Volume Kiloton Forecast, by Consumption Analysis 2020 & 2033
- Table 53: Global Feed Testing Market Revenue Million Forecast, by Import Market Analysis (Value & Volume) 2020 & 2033
- Table 54: Global Feed Testing Market Volume Kiloton Forecast, by Import Market Analysis (Value & Volume) 2020 & 2033
- Table 55: Global Feed Testing Market Revenue Million Forecast, by Export Market Analysis (Value & Volume) 2020 & 2033
- Table 56: Global Feed Testing Market Volume Kiloton Forecast, by Export Market Analysis (Value & Volume) 2020 & 2033
- Table 57: Global Feed Testing Market Revenue Million Forecast, by Price Trend Analysis 2020 & 2033
- Table 58: Global Feed Testing Market Volume Kiloton Forecast, by Price Trend Analysis 2020 & 2033
- Table 59: Global Feed Testing Market Revenue Million Forecast, by Country 2020 & 2033
- Table 60: Global Feed Testing Market Volume Kiloton Forecast, by Country 2020 & 2033
- Table 61: United Kingdom Feed Testing Market Revenue (Million) Forecast, by Application 2020 & 2033
- Table 62: United Kingdom Feed Testing Market Volume (Kiloton) Forecast, by Application 2020 & 2033
- Table 63: Germany Feed Testing Market Revenue (Million) Forecast, by Application 2020 & 2033
- Table 64: Germany Feed Testing Market Volume (Kiloton) Forecast, by Application 2020 & 2033
- Table 65: France Feed Testing Market Revenue (Million) Forecast, by Application 2020 & 2033
- Table 66: France Feed Testing Market Volume (Kiloton) Forecast, by Application 2020 & 2033
- Table 67: Italy Feed Testing Market Revenue (Million) Forecast, by Application 2020 & 2033
- Table 68: Italy Feed Testing Market Volume (Kiloton) Forecast, by Application 2020 & 2033
- Table 69: Spain Feed Testing Market Revenue (Million) Forecast, by Application 2020 & 2033
- Table 70: Spain Feed Testing Market Volume (Kiloton) Forecast, by Application 2020 & 2033
- Table 71: Russia Feed Testing Market Revenue (Million) Forecast, by Application 2020 & 2033
- Table 72: Russia Feed Testing Market Volume (Kiloton) Forecast, by Application 2020 & 2033
- Table 73: Benelux Feed Testing Market Revenue (Million) Forecast, by Application 2020 & 2033
- Table 74: Benelux Feed Testing Market Volume (Kiloton) Forecast, by Application 2020 & 2033
- Table 75: Nordics Feed Testing Market Revenue (Million) Forecast, by Application 2020 & 2033
- Table 76: Nordics Feed Testing Market Volume (Kiloton) Forecast, by Application 2020 & 2033
- Table 77: Rest of Europe Feed Testing Market Revenue (Million) Forecast, by Application 2020 & 2033
- Table 78: Rest of Europe Feed Testing Market Volume (Kiloton) Forecast, by Application 2020 & 2033
- Table 79: Global Feed Testing Market Revenue Million Forecast, by Production Analysis 2020 & 2033
- Table 80: Global Feed Testing Market Volume Kiloton Forecast, by Production Analysis 2020 & 2033
- Table 81: Global Feed Testing Market Revenue Million Forecast, by Consumption Analysis 2020 & 2033
- Table 82: Global Feed Testing Market Volume Kiloton Forecast, by Consumption Analysis 2020 & 2033
- Table 83: Global Feed Testing Market Revenue Million Forecast, by Import Market Analysis (Value & Volume) 2020 & 2033
- Table 84: Global Feed Testing Market Volume Kiloton Forecast, by Import Market Analysis (Value & Volume) 2020 & 2033
- Table 85: Global Feed Testing Market Revenue Million Forecast, by Export Market Analysis (Value & Volume) 2020 & 2033
- Table 86: Global Feed Testing Market Volume Kiloton Forecast, by Export Market Analysis (Value & Volume) 2020 & 2033
- Table 87: Global Feed Testing Market Revenue Million Forecast, by Price Trend Analysis 2020 & 2033
- Table 88: Global Feed Testing Market Volume Kiloton Forecast, by Price Trend Analysis 2020 & 2033
- Table 89: Global Feed Testing Market Revenue Million Forecast, by Country 2020 & 2033
- Table 90: Global Feed Testing Market Volume Kiloton Forecast, by Country 2020 & 2033
- Table 91: Turkey Feed Testing Market Revenue (Million) Forecast, by Application 2020 & 2033
- Table 92: Turkey Feed Testing Market Volume (Kiloton) Forecast, by Application 2020 & 2033
- Table 93: Israel Feed Testing Market Revenue (Million) Forecast, by Application 2020 & 2033
- Table 94: Israel Feed Testing Market Volume (Kiloton) Forecast, by Application 2020 & 2033
- Table 95: GCC Feed Testing Market Revenue (Million) Forecast, by Application 2020 & 2033
- Table 96: GCC Feed Testing Market Volume (Kiloton) Forecast, by Application 2020 & 2033
- Table 97: North Africa Feed Testing Market Revenue (Million) Forecast, by Application 2020 & 2033
- Table 98: North Africa Feed Testing Market Volume (Kiloton) Forecast, by Application 2020 & 2033
- Table 99: South Africa Feed Testing Market Revenue (Million) Forecast, by Application 2020 & 2033
- Table 100: South Africa Feed Testing Market Volume (Kiloton) Forecast, by Application 2020 & 2033
- Table 101: Rest of Middle East & Africa Feed Testing Market Revenue (Million) Forecast, by Application 2020 & 2033
- Table 102: Rest of Middle East & Africa Feed Testing Market Volume (Kiloton) Forecast, by Application 2020 & 2033
- Table 103: Global Feed Testing Market Revenue Million Forecast, by Production Analysis 2020 & 2033
- Table 104: Global Feed Testing Market Volume Kiloton Forecast, by Production Analysis 2020 & 2033
- Table 105: Global Feed Testing Market Revenue Million Forecast, by Consumption Analysis 2020 & 2033
- Table 106: Global Feed Testing Market Volume Kiloton Forecast, by Consumption Analysis 2020 & 2033
- Table 107: Global Feed Testing Market Revenue Million Forecast, by Import Market Analysis (Value & Volume) 2020 & 2033
- Table 108: Global Feed Testing Market Volume Kiloton Forecast, by Import Market Analysis (Value & Volume) 2020 & 2033
- Table 109: Global Feed Testing Market Revenue Million Forecast, by Export Market Analysis (Value & Volume) 2020 & 2033
- Table 110: Global Feed Testing Market Volume Kiloton Forecast, by Export Market Analysis (Value & Volume) 2020 & 2033
- Table 111: Global Feed Testing Market Revenue Million Forecast, by Price Trend Analysis 2020 & 2033
- Table 112: Global Feed Testing Market Volume Kiloton Forecast, by Price Trend Analysis 2020 & 2033
- Table 113: Global Feed Testing Market Revenue Million Forecast, by Country 2020 & 2033
- Table 114: Global Feed Testing Market Volume Kiloton Forecast, by Country 2020 & 2033
- Table 115: China Feed Testing Market Revenue (Million) Forecast, by Application 2020 & 2033
- Table 116: China Feed Testing Market Volume (Kiloton) Forecast, by Application 2020 & 2033
- Table 117: India Feed Testing Market Revenue (Million) Forecast, by Application 2020 & 2033
- Table 118: India Feed Testing Market Volume (Kiloton) Forecast, by Application 2020 & 2033
- Table 119: Japan Feed Testing Market Revenue (Million) Forecast, by Application 2020 & 2033
- Table 120: Japan Feed Testing Market Volume (Kiloton) Forecast, by Application 2020 & 2033
- Table 121: South Korea Feed Testing Market Revenue (Million) Forecast, by Application 2020 & 2033
- Table 122: South Korea Feed Testing Market Volume (Kiloton) Forecast, by Application 2020 & 2033
- Table 123: ASEAN Feed Testing Market Revenue (Million) Forecast, by Application 2020 & 2033
- Table 124: ASEAN Feed Testing Market Volume (Kiloton) Forecast, by Application 2020 & 2033
- Table 125: Oceania Feed Testing Market Revenue (Million) Forecast, by Application 2020 & 2033
- Table 126: Oceania Feed Testing Market Volume (Kiloton) Forecast, by Application 2020 & 2033
- Table 127: Rest of Asia Pacific Feed Testing Market Revenue (Million) Forecast, by Application 2020 & 2033
- Table 128: Rest of Asia Pacific Feed Testing Market Volume (Kiloton) Forecast, by Application 2020 & 2033
Frequently Asked Questions
1. What is the projected Compound Annual Growth Rate (CAGR) of the Feed Testing Market?
The projected CAGR is approximately 9.80%.
2. Which companies are prominent players in the Feed Testing Market?
Key companies in the market include SGS SA, R J Hill Laboratories Ltd, NSF International*List Not Exhaustive, Intertek Group PLC, Adpen Laboratories Inc, Bruker Biosciences Corporation, Genetic ID NA Inc, Genon Laboratories Ltd, Eurofins Scientific, Invisible Sentinel Inc.
3. What are the main segments of the Feed Testing Market?
The market segments include Production Analysis, Consumption Analysis, Import Market Analysis (Value & Volume), Export Market Analysis (Value & Volume), Price Trend Analysis.
4. Can you provide details about the market size?
The market size is estimated to be USD 2.54 Million as of 2022.
5. What are some drivers contributing to market growth?
Decreasing Per Capita Arable Land; Increased Demand for Food.
6. What are the notable trends driving market growth?
Increasing Government Regulations Driving Growth of Pet Food Testing Market.
7. Are there any restraints impacting market growth?
High Initial Investments; Requirement of Precision Agriculture.
8. Can you provide examples of recent developments in the market?
N/A
9. What pricing options are available for accessing the report?
Pricing options include single-user, multi-user, and enterprise licenses priced at USD 4750, USD 5250, and USD 8750 respectively.
10. Is the market size provided in terms of value or volume?
The market size is provided in terms of value, measured in Million and volume, measured in Kiloton.
11. Are there any specific market keywords associated with the report?
Yes, the market keyword associated with the report is "Feed Testing Market," which aids in identifying and referencing the specific market segment covered.
12. How do I determine which pricing option suits my needs best?
The pricing options vary based on user requirements and access needs. Individual users may opt for single-user licenses, while businesses requiring broader access may choose multi-user or enterprise licenses for cost-effective access to the report.
13. Are there any additional resources or data provided in the Feed Testing Market report?
While the report offers comprehensive insights, it's advisable to review the specific contents or supplementary materials provided to ascertain if additional resources or data are available.
14. How can I stay updated on further developments or reports in the Feed Testing Market?
To stay informed about further developments, trends, and reports in the Feed Testing Market, consider subscribing to industry newsletters, following relevant companies and organizations, or regularly checking reputable industry news sources and publications.
Methodology
Step 1 - Identification of Relevant Samples Size from Population Database


Step 2 - Approaches for Defining Global Market Size (Value, Volume* & Price*)

Note*: In applicable scenarios
Step 3 - Data Sources
Primary Research
- Web Analytics
- Survey Reports
- Research Institute
- Latest Research Reports
- Opinion Leaders
Secondary Research
- Annual Reports
- White Paper
- Latest Press Release
- Industry Association
- Paid Database
- Investor Presentations

Step 4 - Data Triangulation
Involves using different sources of information in order to increase the validity of a study
These sources are likely to be stakeholders in a program - participants, other researchers, program staff, other community members, and so on.
Then we put all data in single framework & apply various statistical tools to find out the dynamic on the market.
During the analysis stage, feedback from the stakeholder groups would be compared to determine areas of agreement as well as areas of divergence