

Key Insights
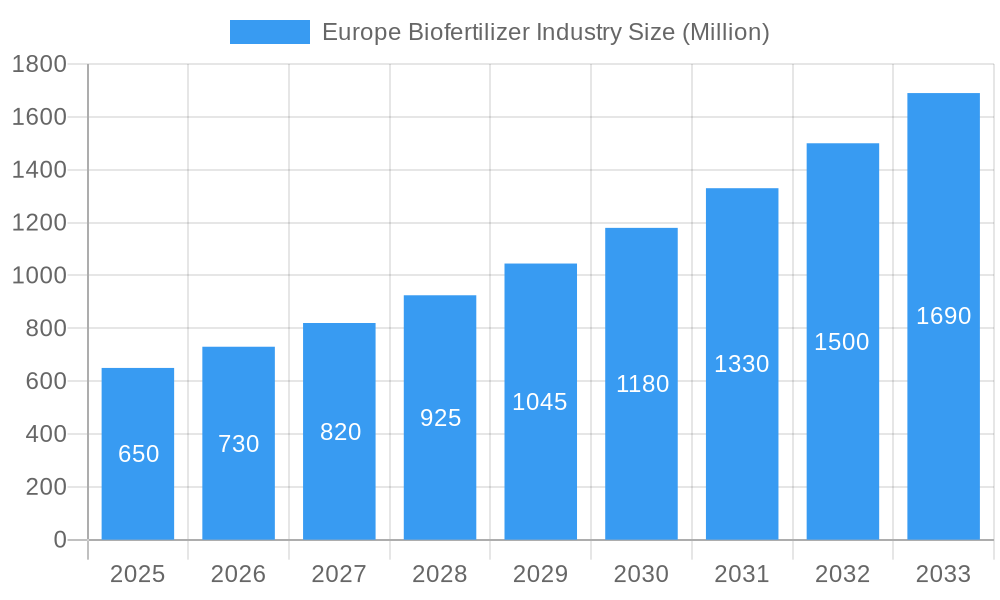
The European biofertilizer market, valued at €650 million in 2025, is projected to experience robust growth, with a Compound Annual Growth Rate (CAGR) of 12.10% from 2025 to 2033. This expansion is driven by several key factors. Increasing awareness of sustainable agriculture practices and the growing demand for environmentally friendly alternatives to chemical fertilizers are primary catalysts. Furthermore, stringent regulations aimed at reducing the environmental impact of conventional farming methods are compelling farmers to adopt biofertilizers. The rising incidence of soil degradation and the need to enhance crop yields in the face of climate change further fuel market growth. Specific application segments like soil and seed treatments are experiencing particularly strong growth, fueled by their effectiveness in improving nutrient uptake and promoting plant health. Within crop types, grains and cereals dominate the market due to their widespread cultivation across Europe. Technological advancements, such as the development of carrier-enriched biofertilizers and liquid biofertilizers, are enhancing product efficacy and ease of application, contributing to market expansion. Leading players like UAB Bioenergy, Symborg SL, and Biomax Naturals are driving innovation and market penetration through strategic partnerships and product diversification. Germany, France, and the UK represent the largest national markets within Europe, reflecting their significant agricultural sectors and proactive environmental policies.
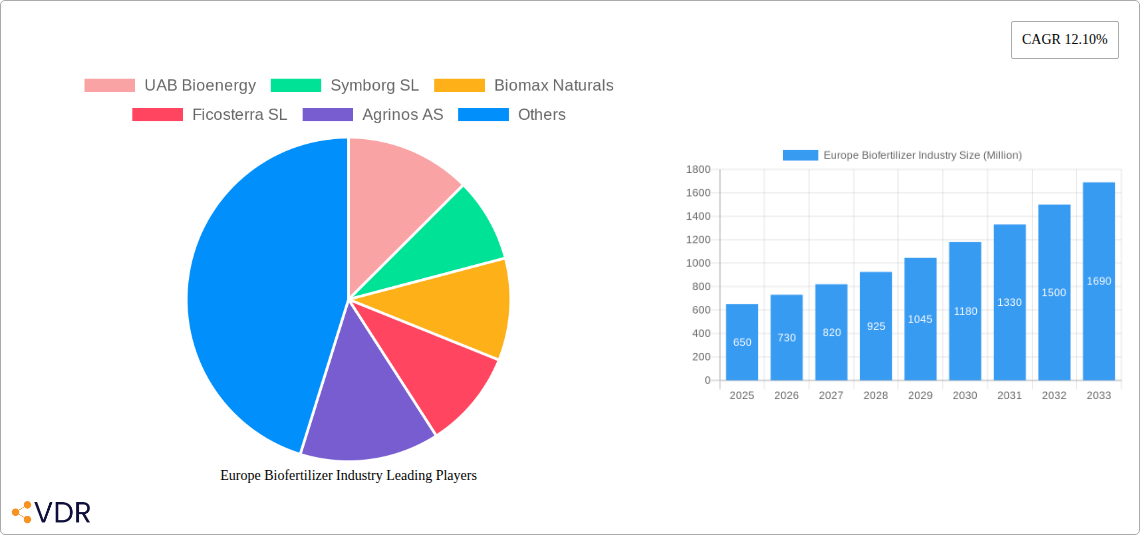
Europe Biofertilizer Industry Market Size (In Million)
The market segmentation reveals diverse opportunities. While Rhizobium and other nitrogen-fixing microorganisms are currently dominant, the increasing demand for phosphorus-efficient agriculture is boosting the market for Phosphate Solubilizing Bacteria and Mycorrhiza biofertilizers. Growth in the "other applications" segment suggests the potential for biofertilizers in non-agricultural sectors, such as horticulture and landscaping. Future growth will depend on continued research and development to enhance the efficacy and cost-effectiveness of biofertilizers, alongside supportive government policies and increased farmer awareness. Expansion into new crop types and geographical areas, particularly within Eastern European countries, presents significant untapped potential for market players. Addressing challenges such as inconsistent product quality and supply chain limitations will be crucial for realizing the full potential of the European biofertilizer market.
Europe Biofertilizer Industry Company Market Share
Europe Biofertilizer Industry: A Comprehensive Market Report (2019-2033)
This in-depth report provides a comprehensive analysis of the Europe biofertilizer industry, encompassing market dynamics, growth trends, dominant segments, and key players. The study period covers 2019-2033, with 2025 as the base year and a forecast period of 2025-2033. The report leverages extensive data analysis to offer valuable insights for industry professionals, investors, and stakeholders. The total market size in 2025 is estimated at xx Million.
Europe Biofertilizer Industry Market Dynamics & Structure
The European biofertilizer market is characterized by moderate concentration, with several key players competing alongside numerous smaller regional businesses. Technological innovation, driven by advancements in microorganism strains and delivery systems, is a key growth driver. Stringent environmental regulations within the EU are promoting the adoption of biofertilizers as a sustainable alternative to chemical fertilizers. However, the relatively high initial cost compared to chemical fertilizers, along with inconsistent product efficacy across varying soil and crop conditions, remain significant challenges. Furthermore, the market witnesses ongoing mergers and acquisitions (M&A) activity, reflecting industry consolidation and the pursuit of scale.
- Market Concentration: Moderately concentrated, with a top 5 market share of approximately xx%.
- Technological Innovation: Focus on enhanced efficacy, targeted delivery systems (e.g., carrier-enriched biofertilizers), and improved shelf life.
- Regulatory Framework: EU regulations promote sustainable agriculture, fostering biofertilizer adoption but also increasing compliance costs.
- Competitive Substitutes: Chemical fertilizers remain a significant substitute, presenting a challenge to biofertilizer market penetration.
- End-User Demographics: Primarily large-scale commercial farms, with increasing adoption among smaller, environmentally conscious farms.
- M&A Trends: xx M&A deals recorded between 2019 and 2024, indicating a trend toward consolidation.
Europe Biofertilizer Industry Growth Trends & Insights
The European biofertilizer market has experienced significant growth over the historical period (2019-2024), driven by increasing awareness of sustainable agriculture practices and growing concerns over the environmental impact of chemical fertilizers. The market is projected to witness continued expansion during the forecast period (2025-2033), fueled by favorable government policies and technological advancements. The CAGR for the period 2025-2033 is estimated to be xx%. Market penetration in key segments is expected to increase, particularly within specific crop types like grains and cereals. Technological disruptions, such as the development of next-generation biofertilizers with higher efficacy, are further accelerating growth. Shifting consumer preferences towards organically produced food are also contributing to market expansion. The adoption rate is projected to increase from xx% in 2025 to xx% by 2033.
Dominant Regions, Countries, or Segments in Europe Biofertilizer Industry
The Western European region, particularly countries like Germany, France, and the UK, currently dominates the market due to higher agricultural output, stronger regulatory frameworks promoting sustainable agriculture, and greater consumer awareness of environmentally friendly farming practices. Within application segments, Soil Treatment holds the largest market share, followed by Seed Treatment. Among crop types, Grains and Cereals represent the most significant consumer segment, due to their large-scale cultivation. Liquid Biofertilizers constitute the largest technology segment, owing to their ease of application and widespread acceptance. Rhizobium and Phosphate Solubilizing Bacteria are the leading microorganisms used in biofertilizers due to their well-established efficacy.
- Key Drivers: Stringent environmental regulations, growing consumer demand for organic produce, favorable government policies supporting sustainable agriculture, and technological advancements resulting in enhanced product efficacy.
- Dominance Factors: High agricultural output, substantial investments in agricultural research and development, and proactive government support for sustainable agriculture practices.
Europe Biofertilizer Industry Product Landscape
The European biofertilizer market showcases a diverse range of products catering to various crop types and applications. Product innovations focus on improving efficacy, shelf life, and ease of application. Carrier-enriched biofertilizers are gaining traction due to their improved handling and application, while liquid biofertilizers remain the dominant technology due to their convenience. Unique selling propositions often highlight specific microbial strains tailored for particular crops or soil conditions, promising enhanced nutrient uptake and yield improvement. Technological advancements include the development of novel formulations that enhance microbial survival and activity in challenging environmental conditions.
Key Drivers, Barriers & Challenges in Europe Biofertilizer Industry
Key Drivers: Increasing awareness of sustainable agriculture, stringent environmental regulations favoring biofertilizers, and rising consumer preference for organically grown food are major drivers. Government incentives and subsidies are also stimulating market growth. Technological advancements leading to improved product efficacy and cost reduction are further boosting adoption.
Key Challenges: High initial investment costs compared to chemical fertilizers, inconsistent product efficacy across diverse soil and climatic conditions, and a lack of awareness about the benefits of biofertilizers in some regions pose challenges. Supply chain constraints, regulatory hurdles in obtaining approvals for novel biofertilizers, and intense competition from established chemical fertilizer manufacturers also impede market expansion. The impact of these challenges on market growth is estimated at approximately xx% reduction in the overall market size.
Emerging Opportunities in Europe Biofertilizer Industry
Untapped market potential exists in Eastern European countries with growing agricultural sectors and increasing awareness of sustainable farming. Innovative applications, such as the development of biofertilizers tailored to specific crop varieties and precision agriculture techniques, offer significant growth prospects. The integration of biofertilizers with other sustainable agricultural practices, such as cover cropping and integrated pest management, presents further opportunities. Evolving consumer preferences towards sustainably produced food further fuel demand, pushing for innovative products with enhanced performance and traceability.
Growth Accelerators in the Europe Biofertilizer Industry
Technological breakthroughs in strain development, improved formulation techniques, and the integration of precision agriculture technologies are poised to significantly accelerate market growth. Strategic partnerships between biofertilizer manufacturers and agricultural input suppliers will expand market reach and distribution networks. Market expansion strategies targeting smaller-scale farms and niche agricultural segments offer significant untapped potential. Government support programs promoting sustainable agriculture and initiatives to reduce reliance on chemical fertilizers will further stimulate industry growth.
Key Players Shaping the Europe Biofertilizer Industry Market
- UAB Bioenergy
- Symborg SL
- Biomax Naturals
- Ficosterra SL
- Agrinos AS
- Rizobacter Argentina S
- Biocorrection AS
- ASB Greenworld
Notable Milestones in Europe Biofertilizer Industry Sector
- March 2021: Symborg Corporate SL opened a new manufacturing facility in Spain, boosting production capacity for sustainable agricultural products including biofertilizers.
- July 2021: Symborg Corporate SL signed a distribution agreement with Corteva Agrisciences, expanding market reach for its BlueN biofertilizer products across the European Union.
- June 2022: Novozymes A/S and AgroFresh formed a partnership to develop biological solutions for improved post-harvest food quality, indirectly impacting the biofertilizer market by strengthening the overall biological agriculture sector.
In-Depth Europe Biofertilizer Industry Market Outlook
The European biofertilizer market is poised for substantial growth in the coming years, driven by a convergence of technological advancements, supportive regulatory frameworks, and escalating consumer demand for sustainably produced food. Strategic partnerships, increased investment in research and development, and the expansion into new markets present significant opportunities for industry players. The market's long-term potential lies in its ability to provide environmentally friendly and economically viable solutions for enhancing agricultural productivity while mitigating the negative environmental impact of chemical fertilizers. The continued focus on sustainable agriculture and the growing need to improve food security further reinforce the long-term growth outlook for the European biofertilizer industry.
Europe Biofertilizer Industry Segmentation
- 1. Production Analysis
- 2. Consumption Analysis
- 3. Import Market Analysis (Value & Volume)
- 4. Export Market Analysis (Value & Volume)
- 5. Price Trend Analysis
Europe Biofertilizer Industry Segmentation By Geography
-
1. Europe
- 1.1. United Kingdom
- 1.2. Germany
- 1.3. France
- 1.4. Italy
- 1.5. Spain
- 1.6. Netherlands
- 1.7. Belgium
- 1.8. Sweden
- 1.9. Norway
- 1.10. Poland
- 1.11. Denmark
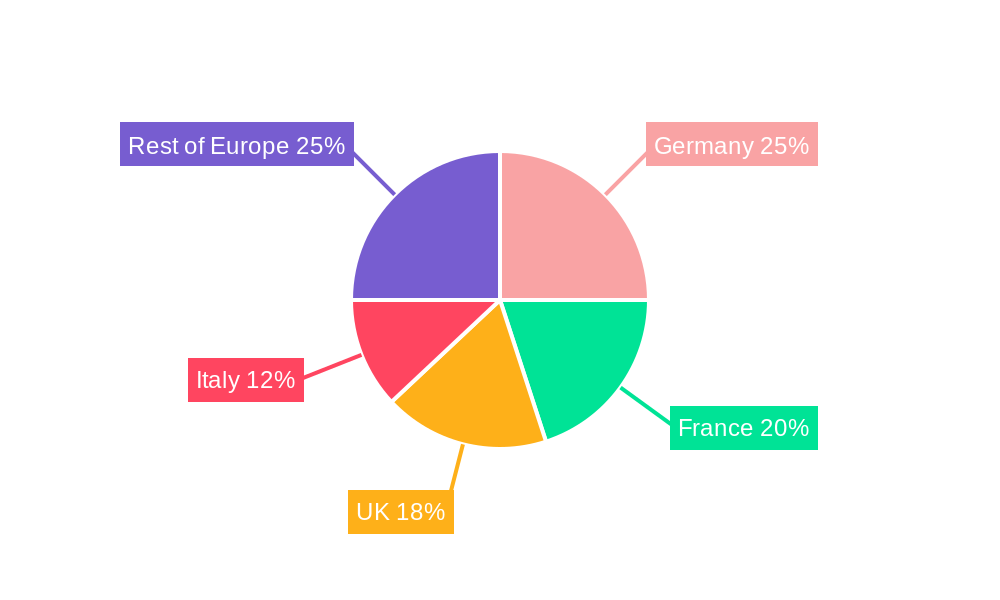
Europe Biofertilizer Industry Regional Market Share
Geographic Coverage of Europe Biofertilizer Industry
Europe Biofertilizer Industry REPORT HIGHLIGHTS
| Aspects | Details |
|---|---|
| Study Period | 2020-2034 |
| Base Year | 2025 |
| Estimated Year | 2026 |
| Forecast Period | 2026-2034 |
| Historical Period | 2020-2025 |
| Growth Rate | CAGR of 12.10% from 2020-2034 |
| Segmentation |
|
Table of Contents
- 1. Introduction
- 1.1. Research Scope
- 1.2. Market Segmentation
- 1.3. Research Objective
- 1.4. Definitions and Assumptions
- 2. Executive Summary
- 2.1. Market Snapshot
- 3. Market Dynamics
- 3.1. Market Drivers
- 3.2. Market Restrains
- 3.3. Market Trends
- 3.4. Market Opportunities
- 4. Market Factor Analysis
- 4.1. Porters Five Forces
- 4.1.1. Bargaining Power of Suppliers
- 4.1.2. Bargaining Power of Buyers
- 4.1.3. Threat of New Entrants
- 4.1.4. Threat of Substitutes
- 4.1.5. Competitive Rivalry
- 4.2. PESTEL analysis
- 4.3. BCG Analysis
- 4.3.1. Stars (High Growth, High Market Share)
- 4.3.2. Cash Cows (Low Growth, High Market Share)
- 4.3.3. Question Mark (High Growth, Low Market Share)
- 4.3.4. Dogs (Low Growth, Low Market Share)
- 4.4. Ansoff Matrix Analysis
- 4.5. Supply Chain Analysis
- 4.6. Regulatory Landscape
- 4.7. Current Market Potential and Opportunity Assessment (TAM–SAM–SOM Framework)
- 4.8. VDR Analyst Note
- 4.1. Porters Five Forces
- 5. Market Analysis, Insights and Forecast 2021-2033
- 5.1. Market Analysis, Insights and Forecast - by Production Analysis
- 5.2. Market Analysis, Insights and Forecast - by Consumption Analysis
- 5.3. Market Analysis, Insights and Forecast - by Import Market Analysis (Value & Volume)
- 5.4. Market Analysis, Insights and Forecast - by Export Market Analysis (Value & Volume)
- 5.5. Market Analysis, Insights and Forecast - by Price Trend Analysis
- 5.6. Market Analysis, Insights and Forecast - by Region
- 5.6.1. Europe
- 6. Europe Biofertilizer Industry Analysis, Insights and Forecast, 2021-2033
- 6.1. Market Analysis, Insights and Forecast - by Production Analysis
- 6.2. Market Analysis, Insights and Forecast - by Consumption Analysis
- 6.3. Market Analysis, Insights and Forecast - by Import Market Analysis (Value & Volume)
- 6.4. Market Analysis, Insights and Forecast - by Export Market Analysis (Value & Volume)
- 6.5. Market Analysis, Insights and Forecast - by Price Trend Analysis
- 7. Competitive Analysis
- 7.1. Company Profiles
- 7.1.1 UAB Bioenergy
- 7.1.1.1. Company Overview
- 7.1.1.2. Products
- 7.1.1.3. Company Financials
- 7.1.1.4. SWOT Analysis
- 7.1.2 Symborg SL
- 7.1.2.1. Company Overview
- 7.1.2.2. Products
- 7.1.2.3. Company Financials
- 7.1.2.4. SWOT Analysis
- 7.1.3 Biomax Naturals
- 7.1.3.1. Company Overview
- 7.1.3.2. Products
- 7.1.3.3. Company Financials
- 7.1.3.4. SWOT Analysis
- 7.1.4 Ficosterra SL
- 7.1.4.1. Company Overview
- 7.1.4.2. Products
- 7.1.4.3. Company Financials
- 7.1.4.4. SWOT Analysis
- 7.1.5 Agrinos AS
- 7.1.5.1. Company Overview
- 7.1.5.2. Products
- 7.1.5.3. Company Financials
- 7.1.5.4. SWOT Analysis
- 7.1.6 Rizobacter Argentina S
- 7.1.6.1. Company Overview
- 7.1.6.2. Products
- 7.1.6.3. Company Financials
- 7.1.6.4. SWOT Analysis
- 7.1.7 Biocorrection AS
- 7.1.7.1. Company Overview
- 7.1.7.2. Products
- 7.1.7.3. Company Financials
- 7.1.7.4. SWOT Analysis
- 7.1.8 ASB Greenworld
- 7.1.8.1. Company Overview
- 7.1.8.2. Products
- 7.1.8.3. Company Financials
- 7.1.8.4. SWOT Analysis
- 7.1.1 UAB Bioenergy
- 7.2. Market Entropy
- 7.2.1 Company's Key Areas Served
- 7.2.2 Recent Developments
- 7.3. Company Market Share Analysis 2025
- 7.3.1 Top 5 Companies Market Share Analysis
- 7.3.2 Top 3 Companies Market Share Analysis
- 7.4. List of Potential Customers
- 8. Research Methodology
List of Figures
- Figure 1: Europe Biofertilizer Industry Revenue Breakdown (Million, %) by Product 2025 & 2033
- Figure 2: Europe Biofertilizer Industry Share (%) by Company 2025
List of Tables
- Table 1: Europe Biofertilizer Industry Revenue Million Forecast, by Production Analysis 2020 & 2033
- Table 2: Europe Biofertilizer Industry Revenue Million Forecast, by Consumption Analysis 2020 & 2033
- Table 3: Europe Biofertilizer Industry Revenue Million Forecast, by Import Market Analysis (Value & Volume) 2020 & 2033
- Table 4: Europe Biofertilizer Industry Revenue Million Forecast, by Export Market Analysis (Value & Volume) 2020 & 2033
- Table 5: Europe Biofertilizer Industry Revenue Million Forecast, by Price Trend Analysis 2020 & 2033
- Table 6: Europe Biofertilizer Industry Revenue Million Forecast, by Region 2020 & 2033
- Table 7: Europe Biofertilizer Industry Revenue Million Forecast, by Production Analysis 2020 & 2033
- Table 8: Europe Biofertilizer Industry Revenue Million Forecast, by Consumption Analysis 2020 & 2033
- Table 9: Europe Biofertilizer Industry Revenue Million Forecast, by Import Market Analysis (Value & Volume) 2020 & 2033
- Table 10: Europe Biofertilizer Industry Revenue Million Forecast, by Export Market Analysis (Value & Volume) 2020 & 2033
- Table 11: Europe Biofertilizer Industry Revenue Million Forecast, by Price Trend Analysis 2020 & 2033
- Table 12: Europe Biofertilizer Industry Revenue Million Forecast, by Country 2020 & 2033
- Table 13: United Kingdom Europe Biofertilizer Industry Revenue (Million) Forecast, by Application 2020 & 2033
- Table 14: Germany Europe Biofertilizer Industry Revenue (Million) Forecast, by Application 2020 & 2033
- Table 15: France Europe Biofertilizer Industry Revenue (Million) Forecast, by Application 2020 & 2033
- Table 16: Italy Europe Biofertilizer Industry Revenue (Million) Forecast, by Application 2020 & 2033
- Table 17: Spain Europe Biofertilizer Industry Revenue (Million) Forecast, by Application 2020 & 2033
- Table 18: Netherlands Europe Biofertilizer Industry Revenue (Million) Forecast, by Application 2020 & 2033
- Table 19: Belgium Europe Biofertilizer Industry Revenue (Million) Forecast, by Application 2020 & 2033
- Table 20: Sweden Europe Biofertilizer Industry Revenue (Million) Forecast, by Application 2020 & 2033
- Table 21: Norway Europe Biofertilizer Industry Revenue (Million) Forecast, by Application 2020 & 2033
- Table 22: Poland Europe Biofertilizer Industry Revenue (Million) Forecast, by Application 2020 & 2033
- Table 23: Denmark Europe Biofertilizer Industry Revenue (Million) Forecast, by Application 2020 & 2033
Frequently Asked Questions
1. What is the projected Compound Annual Growth Rate (CAGR) of the Europe Biofertilizer Industry?
The projected CAGR is approximately 12.10%.
2. Which companies are prominent players in the Europe Biofertilizer Industry?
Key companies in the market include UAB Bioenergy, Symborg SL, Biomax Naturals, Ficosterra SL, Agrinos AS, Rizobacter Argentina S, Biocorrection AS, ASB Greenworld.
3. What are the main segments of the Europe Biofertilizer Industry?
The market segments include Production Analysis, Consumption Analysis, Import Market Analysis (Value & Volume), Export Market Analysis (Value & Volume), Price Trend Analysis.
4. Can you provide details about the market size?
The market size is estimated to be USD 0.65 Million as of 2022.
5. What are some drivers contributing to market growth?
Need for Custom Product Development; Use of CROs for Regulatory Services.
6. What are the notable trends driving market growth?
Adoption of Organic Farming Practice.
7. Are there any restraints impacting market growth?
Data and Cyber Security Concerns; Lack of Experts and Professionals in this Industry.
8. Can you provide examples of recent developments in the market?
June 2022: Novozymes A/S and AgroFresh form a partnership to develop biological solutions and improve post-harvest food quality.
9. What pricing options are available for accessing the report?
Pricing options include single-user, multi-user, and enterprise licenses priced at USD 4750, USD 5250, and USD 8750 respectively.
10. Is the market size provided in terms of value or volume?
The market size is provided in terms of value, measured in Million.
11. Are there any specific market keywords associated with the report?
Yes, the market keyword associated with the report is "Europe Biofertilizer Industry," which aids in identifying and referencing the specific market segment covered.
12. How do I determine which pricing option suits my needs best?
The pricing options vary based on user requirements and access needs. Individual users may opt for single-user licenses, while businesses requiring broader access may choose multi-user or enterprise licenses for cost-effective access to the report.
13. Are there any additional resources or data provided in the Europe Biofertilizer Industry report?
While the report offers comprehensive insights, it's advisable to review the specific contents or supplementary materials provided to ascertain if additional resources or data are available.
14. How can I stay updated on further developments or reports in the Europe Biofertilizer Industry?
To stay informed about further developments, trends, and reports in the Europe Biofertilizer Industry, consider subscribing to industry newsletters, following relevant companies and organizations, or regularly checking reputable industry news sources and publications.
Methodology
Step 1 - Identification of Relevant Samples Size from Population Database


Step 2 - Approaches for Defining Global Market Size (Value, Volume* & Price*)

Note*: In applicable scenarios
Step 3 - Data Sources
Primary Research
- Web Analytics
- Survey Reports
- Research Institute
- Latest Research Reports
- Opinion Leaders
Secondary Research
- Annual Reports
- White Paper
- Latest Press Release
- Industry Association
- Paid Database
- Investor Presentations

Step 4 - Data Triangulation
Involves using different sources of information in order to increase the validity of a study
These sources are likely to be stakeholders in a program - participants, other researchers, program staff, other community members, and so on.
Then we put all data in single framework & apply various statistical tools to find out the dynamic on the market.
During the analysis stage, feedback from the stakeholder groups would be compared to determine areas of agreement as well as areas of divergence