
Key Insights
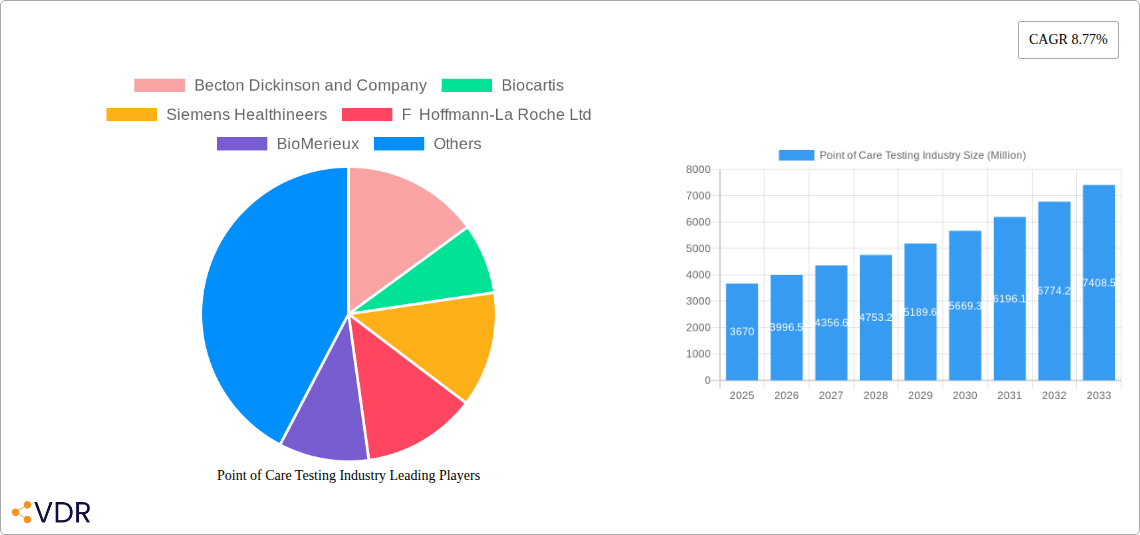
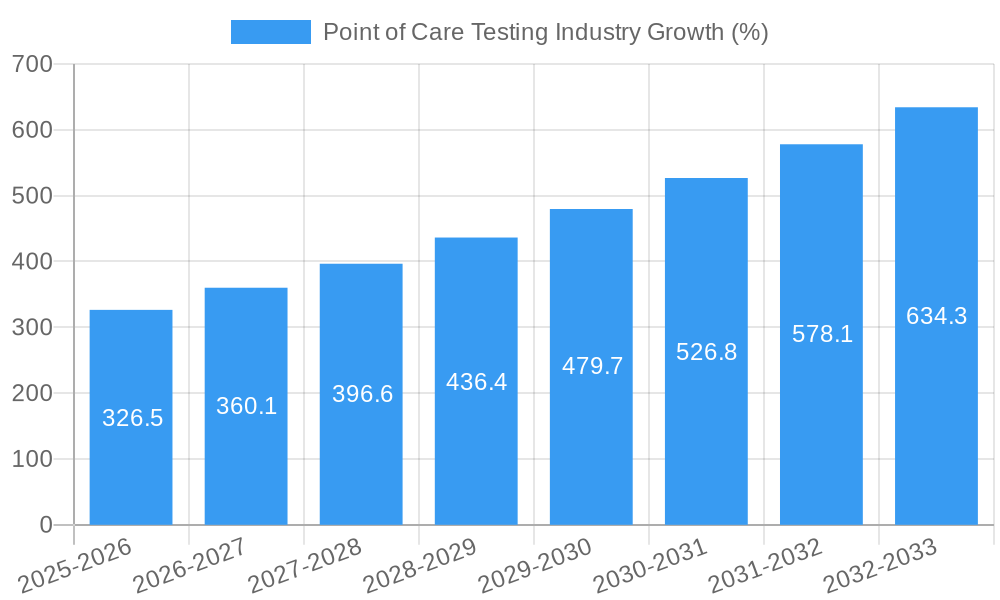
The Point-of-Care Testing (POCT) market, valued at $3.67 billion in 2025, is projected to experience robust growth, driven by several key factors. The increasing prevalence of chronic diseases like diabetes and cardiovascular conditions necessitates frequent and rapid testing, fueling demand for convenient POCT solutions. Technological advancements, particularly in areas like miniaturization, improved accuracy, and user-friendly interfaces, are further accelerating market expansion. The integration of POCT devices with electronic health records (EHRs) streamlines data management and improves patient care, enhancing their adoption in hospitals and clinics. Furthermore, the growing preference for decentralized healthcare settings, including homecare and telehealth, is significantly boosting the demand for portable and easy-to-use POCT devices. The expanding geriatric population also contributes to market growth, as older adults often require more frequent monitoring of health parameters.
While the market shows immense promise, several challenges remain. The high initial investment cost for advanced POCT technologies, particularly genetic sequencing and microarray-based assays, can hinder adoption in resource-constrained settings. Regulatory hurdles and stringent quality control measures associated with POCT device approvals can also slow down market penetration. Additionally, concerns regarding the accuracy and reliability of certain POCT assays, especially when compared to laboratory-based tests, continue to exist. However, ongoing innovation and improvements in accuracy, coupled with increasing awareness of the benefits of rapid testing, are likely to mitigate these challenges in the coming years. The market is segmented by technology (PCR, genetic sequencing, hybridization, microarray), end-user (hospitals, homecare, other), and application (infectious diseases, oncology, hematology, prenatal testing, endocrinology, others), offering diverse growth opportunities across segments. Considering the CAGR of 8.77%, the market is anticipated to reach significant heights by 2033.
Point of Care Testing (POCT) Industry Market Report: 2019-2033
This comprehensive report provides an in-depth analysis of the Point of Care Testing industry, encompassing market dynamics, growth trends, regional segmentation, product landscape, key players, and future outlook. The study period covers 2019-2033, with 2025 as the base year and forecast period extending to 2033. The report utilizes data from the historical period (2019-2024) and leverages extensive secondary research and expert interviews to provide insightful data. The total market size is projected to reach xx Million units by 2033.
Point of Care Testing Industry Market Dynamics & Structure
The Point of Care Testing (POCT) market is characterized by moderate concentration, with key players like Abbott Laboratories, Becton Dickinson and Company, and Roche holding significant market share. Technological innovation, particularly in PCR and molecular diagnostics, is a major driver, while regulatory approvals and reimbursement policies significantly impact market growth. The market witnesses continuous M&A activity, with larger players acquiring smaller innovative companies to expand their product portfolios. Competitive substitutes include traditional laboratory-based testing methods. End-user demographics are shifting towards decentralized testing environments, including homecare settings.
- Market Concentration: Moderately concentrated, with top 5 players holding approximately xx% market share in 2025.
- Technological Innovation: PCR remains dominant, but genetic sequencing and microarray technologies are rapidly gaining traction.
- Regulatory Frameworks: Stringent regulatory pathways influence market entry and product approvals.
- Competitive Substitutes: Traditional laboratory-based diagnostics pose a competitive challenge.
- M&A Activity: Significant M&A activity observed in recent years, xx deals recorded between 2019-2024.
- End-user demographics: Growth in homecare and decentralized testing settings.
Point of Care Testing Industry Growth Trends & Insights
The POCT market experienced robust growth during the historical period (2019-2024), driven by increasing prevalence of chronic diseases, rising demand for rapid diagnostics, and technological advancements enabling faster and more accurate testing. The COVID-19 pandemic significantly accelerated adoption rates, particularly for PCR-based tests. Market growth is expected to continue, albeit at a more moderate pace post-pandemic, driven by the increasing demand for convenient and accessible healthcare. The compound annual growth rate (CAGR) is estimated to be xx% during the forecast period (2025-2033), with market penetration expected to reach xx% by 2033. Technological disruptions, such as the development of miniaturized devices and AI-powered diagnostics, are shaping future market trends. Consumer behavior is shifting towards preference for user-friendly, rapid, and accurate tests.
Dominant Regions, Countries, or Segments in Point of Care Testing Industry
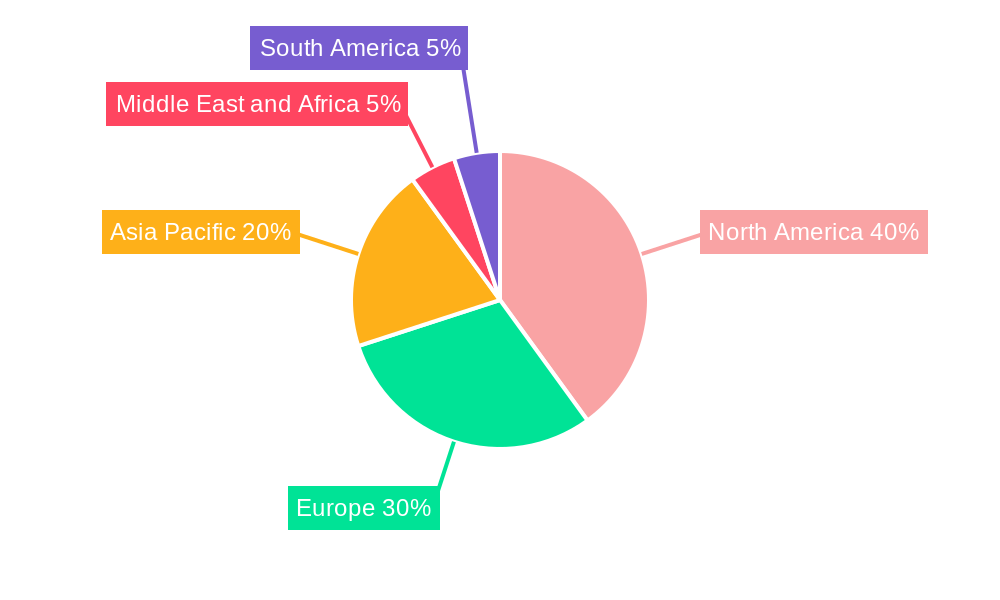
North America and Europe currently dominate the POCT market due to established healthcare infrastructure, high adoption rates of advanced technologies, and favorable regulatory environments. However, Asia-Pacific is witnessing significant growth, driven by increasing healthcare spending, rising prevalence of infectious diseases, and expanding diagnostic capabilities.
Dominant Segments:
- Technology: PCR remains the dominant technology, followed by immunoassays and other molecular diagnostic methods.
- End User: Hospitals constitute the largest segment, followed by clinics and other healthcare settings. Homecare is showing significant growth potential.
- Application: Infectious diseases continue to be a significant driver, followed by cardiology and oncology applications.
Key Drivers:
- North America: High healthcare expenditure, well-established healthcare infrastructure, favorable regulatory landscape.
- Europe: Strong focus on healthcare innovation, high adoption of advanced technologies.
- Asia-Pacific: Rapidly growing healthcare sector, increasing prevalence of infectious diseases, government initiatives promoting healthcare access.
Point of Care Testing Industry Product Landscape
The POCT market offers a diverse range of products, including rapid diagnostic tests, handheld devices, and automated analyzers. Innovations focus on improving accuracy, speed, and ease of use. Miniaturization, integration of multiple diagnostic capabilities into single platforms, and development of point-of-care molecular diagnostics are key technological advancements. Unique selling propositions often include portability, ease of use, and rapid turnaround time.
Key Drivers, Barriers & Challenges in Point of Care Testing Industry
Key Drivers:
- Rising prevalence of chronic diseases.
- Increasing demand for rapid and accurate diagnostics.
- Technological advancements leading to improved test performance and reduced costs.
- Growing adoption of telehealth and remote patient monitoring.
Challenges & Restraints:
- High initial investment costs for some technologies.
- Regulatory hurdles and approval processes.
- Ensuring quality control and standardization across different products and settings.
- Competition from established laboratory-based testing methods.
Emerging Opportunities in Point of Care Testing Industry
- Untapped markets: Expanding into developing countries with limited access to healthcare.
- Innovative applications: Development of POCT for personalized medicine and home-based testing for chronic diseases.
- Evolving consumer preferences: Demand for user-friendly and convenient testing solutions.
Growth Accelerators in the Point of Care Testing Industry
Technological breakthroughs in miniaturization and molecular diagnostics, strategic partnerships between diagnostics companies and healthcare providers, and expansion into new geographical markets are key catalysts for long-term growth in the POCT market.
Key Players Shaping the Point of Care Testing Industry Market
- Becton Dickinson and Company
- Biocartis
- Siemens Healthineers
- F Hoffmann-La Roche Ltd
- BioMerieux
- Abbott Laboratories
- Meridian Bioscience Inc
- Danaher Corporation
- OraSure Technologies Inc
- Thermo Fisher Scientific
- Agilent Technologies
- Co-Diagnostics Inc
Notable Milestones in Point of Care Testing Industry Sector
- February 2022: Sense Biodetection entered a strategic agreement with Una Health for the distribution of the Veros COVID-19 test in the UK.
- December 2021: FIND invested USD 21 million in Biomeme, Bioneer, Qlife, and SD Biosensor to accelerate the development of affordable point-of-care molecular diagnostic platforms.
In-Depth Point of Care Testing Industry Market Outlook
The POCT market is poised for continued growth, driven by technological advancements, increasing demand for accessible healthcare, and expanding applications. Strategic partnerships and investments in research and development will further shape the market landscape. Focus on developing user-friendly, cost-effective, and accurate diagnostics will be crucial for continued success in this rapidly evolving market.
Point of Care Testing Industry Segmentation
-
1. Application
- 1.1. Infectious Diseases
- 1.2. Oncology
- 1.3. Hematology
- 1.4. Prenatal Testing
- 1.5. Endocrinology
- 1.6. Other Applications
-
2. Technology
- 2.1. PCR
- 2.2. Genetic Sequencing
- 2.3. Hybridization
- 2.4. Microarray
-
3. End User
- 3.1. Hospitals
- 3.2. Homecare
- 3.3. Other End Users
Point of Care Testing Industry Segmentation By Geography
-
1. North America
- 1.1. United States
- 1.2. Canada
- 1.3. Mexico
-
2. Europe
- 2.1. Germany
- 2.2. United Kingdom
- 2.3. France
- 2.4. Italy
- 2.5. Spain
- 2.6. Rest of Europe
-
3. Asia Pacific
- 3.1. China
- 3.2. Japan
- 3.3. India
- 3.4. Australia
- 3.5. South Korea
- 3.6. Rest of Asia Pacific
-
4. Middle East and Africa
- 4.1. GCC
- 4.2. South Africa
- 4.3. Rest of Middle East and Africa
-
5. South America
- 5.1. Brazil
- 5.2. Argentina
- 5.3. Rest of South America
Point of Care Testing Industry REPORT HIGHLIGHTS
| Aspects | Details |
|---|---|
| Study Period | 2019-2033 |
| Base Year | 2024 |
| Estimated Year | 2025 |
| Forecast Period | 2025-2033 |
| Historical Period | 2019-2024 |
| Growth Rate | CAGR of 8.77% from 2019-2033 |
| Segmentation |
|
Table of Contents
- 1. Introduction
- 1.1. Research Scope
- 1.2. Market Segmentation
- 1.3. Research Methodology
- 1.4. Definitions and Assumptions
- 2. Executive Summary
- 2.1. Introduction
- 3. Market Dynamics
- 3.1. Introduction
- 3.2. Market Drivers
- 3.2.1. Increasing Prevalence of Infectious Diseases and Cancer; Rising Demand for Point-of-care Diagnostics; Recent Advancements in Technology and Pharmacogenomics
- 3.3. Market Restrains
- 3.3.1. Uncertain Reimbursement Scenario; Need for High-complexity Testing Centers
- 3.4. Market Trends
- 3.4.1. The Oncology Segment is Expected to Register a High CAGR During the Forecast Period
- 4. Market Factor Analysis
- 4.1. Porters Five Forces
- 4.2. Supply/Value Chain
- 4.3. PESTEL analysis
- 4.4. Market Entropy
- 4.5. Patent/Trademark Analysis
- 5. Global Point of Care Testing Industry Analysis, Insights and Forecast, 2019-2031
- 5.1. Market Analysis, Insights and Forecast - by Application
- 5.1.1. Infectious Diseases
- 5.1.2. Oncology
- 5.1.3. Hematology
- 5.1.4. Prenatal Testing
- 5.1.5. Endocrinology
- 5.1.6. Other Applications
- 5.2. Market Analysis, Insights and Forecast - by Technology
- 5.2.1. PCR
- 5.2.2. Genetic Sequencing
- 5.2.3. Hybridization
- 5.2.4. Microarray
- 5.3. Market Analysis, Insights and Forecast - by End User
- 5.3.1. Hospitals
- 5.3.2. Homecare
- 5.3.3. Other End Users
- 5.4. Market Analysis, Insights and Forecast - by Region
- 5.4.1. North America
- 5.4.2. Europe
- 5.4.3. Asia Pacific
- 5.4.4. Middle East and Africa
- 5.4.5. South America
- 5.1. Market Analysis, Insights and Forecast - by Application
- 6. North America Point of Care Testing Industry Analysis, Insights and Forecast, 2019-2031
- 6.1. Market Analysis, Insights and Forecast - by Application
- 6.1.1. Infectious Diseases
- 6.1.2. Oncology
- 6.1.3. Hematology
- 6.1.4. Prenatal Testing
- 6.1.5. Endocrinology
- 6.1.6. Other Applications
- 6.2. Market Analysis, Insights and Forecast - by Technology
- 6.2.1. PCR
- 6.2.2. Genetic Sequencing
- 6.2.3. Hybridization
- 6.2.4. Microarray
- 6.3. Market Analysis, Insights and Forecast - by End User
- 6.3.1. Hospitals
- 6.3.2. Homecare
- 6.3.3. Other End Users
- 6.1. Market Analysis, Insights and Forecast - by Application
- 7. Europe Point of Care Testing Industry Analysis, Insights and Forecast, 2019-2031
- 7.1. Market Analysis, Insights and Forecast - by Application
- 7.1.1. Infectious Diseases
- 7.1.2. Oncology
- 7.1.3. Hematology
- 7.1.4. Prenatal Testing
- 7.1.5. Endocrinology
- 7.1.6. Other Applications
- 7.2. Market Analysis, Insights and Forecast - by Technology
- 7.2.1. PCR
- 7.2.2. Genetic Sequencing
- 7.2.3. Hybridization
- 7.2.4. Microarray
- 7.3. Market Analysis, Insights and Forecast - by End User
- 7.3.1. Hospitals
- 7.3.2. Homecare
- 7.3.3. Other End Users
- 7.1. Market Analysis, Insights and Forecast - by Application
- 8. Asia Pacific Point of Care Testing Industry Analysis, Insights and Forecast, 2019-2031
- 8.1. Market Analysis, Insights and Forecast - by Application
- 8.1.1. Infectious Diseases
- 8.1.2. Oncology
- 8.1.3. Hematology
- 8.1.4. Prenatal Testing
- 8.1.5. Endocrinology
- 8.1.6. Other Applications
- 8.2. Market Analysis, Insights and Forecast - by Technology
- 8.2.1. PCR
- 8.2.2. Genetic Sequencing
- 8.2.3. Hybridization
- 8.2.4. Microarray
- 8.3. Market Analysis, Insights and Forecast - by End User
- 8.3.1. Hospitals
- 8.3.2. Homecare
- 8.3.3. Other End Users
- 8.1. Market Analysis, Insights and Forecast - by Application
- 9. Middle East and Africa Point of Care Testing Industry Analysis, Insights and Forecast, 2019-2031
- 9.1. Market Analysis, Insights and Forecast - by Application
- 9.1.1. Infectious Diseases
- 9.1.2. Oncology
- 9.1.3. Hematology
- 9.1.4. Prenatal Testing
- 9.1.5. Endocrinology
- 9.1.6. Other Applications
- 9.2. Market Analysis, Insights and Forecast - by Technology
- 9.2.1. PCR
- 9.2.2. Genetic Sequencing
- 9.2.3. Hybridization
- 9.2.4. Microarray
- 9.3. Market Analysis, Insights and Forecast - by End User
- 9.3.1. Hospitals
- 9.3.2. Homecare
- 9.3.3. Other End Users
- 9.1. Market Analysis, Insights and Forecast - by Application
- 10. South America Point of Care Testing Industry Analysis, Insights and Forecast, 2019-2031
- 10.1. Market Analysis, Insights and Forecast - by Application
- 10.1.1. Infectious Diseases
- 10.1.2. Oncology
- 10.1.3. Hematology
- 10.1.4. Prenatal Testing
- 10.1.5. Endocrinology
- 10.1.6. Other Applications
- 10.2. Market Analysis, Insights and Forecast - by Technology
- 10.2.1. PCR
- 10.2.2. Genetic Sequencing
- 10.2.3. Hybridization
- 10.2.4. Microarray
- 10.3. Market Analysis, Insights and Forecast - by End User
- 10.3.1. Hospitals
- 10.3.2. Homecare
- 10.3.3. Other End Users
- 10.1. Market Analysis, Insights and Forecast - by Application
- 11. North America Point of Care Testing Industry Analysis, Insights and Forecast, 2019-2031
- 11.1. Market Analysis, Insights and Forecast - By Country/Sub-region
- 11.1.1 United States
- 11.1.2 Canada
- 11.1.3 Mexico
- 12. Europe Point of Care Testing Industry Analysis, Insights and Forecast, 2019-2031
- 12.1. Market Analysis, Insights and Forecast - By Country/Sub-region
- 12.1.1 Germany
- 12.1.2 United Kingdom
- 12.1.3 France
- 12.1.4 Italy
- 12.1.5 Spain
- 12.1.6 Rest of Europe
- 13. Asia Pacific Point of Care Testing Industry Analysis, Insights and Forecast, 2019-2031
- 13.1. Market Analysis, Insights and Forecast - By Country/Sub-region
- 13.1.1 China
- 13.1.2 Japan
- 13.1.3 India
- 13.1.4 Australia
- 13.1.5 South Korea
- 13.1.6 Rest of Asia Pacific
- 14. Middle East and Africa Point of Care Testing Industry Analysis, Insights and Forecast, 2019-2031
- 14.1. Market Analysis, Insights and Forecast - By Country/Sub-region
- 14.1.1 GCC
- 14.1.2 South Africa
- 14.1.3 Rest of Middle East and Africa
- 15. South America Point of Care Testing Industry Analysis, Insights and Forecast, 2019-2031
- 15.1. Market Analysis, Insights and Forecast - By Country/Sub-region
- 15.1.1 Brazil
- 15.1.2 Argentina
- 15.1.3 Rest of South America
- 16. Competitive Analysis
- 16.1. Global Market Share Analysis 2024
- 16.2. Company Profiles
- 16.2.1 Becton Dickinson and Company
- 16.2.1.1. Overview
- 16.2.1.2. Products
- 16.2.1.3. SWOT Analysis
- 16.2.1.4. Recent Developments
- 16.2.1.5. Financials (Based on Availability)
- 16.2.2 Biocartis
- 16.2.2.1. Overview
- 16.2.2.2. Products
- 16.2.2.3. SWOT Analysis
- 16.2.2.4. Recent Developments
- 16.2.2.5. Financials (Based on Availability)
- 16.2.3 Siemens Healthineers
- 16.2.3.1. Overview
- 16.2.3.2. Products
- 16.2.3.3. SWOT Analysis
- 16.2.3.4. Recent Developments
- 16.2.3.5. Financials (Based on Availability)
- 16.2.4 F Hoffmann-La Roche Ltd
- 16.2.4.1. Overview
- 16.2.4.2. Products
- 16.2.4.3. SWOT Analysis
- 16.2.4.4. Recent Developments
- 16.2.4.5. Financials (Based on Availability)
- 16.2.5 BioMerieux
- 16.2.5.1. Overview
- 16.2.5.2. Products
- 16.2.5.3. SWOT Analysis
- 16.2.5.4. Recent Developments
- 16.2.5.5. Financials (Based on Availability)
- 16.2.6 Abbott Laboratories
- 16.2.6.1. Overview
- 16.2.6.2. Products
- 16.2.6.3. SWOT Analysis
- 16.2.6.4. Recent Developments
- 16.2.6.5. Financials (Based on Availability)
- 16.2.7 Meridian Bioscience Inc
- 16.2.7.1. Overview
- 16.2.7.2. Products
- 16.2.7.3. SWOT Analysis
- 16.2.7.4. Recent Developments
- 16.2.7.5. Financials (Based on Availability)
- 16.2.8 Danaher Corporation
- 16.2.8.1. Overview
- 16.2.8.2. Products
- 16.2.8.3. SWOT Analysis
- 16.2.8.4. Recent Developments
- 16.2.8.5. Financials (Based on Availability)
- 16.2.9 OraSure Technologies Inc
- 16.2.9.1. Overview
- 16.2.9.2. Products
- 16.2.9.3. SWOT Analysis
- 16.2.9.4. Recent Developments
- 16.2.9.5. Financials (Based on Availability)
- 16.2.10 Thermo Fisher Scientific
- 16.2.10.1. Overview
- 16.2.10.2. Products
- 16.2.10.3. SWOT Analysis
- 16.2.10.4. Recent Developments
- 16.2.10.5. Financials (Based on Availability)
- 16.2.11 Agilent Technologies
- 16.2.11.1. Overview
- 16.2.11.2. Products
- 16.2.11.3. SWOT Analysis
- 16.2.11.4. Recent Developments
- 16.2.11.5. Financials (Based on Availability)
- 16.2.12 Co-Diagnostics Inc
- 16.2.12.1. Overview
- 16.2.12.2. Products
- 16.2.12.3. SWOT Analysis
- 16.2.12.4. Recent Developments
- 16.2.12.5. Financials (Based on Availability)
- 16.2.1 Becton Dickinson and Company
List of Figures
- Figure 1: Global Point of Care Testing Industry Revenue Breakdown (Million, %) by Region 2024 & 2032
- Figure 2: Global Point of Care Testing Industry Volume Breakdown (K Unit, %) by Region 2024 & 2032
- Figure 3: North America Point of Care Testing Industry Revenue (Million), by Country 2024 & 2032
- Figure 4: North America Point of Care Testing Industry Volume (K Unit), by Country 2024 & 2032
- Figure 5: North America Point of Care Testing Industry Revenue Share (%), by Country 2024 & 2032
- Figure 6: North America Point of Care Testing Industry Volume Share (%), by Country 2024 & 2032
- Figure 7: Europe Point of Care Testing Industry Revenue (Million), by Country 2024 & 2032
- Figure 8: Europe Point of Care Testing Industry Volume (K Unit), by Country 2024 & 2032
- Figure 9: Europe Point of Care Testing Industry Revenue Share (%), by Country 2024 & 2032
- Figure 10: Europe Point of Care Testing Industry Volume Share (%), by Country 2024 & 2032
- Figure 11: Asia Pacific Point of Care Testing Industry Revenue (Million), by Country 2024 & 2032
- Figure 12: Asia Pacific Point of Care Testing Industry Volume (K Unit), by Country 2024 & 2032
- Figure 13: Asia Pacific Point of Care Testing Industry Revenue Share (%), by Country 2024 & 2032
- Figure 14: Asia Pacific Point of Care Testing Industry Volume Share (%), by Country 2024 & 2032
- Figure 15: Middle East and Africa Point of Care Testing Industry Revenue (Million), by Country 2024 & 2032
- Figure 16: Middle East and Africa Point of Care Testing Industry Volume (K Unit), by Country 2024 & 2032
- Figure 17: Middle East and Africa Point of Care Testing Industry Revenue Share (%), by Country 2024 & 2032
- Figure 18: Middle East and Africa Point of Care Testing Industry Volume Share (%), by Country 2024 & 2032
- Figure 19: South America Point of Care Testing Industry Revenue (Million), by Country 2024 & 2032
- Figure 20: South America Point of Care Testing Industry Volume (K Unit), by Country 2024 & 2032
- Figure 21: South America Point of Care Testing Industry Revenue Share (%), by Country 2024 & 2032
- Figure 22: South America Point of Care Testing Industry Volume Share (%), by Country 2024 & 2032
- Figure 23: North America Point of Care Testing Industry Revenue (Million), by Application 2024 & 2032
- Figure 24: North America Point of Care Testing Industry Volume (K Unit), by Application 2024 & 2032
- Figure 25: North America Point of Care Testing Industry Revenue Share (%), by Application 2024 & 2032
- Figure 26: North America Point of Care Testing Industry Volume Share (%), by Application 2024 & 2032
- Figure 27: North America Point of Care Testing Industry Revenue (Million), by Technology 2024 & 2032
- Figure 28: North America Point of Care Testing Industry Volume (K Unit), by Technology 2024 & 2032
- Figure 29: North America Point of Care Testing Industry Revenue Share (%), by Technology 2024 & 2032
- Figure 30: North America Point of Care Testing Industry Volume Share (%), by Technology 2024 & 2032
- Figure 31: North America Point of Care Testing Industry Revenue (Million), by End User 2024 & 2032
- Figure 32: North America Point of Care Testing Industry Volume (K Unit), by End User 2024 & 2032
- Figure 33: North America Point of Care Testing Industry Revenue Share (%), by End User 2024 & 2032
- Figure 34: North America Point of Care Testing Industry Volume Share (%), by End User 2024 & 2032
- Figure 35: North America Point of Care Testing Industry Revenue (Million), by Country 2024 & 2032
- Figure 36: North America Point of Care Testing Industry Volume (K Unit), by Country 2024 & 2032
- Figure 37: North America Point of Care Testing Industry Revenue Share (%), by Country 2024 & 2032
- Figure 38: North America Point of Care Testing Industry Volume Share (%), by Country 2024 & 2032
- Figure 39: Europe Point of Care Testing Industry Revenue (Million), by Application 2024 & 2032
- Figure 40: Europe Point of Care Testing Industry Volume (K Unit), by Application 2024 & 2032
- Figure 41: Europe Point of Care Testing Industry Revenue Share (%), by Application 2024 & 2032
- Figure 42: Europe Point of Care Testing Industry Volume Share (%), by Application 2024 & 2032
- Figure 43: Europe Point of Care Testing Industry Revenue (Million), by Technology 2024 & 2032
- Figure 44: Europe Point of Care Testing Industry Volume (K Unit), by Technology 2024 & 2032
- Figure 45: Europe Point of Care Testing Industry Revenue Share (%), by Technology 2024 & 2032
- Figure 46: Europe Point of Care Testing Industry Volume Share (%), by Technology 2024 & 2032
- Figure 47: Europe Point of Care Testing Industry Revenue (Million), by End User 2024 & 2032
- Figure 48: Europe Point of Care Testing Industry Volume (K Unit), by End User 2024 & 2032
- Figure 49: Europe Point of Care Testing Industry Revenue Share (%), by End User 2024 & 2032
- Figure 50: Europe Point of Care Testing Industry Volume Share (%), by End User 2024 & 2032
- Figure 51: Europe Point of Care Testing Industry Revenue (Million), by Country 2024 & 2032
- Figure 52: Europe Point of Care Testing Industry Volume (K Unit), by Country 2024 & 2032
- Figure 53: Europe Point of Care Testing Industry Revenue Share (%), by Country 2024 & 2032
- Figure 54: Europe Point of Care Testing Industry Volume Share (%), by Country 2024 & 2032
- Figure 55: Asia Pacific Point of Care Testing Industry Revenue (Million), by Application 2024 & 2032
- Figure 56: Asia Pacific Point of Care Testing Industry Volume (K Unit), by Application 2024 & 2032
- Figure 57: Asia Pacific Point of Care Testing Industry Revenue Share (%), by Application 2024 & 2032
- Figure 58: Asia Pacific Point of Care Testing Industry Volume Share (%), by Application 2024 & 2032
- Figure 59: Asia Pacific Point of Care Testing Industry Revenue (Million), by Technology 2024 & 2032
- Figure 60: Asia Pacific Point of Care Testing Industry Volume (K Unit), by Technology 2024 & 2032
- Figure 61: Asia Pacific Point of Care Testing Industry Revenue Share (%), by Technology 2024 & 2032
- Figure 62: Asia Pacific Point of Care Testing Industry Volume Share (%), by Technology 2024 & 2032
- Figure 63: Asia Pacific Point of Care Testing Industry Revenue (Million), by End User 2024 & 2032
- Figure 64: Asia Pacific Point of Care Testing Industry Volume (K Unit), by End User 2024 & 2032
- Figure 65: Asia Pacific Point of Care Testing Industry Revenue Share (%), by End User 2024 & 2032
- Figure 66: Asia Pacific Point of Care Testing Industry Volume Share (%), by End User 2024 & 2032
- Figure 67: Asia Pacific Point of Care Testing Industry Revenue (Million), by Country 2024 & 2032
- Figure 68: Asia Pacific Point of Care Testing Industry Volume (K Unit), by Country 2024 & 2032
- Figure 69: Asia Pacific Point of Care Testing Industry Revenue Share (%), by Country 2024 & 2032
- Figure 70: Asia Pacific Point of Care Testing Industry Volume Share (%), by Country 2024 & 2032
- Figure 71: Middle East and Africa Point of Care Testing Industry Revenue (Million), by Application 2024 & 2032
- Figure 72: Middle East and Africa Point of Care Testing Industry Volume (K Unit), by Application 2024 & 2032
- Figure 73: Middle East and Africa Point of Care Testing Industry Revenue Share (%), by Application 2024 & 2032
- Figure 74: Middle East and Africa Point of Care Testing Industry Volume Share (%), by Application 2024 & 2032
- Figure 75: Middle East and Africa Point of Care Testing Industry Revenue (Million), by Technology 2024 & 2032
- Figure 76: Middle East and Africa Point of Care Testing Industry Volume (K Unit), by Technology 2024 & 2032
- Figure 77: Middle East and Africa Point of Care Testing Industry Revenue Share (%), by Technology 2024 & 2032
- Figure 78: Middle East and Africa Point of Care Testing Industry Volume Share (%), by Technology 2024 & 2032
- Figure 79: Middle East and Africa Point of Care Testing Industry Revenue (Million), by End User 2024 & 2032
- Figure 80: Middle East and Africa Point of Care Testing Industry Volume (K Unit), by End User 2024 & 2032
- Figure 81: Middle East and Africa Point of Care Testing Industry Revenue Share (%), by End User 2024 & 2032
- Figure 82: Middle East and Africa Point of Care Testing Industry Volume Share (%), by End User 2024 & 2032
- Figure 83: Middle East and Africa Point of Care Testing Industry Revenue (Million), by Country 2024 & 2032
- Figure 84: Middle East and Africa Point of Care Testing Industry Volume (K Unit), by Country 2024 & 2032
- Figure 85: Middle East and Africa Point of Care Testing Industry Revenue Share (%), by Country 2024 & 2032
- Figure 86: Middle East and Africa Point of Care Testing Industry Volume Share (%), by Country 2024 & 2032
- Figure 87: South America Point of Care Testing Industry Revenue (Million), by Application 2024 & 2032
- Figure 88: South America Point of Care Testing Industry Volume (K Unit), by Application 2024 & 2032
- Figure 89: South America Point of Care Testing Industry Revenue Share (%), by Application 2024 & 2032
- Figure 90: South America Point of Care Testing Industry Volume Share (%), by Application 2024 & 2032
- Figure 91: South America Point of Care Testing Industry Revenue (Million), by Technology 2024 & 2032
- Figure 92: South America Point of Care Testing Industry Volume (K Unit), by Technology 2024 & 2032
- Figure 93: South America Point of Care Testing Industry Revenue Share (%), by Technology 2024 & 2032
- Figure 94: South America Point of Care Testing Industry Volume Share (%), by Technology 2024 & 2032
- Figure 95: South America Point of Care Testing Industry Revenue (Million), by End User 2024 & 2032
- Figure 96: South America Point of Care Testing Industry Volume (K Unit), by End User 2024 & 2032
- Figure 97: South America Point of Care Testing Industry Revenue Share (%), by End User 2024 & 2032
- Figure 98: South America Point of Care Testing Industry Volume Share (%), by End User 2024 & 2032
- Figure 99: South America Point of Care Testing Industry Revenue (Million), by Country 2024 & 2032
- Figure 100: South America Point of Care Testing Industry Volume (K Unit), by Country 2024 & 2032
- Figure 101: South America Point of Care Testing Industry Revenue Share (%), by Country 2024 & 2032
- Figure 102: South America Point of Care Testing Industry Volume Share (%), by Country 2024 & 2032
List of Tables
- Table 1: Global Point of Care Testing Industry Revenue Million Forecast, by Region 2019 & 2032
- Table 2: Global Point of Care Testing Industry Volume K Unit Forecast, by Region 2019 & 2032
- Table 3: Global Point of Care Testing Industry Revenue Million Forecast, by Application 2019 & 2032
- Table 4: Global Point of Care Testing Industry Volume K Unit Forecast, by Application 2019 & 2032
- Table 5: Global Point of Care Testing Industry Revenue Million Forecast, by Technology 2019 & 2032
- Table 6: Global Point of Care Testing Industry Volume K Unit Forecast, by Technology 2019 & 2032
- Table 7: Global Point of Care Testing Industry Revenue Million Forecast, by End User 2019 & 2032
- Table 8: Global Point of Care Testing Industry Volume K Unit Forecast, by End User 2019 & 2032
- Table 9: Global Point of Care Testing Industry Revenue Million Forecast, by Region 2019 & 2032
- Table 10: Global Point of Care Testing Industry Volume K Unit Forecast, by Region 2019 & 2032
- Table 11: Global Point of Care Testing Industry Revenue Million Forecast, by Country 2019 & 2032
- Table 12: Global Point of Care Testing Industry Volume K Unit Forecast, by Country 2019 & 2032
- Table 13: United States Point of Care Testing Industry Revenue (Million) Forecast, by Application 2019 & 2032
- Table 14: United States Point of Care Testing Industry Volume (K Unit) Forecast, by Application 2019 & 2032
- Table 15: Canada Point of Care Testing Industry Revenue (Million) Forecast, by Application 2019 & 2032
- Table 16: Canada Point of Care Testing Industry Volume (K Unit) Forecast, by Application 2019 & 2032
- Table 17: Mexico Point of Care Testing Industry Revenue (Million) Forecast, by Application 2019 & 2032
- Table 18: Mexico Point of Care Testing Industry Volume (K Unit) Forecast, by Application 2019 & 2032
- Table 19: Global Point of Care Testing Industry Revenue Million Forecast, by Country 2019 & 2032
- Table 20: Global Point of Care Testing Industry Volume K Unit Forecast, by Country 2019 & 2032
- Table 21: Germany Point of Care Testing Industry Revenue (Million) Forecast, by Application 2019 & 2032
- Table 22: Germany Point of Care Testing Industry Volume (K Unit) Forecast, by Application 2019 & 2032
- Table 23: United Kingdom Point of Care Testing Industry Revenue (Million) Forecast, by Application 2019 & 2032
- Table 24: United Kingdom Point of Care Testing Industry Volume (K Unit) Forecast, by Application 2019 & 2032
- Table 25: France Point of Care Testing Industry Revenue (Million) Forecast, by Application 2019 & 2032
- Table 26: France Point of Care Testing Industry Volume (K Unit) Forecast, by Application 2019 & 2032
- Table 27: Italy Point of Care Testing Industry Revenue (Million) Forecast, by Application 2019 & 2032
- Table 28: Italy Point of Care Testing Industry Volume (K Unit) Forecast, by Application 2019 & 2032
- Table 29: Spain Point of Care Testing Industry Revenue (Million) Forecast, by Application 2019 & 2032
- Table 30: Spain Point of Care Testing Industry Volume (K Unit) Forecast, by Application 2019 & 2032
- Table 31: Rest of Europe Point of Care Testing Industry Revenue (Million) Forecast, by Application 2019 & 2032
- Table 32: Rest of Europe Point of Care Testing Industry Volume (K Unit) Forecast, by Application 2019 & 2032
- Table 33: Global Point of Care Testing Industry Revenue Million Forecast, by Country 2019 & 2032
- Table 34: Global Point of Care Testing Industry Volume K Unit Forecast, by Country 2019 & 2032
- Table 35: China Point of Care Testing Industry Revenue (Million) Forecast, by Application 2019 & 2032
- Table 36: China Point of Care Testing Industry Volume (K Unit) Forecast, by Application 2019 & 2032
- Table 37: Japan Point of Care Testing Industry Revenue (Million) Forecast, by Application 2019 & 2032
- Table 38: Japan Point of Care Testing Industry Volume (K Unit) Forecast, by Application 2019 & 2032
- Table 39: India Point of Care Testing Industry Revenue (Million) Forecast, by Application 2019 & 2032
- Table 40: India Point of Care Testing Industry Volume (K Unit) Forecast, by Application 2019 & 2032
- Table 41: Australia Point of Care Testing Industry Revenue (Million) Forecast, by Application 2019 & 2032
- Table 42: Australia Point of Care Testing Industry Volume (K Unit) Forecast, by Application 2019 & 2032
- Table 43: South Korea Point of Care Testing Industry Revenue (Million) Forecast, by Application 2019 & 2032
- Table 44: South Korea Point of Care Testing Industry Volume (K Unit) Forecast, by Application 2019 & 2032
- Table 45: Rest of Asia Pacific Point of Care Testing Industry Revenue (Million) Forecast, by Application 2019 & 2032
- Table 46: Rest of Asia Pacific Point of Care Testing Industry Volume (K Unit) Forecast, by Application 2019 & 2032
- Table 47: Global Point of Care Testing Industry Revenue Million Forecast, by Country 2019 & 2032
- Table 48: Global Point of Care Testing Industry Volume K Unit Forecast, by Country 2019 & 2032
- Table 49: GCC Point of Care Testing Industry Revenue (Million) Forecast, by Application 2019 & 2032
- Table 50: GCC Point of Care Testing Industry Volume (K Unit) Forecast, by Application 2019 & 2032
- Table 51: South Africa Point of Care Testing Industry Revenue (Million) Forecast, by Application 2019 & 2032
- Table 52: South Africa Point of Care Testing Industry Volume (K Unit) Forecast, by Application 2019 & 2032
- Table 53: Rest of Middle East and Africa Point of Care Testing Industry Revenue (Million) Forecast, by Application 2019 & 2032
- Table 54: Rest of Middle East and Africa Point of Care Testing Industry Volume (K Unit) Forecast, by Application 2019 & 2032
- Table 55: Global Point of Care Testing Industry Revenue Million Forecast, by Country 2019 & 2032
- Table 56: Global Point of Care Testing Industry Volume K Unit Forecast, by Country 2019 & 2032
- Table 57: Brazil Point of Care Testing Industry Revenue (Million) Forecast, by Application 2019 & 2032
- Table 58: Brazil Point of Care Testing Industry Volume (K Unit) Forecast, by Application 2019 & 2032
- Table 59: Argentina Point of Care Testing Industry Revenue (Million) Forecast, by Application 2019 & 2032
- Table 60: Argentina Point of Care Testing Industry Volume (K Unit) Forecast, by Application 2019 & 2032
- Table 61: Rest of South America Point of Care Testing Industry Revenue (Million) Forecast, by Application 2019 & 2032
- Table 62: Rest of South America Point of Care Testing Industry Volume (K Unit) Forecast, by Application 2019 & 2032
- Table 63: Global Point of Care Testing Industry Revenue Million Forecast, by Application 2019 & 2032
- Table 64: Global Point of Care Testing Industry Volume K Unit Forecast, by Application 2019 & 2032
- Table 65: Global Point of Care Testing Industry Revenue Million Forecast, by Technology 2019 & 2032
- Table 66: Global Point of Care Testing Industry Volume K Unit Forecast, by Technology 2019 & 2032
- Table 67: Global Point of Care Testing Industry Revenue Million Forecast, by End User 2019 & 2032
- Table 68: Global Point of Care Testing Industry Volume K Unit Forecast, by End User 2019 & 2032
- Table 69: Global Point of Care Testing Industry Revenue Million Forecast, by Country 2019 & 2032
- Table 70: Global Point of Care Testing Industry Volume K Unit Forecast, by Country 2019 & 2032
- Table 71: United States Point of Care Testing Industry Revenue (Million) Forecast, by Application 2019 & 2032
- Table 72: United States Point of Care Testing Industry Volume (K Unit) Forecast, by Application 2019 & 2032
- Table 73: Canada Point of Care Testing Industry Revenue (Million) Forecast, by Application 2019 & 2032
- Table 74: Canada Point of Care Testing Industry Volume (K Unit) Forecast, by Application 2019 & 2032
- Table 75: Mexico Point of Care Testing Industry Revenue (Million) Forecast, by Application 2019 & 2032
- Table 76: Mexico Point of Care Testing Industry Volume (K Unit) Forecast, by Application 2019 & 2032
- Table 77: Global Point of Care Testing Industry Revenue Million Forecast, by Application 2019 & 2032
- Table 78: Global Point of Care Testing Industry Volume K Unit Forecast, by Application 2019 & 2032
- Table 79: Global Point of Care Testing Industry Revenue Million Forecast, by Technology 2019 & 2032
- Table 80: Global Point of Care Testing Industry Volume K Unit Forecast, by Technology 2019 & 2032
- Table 81: Global Point of Care Testing Industry Revenue Million Forecast, by End User 2019 & 2032
- Table 82: Global Point of Care Testing Industry Volume K Unit Forecast, by End User 2019 & 2032
- Table 83: Global Point of Care Testing Industry Revenue Million Forecast, by Country 2019 & 2032
- Table 84: Global Point of Care Testing Industry Volume K Unit Forecast, by Country 2019 & 2032
- Table 85: Germany Point of Care Testing Industry Revenue (Million) Forecast, by Application 2019 & 2032
- Table 86: Germany Point of Care Testing Industry Volume (K Unit) Forecast, by Application 2019 & 2032
- Table 87: United Kingdom Point of Care Testing Industry Revenue (Million) Forecast, by Application 2019 & 2032
- Table 88: United Kingdom Point of Care Testing Industry Volume (K Unit) Forecast, by Application 2019 & 2032
- Table 89: France Point of Care Testing Industry Revenue (Million) Forecast, by Application 2019 & 2032
- Table 90: France Point of Care Testing Industry Volume (K Unit) Forecast, by Application 2019 & 2032
- Table 91: Italy Point of Care Testing Industry Revenue (Million) Forecast, by Application 2019 & 2032
- Table 92: Italy Point of Care Testing Industry Volume (K Unit) Forecast, by Application 2019 & 2032
- Table 93: Spain Point of Care Testing Industry Revenue (Million) Forecast, by Application 2019 & 2032
- Table 94: Spain Point of Care Testing Industry Volume (K Unit) Forecast, by Application 2019 & 2032
- Table 95: Rest of Europe Point of Care Testing Industry Revenue (Million) Forecast, by Application 2019 & 2032
- Table 96: Rest of Europe Point of Care Testing Industry Volume (K Unit) Forecast, by Application 2019 & 2032
- Table 97: Global Point of Care Testing Industry Revenue Million Forecast, by Application 2019 & 2032
- Table 98: Global Point of Care Testing Industry Volume K Unit Forecast, by Application 2019 & 2032
- Table 99: Global Point of Care Testing Industry Revenue Million Forecast, by Technology 2019 & 2032
- Table 100: Global Point of Care Testing Industry Volume K Unit Forecast, by Technology 2019 & 2032
- Table 101: Global Point of Care Testing Industry Revenue Million Forecast, by End User 2019 & 2032
- Table 102: Global Point of Care Testing Industry Volume K Unit Forecast, by End User 2019 & 2032
- Table 103: Global Point of Care Testing Industry Revenue Million Forecast, by Country 2019 & 2032
- Table 104: Global Point of Care Testing Industry Volume K Unit Forecast, by Country 2019 & 2032
- Table 105: China Point of Care Testing Industry Revenue (Million) Forecast, by Application 2019 & 2032
- Table 106: China Point of Care Testing Industry Volume (K Unit) Forecast, by Application 2019 & 2032
- Table 107: Japan Point of Care Testing Industry Revenue (Million) Forecast, by Application 2019 & 2032
- Table 108: Japan Point of Care Testing Industry Volume (K Unit) Forecast, by Application 2019 & 2032
- Table 109: India Point of Care Testing Industry Revenue (Million) Forecast, by Application 2019 & 2032
- Table 110: India Point of Care Testing Industry Volume (K Unit) Forecast, by Application 2019 & 2032
- Table 111: Australia Point of Care Testing Industry Revenue (Million) Forecast, by Application 2019 & 2032
- Table 112: Australia Point of Care Testing Industry Volume (K Unit) Forecast, by Application 2019 & 2032
- Table 113: South Korea Point of Care Testing Industry Revenue (Million) Forecast, by Application 2019 & 2032
- Table 114: South Korea Point of Care Testing Industry Volume (K Unit) Forecast, by Application 2019 & 2032
- Table 115: Rest of Asia Pacific Point of Care Testing Industry Revenue (Million) Forecast, by Application 2019 & 2032
- Table 116: Rest of Asia Pacific Point of Care Testing Industry Volume (K Unit) Forecast, by Application 2019 & 2032
- Table 117: Global Point of Care Testing Industry Revenue Million Forecast, by Application 2019 & 2032
- Table 118: Global Point of Care Testing Industry Volume K Unit Forecast, by Application 2019 & 2032
- Table 119: Global Point of Care Testing Industry Revenue Million Forecast, by Technology 2019 & 2032
- Table 120: Global Point of Care Testing Industry Volume K Unit Forecast, by Technology 2019 & 2032
- Table 121: Global Point of Care Testing Industry Revenue Million Forecast, by End User 2019 & 2032
- Table 122: Global Point of Care Testing Industry Volume K Unit Forecast, by End User 2019 & 2032
- Table 123: Global Point of Care Testing Industry Revenue Million Forecast, by Country 2019 & 2032
- Table 124: Global Point of Care Testing Industry Volume K Unit Forecast, by Country 2019 & 2032
- Table 125: GCC Point of Care Testing Industry Revenue (Million) Forecast, by Application 2019 & 2032
- Table 126: GCC Point of Care Testing Industry Volume (K Unit) Forecast, by Application 2019 & 2032
- Table 127: South Africa Point of Care Testing Industry Revenue (Million) Forecast, by Application 2019 & 2032
- Table 128: South Africa Point of Care Testing Industry Volume (K Unit) Forecast, by Application 2019 & 2032
- Table 129: Rest of Middle East and Africa Point of Care Testing Industry Revenue (Million) Forecast, by Application 2019 & 2032
- Table 130: Rest of Middle East and Africa Point of Care Testing Industry Volume (K Unit) Forecast, by Application 2019 & 2032
- Table 131: Global Point of Care Testing Industry Revenue Million Forecast, by Application 2019 & 2032
- Table 132: Global Point of Care Testing Industry Volume K Unit Forecast, by Application 2019 & 2032
- Table 133: Global Point of Care Testing Industry Revenue Million Forecast, by Technology 2019 & 2032
- Table 134: Global Point of Care Testing Industry Volume K Unit Forecast, by Technology 2019 & 2032
- Table 135: Global Point of Care Testing Industry Revenue Million Forecast, by End User 2019 & 2032
- Table 136: Global Point of Care Testing Industry Volume K Unit Forecast, by End User 2019 & 2032
- Table 137: Global Point of Care Testing Industry Revenue Million Forecast, by Country 2019 & 2032
- Table 138: Global Point of Care Testing Industry Volume K Unit Forecast, by Country 2019 & 2032
- Table 139: Brazil Point of Care Testing Industry Revenue (Million) Forecast, by Application 2019 & 2032
- Table 140: Brazil Point of Care Testing Industry Volume (K Unit) Forecast, by Application 2019 & 2032
- Table 141: Argentina Point of Care Testing Industry Revenue (Million) Forecast, by Application 2019 & 2032
- Table 142: Argentina Point of Care Testing Industry Volume (K Unit) Forecast, by Application 2019 & 2032
- Table 143: Rest of South America Point of Care Testing Industry Revenue (Million) Forecast, by Application 2019 & 2032
- Table 144: Rest of South America Point of Care Testing Industry Volume (K Unit) Forecast, by Application 2019 & 2032
Frequently Asked Questions
1. What is the projected Compound Annual Growth Rate (CAGR) of the Point of Care Testing Industry?
The projected CAGR is approximately 8.77%.
2. Which companies are prominent players in the Point of Care Testing Industry?
Key companies in the market include Becton Dickinson and Company, Biocartis, Siemens Healthineers, F Hoffmann-La Roche Ltd, BioMerieux, Abbott Laboratories, Meridian Bioscience Inc, Danaher Corporation, OraSure Technologies Inc, Thermo Fisher Scientific, Agilent Technologies, Co-Diagnostics Inc.
3. What are the main segments of the Point of Care Testing Industry?
The market segments include Application, Technology, End User.
4. Can you provide details about the market size?
The market size is estimated to be USD 3.67 Million as of 2022.
5. What are some drivers contributing to market growth?
Increasing Prevalence of Infectious Diseases and Cancer; Rising Demand for Point-of-care Diagnostics; Recent Advancements in Technology and Pharmacogenomics.
6. What are the notable trends driving market growth?
The Oncology Segment is Expected to Register a High CAGR During the Forecast Period.
7. Are there any restraints impacting market growth?
Uncertain Reimbursement Scenario; Need for High-complexity Testing Centers.
8. Can you provide examples of recent developments in the market?
In February 2022, Sense Biodetection entered a strategic agreement with Una Health (Una) for the distribution of the Veros COVID-19 test in the United Kingdom.
9. What pricing options are available for accessing the report?
Pricing options include single-user, multi-user, and enterprise licenses priced at USD 4750, USD 5250, and USD 8750 respectively.
10. Is the market size provided in terms of value or volume?
The market size is provided in terms of value, measured in Million and volume, measured in K Unit.
11. Are there any specific market keywords associated with the report?
Yes, the market keyword associated with the report is "Point of Care Testing Industry," which aids in identifying and referencing the specific market segment covered.
12. How do I determine which pricing option suits my needs best?
The pricing options vary based on user requirements and access needs. Individual users may opt for single-user licenses, while businesses requiring broader access may choose multi-user or enterprise licenses for cost-effective access to the report.
13. Are there any additional resources or data provided in the Point of Care Testing Industry report?
While the report offers comprehensive insights, it's advisable to review the specific contents or supplementary materials provided to ascertain if additional resources or data are available.
14. How can I stay updated on further developments or reports in the Point of Care Testing Industry?
To stay informed about further developments, trends, and reports in the Point of Care Testing Industry, consider subscribing to industry newsletters, following relevant companies and organizations, or regularly checking reputable industry news sources and publications.
Methodology
Step 1 - Identification of Relevant Samples Size from Population Database


Step 2 - Approaches for Defining Global Market Size (Value, Volume* & Price*)

Note*: In applicable scenarios
Step 3 - Data Sources
Primary Research
- Web Analytics
- Survey Reports
- Research Institute
- Latest Research Reports
- Opinion Leaders
Secondary Research
- Annual Reports
- White Paper
- Latest Press Release
- Industry Association
- Paid Database
- Investor Presentations

Step 4 - Data Triangulation
Involves using different sources of information in order to increase the validity of a study
These sources are likely to be stakeholders in a program - participants, other researchers, program staff, other community members, and so on.
Then we put all data in single framework & apply various statistical tools to find out the dynamic on the market.
During the analysis stage, feedback from the stakeholder groups would be compared to determine areas of agreement as well as areas of divergence


