
Key Insights
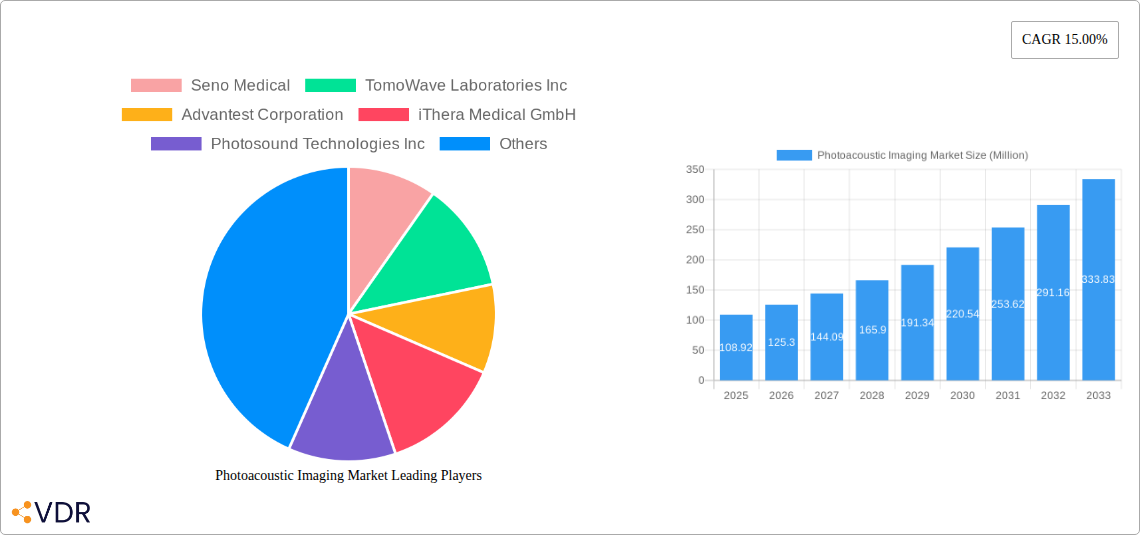
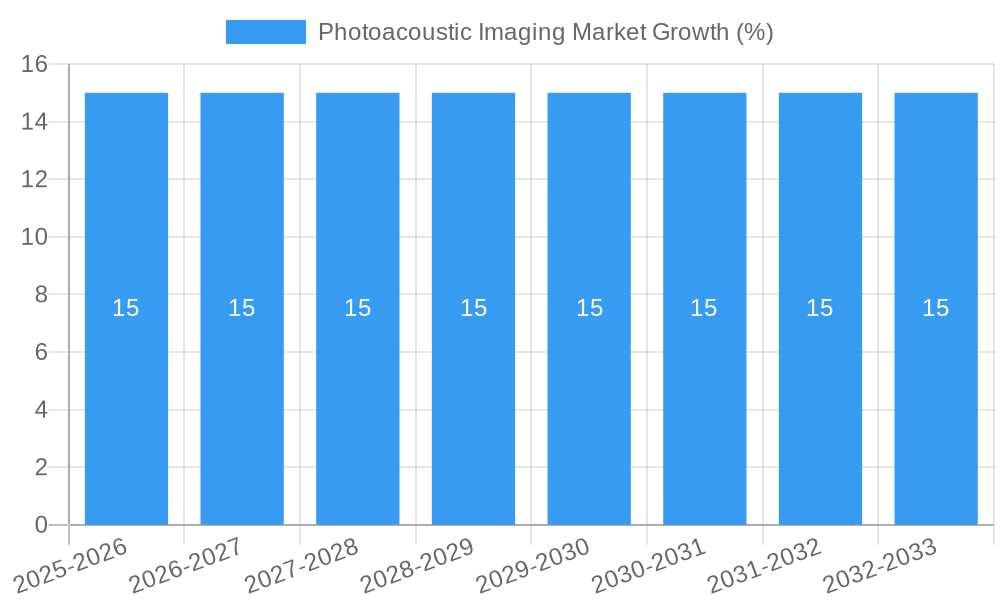
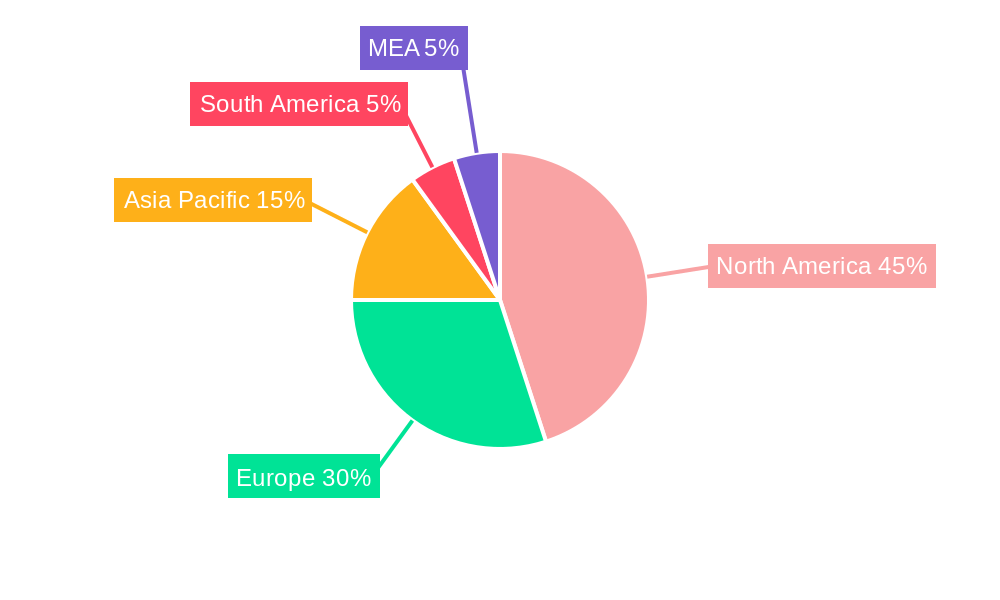
The photoacoustic imaging market is experiencing robust growth, projected to reach a market size of $108.92 million in 2025 and exhibiting a Compound Annual Growth Rate (CAGR) of 15% from 2025 to 2033. This expansion is driven by several key factors. The increasing prevalence of chronic diseases like cancer and cardiovascular conditions fuels demand for advanced diagnostic tools offering superior image resolution and contrast compared to traditional methods. Technological advancements in photoacoustic microscopy and tomography, leading to smaller, more portable, and cost-effective systems, are further propelling market growth. Moreover, the rising adoption of photoacoustic imaging in various applications, including oncology, cardiology, and hematology, across hospitals, diagnostic centers, and research institutes, is significantly contributing to market expansion. The North American market currently holds a dominant share, owing to the region's well-established healthcare infrastructure and substantial investments in research and development. However, Asia-Pacific is anticipated to witness the fastest growth, driven by rising healthcare expenditure and increasing awareness of advanced diagnostic techniques in developing economies.
Despite the significant growth potential, the market faces certain challenges. The high initial investment costs associated with photoacoustic imaging systems can act as a restraint, particularly in resource-constrained settings. Furthermore, the need for skilled professionals for operating and interpreting the sophisticated imaging systems presents another hurdle. However, ongoing technological improvements aimed at lowering costs and streamlining the operation of these systems, coupled with increased government funding and research initiatives supporting the development and adoption of photoacoustic imaging, are expected to mitigate these challenges. The market segmentation by product type (photoacoustic tomography and microscopy), application (oncology, cardiology, etc.), end-user (hospitals, research institutes), and imaging systems further highlights the diverse opportunities within this rapidly expanding sector. The competitive landscape is characterized by a mix of established players and emerging companies actively developing and commercializing innovative photoacoustic imaging technologies.
Photoacoustic Imaging Market: A Comprehensive Report (2019-2033)
This in-depth report provides a comprehensive analysis of the Photoacoustic Imaging market, encompassing market dynamics, growth trends, regional segmentation, product landscape, key players, and future outlook. The study period spans from 2019 to 2033, with 2025 serving as the base and estimated year. This report is invaluable for industry professionals, investors, and researchers seeking a detailed understanding of this rapidly evolving sector. The parent market is Medical Imaging, while the child market is specifically Photoacoustic Imaging. The market size is projected to reach xx Million by 2033.
Photoacoustic Imaging Market Market Dynamics & Structure
The photoacoustic imaging market is characterized by moderate concentration, with key players driving innovation and market share. Technological advancements, particularly in laser technology and image processing, are key drivers, while regulatory approvals and reimbursement policies significantly influence market adoption. The market faces competition from established medical imaging modalities like MRI and ultrasound. Mergers and acquisitions (M&A) activity is relatively low but expected to increase as larger players seek to expand their portfolios.
- Market Concentration: Moderately concentrated, with top 5 players holding approximately xx% market share in 2024.
- Technological Innovation: Continuous improvements in laser technology, image resolution, and data processing algorithms are driving market growth.
- Regulatory Landscape: Varying regulatory approvals and reimbursement policies across different geographies impact market penetration.
- Competitive Substitutes: MRI, Ultrasound, and other advanced imaging techniques pose competitive challenges.
- End-User Demographics: Hospitals and diagnostic centers constitute the largest end-user segment, followed by academic and research institutions.
- M&A Activity: A relatively low number of M&A deals in recent years, with an estimated xx deals concluded between 2019 and 2024.
Photoacoustic Imaging Market Growth Trends & Insights
The photoacoustic imaging market is experiencing robust growth, driven by increasing prevalence of chronic diseases, technological advancements, and rising demand for non-invasive diagnostic tools. The market witnessed a CAGR of xx% during the historical period (2019-2024) and is projected to maintain a CAGR of xx% during the forecast period (2025-2033). Market penetration is gradually increasing, particularly in oncology and cardiology applications. Technological disruptions, such as the development of handheld photoacoustic imaging devices, are further fueling market expansion. Consumer behavior shifts towards minimally invasive procedures are also contributing to market growth. The market size is expected to reach xx Million by 2033, driven primarily by increased adoption in key applications.
Dominant Regions, Countries, or Segments in Photoacoustic Imaging Market
North America currently holds the largest market share, driven by high healthcare expenditure, robust research infrastructure, and early adoption of advanced technologies. However, the Asia-Pacific region is expected to exhibit the fastest growth rate during the forecast period due to increasing healthcare investments and rising prevalence of target diseases.
- By Product Type: Photoacoustic tomography holds a larger market share than photoacoustic microscopy due to its wider range of applications.
- By Application: Oncology is the dominant application segment, followed by cardiology, driven by the need for early and precise diagnosis.
- By End User: Hospitals and diagnostic centers constitute the largest end-user segment, owing to the availability of advanced infrastructure and skilled professionals.
- Key Regional Drivers: North America's strong regulatory framework and high healthcare spending drive market growth. The Asia-Pacific region's expanding healthcare infrastructure and rising prevalence of target diseases fuel rapid expansion.
Photoacoustic Imaging Market Product Landscape
Photoacoustic imaging systems are evolving rapidly, with advancements in laser technology, detector sensitivity, and image reconstruction algorithms resulting in improved image resolution, faster acquisition times, and enhanced diagnostic capabilities. Recent innovations include handheld devices and systems offering multi-modal imaging capabilities, combining photoacoustic imaging with ultrasound or other modalities for enhanced diagnostic information. These advancements are enhancing the diagnostic efficacy and clinical utility of photoacoustic imaging.
Key Drivers, Barriers & Challenges in Photoacoustic Imaging Market
Key Drivers: Rising prevalence of chronic diseases, increasing demand for non-invasive diagnostic procedures, technological advancements in laser technology and image processing, and favorable regulatory environment in certain regions.
Key Challenges: High initial investment cost of systems, limited reimbursement policies in some countries, skilled personnel shortages, and competition from other imaging modalities. The lack of widespread awareness and understanding of photoacoustic imaging among clinicians presents a significant barrier to adoption. This results in slower market penetration and limits the overall market growth. The estimated impact of these challenges on market growth is a reduction of xx% during the forecast period.
Emerging Opportunities in Photoacoustic Imaging Market
Emerging opportunities lie in the development of portable and handheld devices, expansion into new applications such as dermatology and ophthalmology, and integration with artificial intelligence for improved image analysis. The growing demand for personalized medicine and point-of-care diagnostics presents a significant opportunity for the expansion of photoacoustic imaging technology. The integration of photoacoustic imaging with other modalities is further opening new avenues for market growth.
Growth Accelerators in the Photoacoustic Imaging Market Industry
Strategic partnerships between technology providers and healthcare institutions are driving market expansion. Continuous technological innovation, including the development of more sensitive and cost-effective systems, will further accelerate market growth. Expansion into untapped markets, particularly in developing economies, presents significant long-term opportunities.
Key Players Shaping the Photoacoustic Imaging Market Market
- Seno Medical (Seno Medical)
- TomoWave Laboratories Inc
- Advantest Corporation (Advantest Corporation)
- iThera Medical GmbH (iThera Medical GmbH)
- Photosound Technologies Inc
- Kibero
- Fujifilm Holdings Corporation (Fujifilm Visualsonics Inc ) (Fujifilm Holdings Corporation)
- illumiSonics Inc
- InnoLas Laser GmbH
- VibroniX
- Aspectus GmbH
Notable Milestones in Photoacoustic Imaging Market Sector
- May 2022: Fujifilm VisualSonics Inc. launched the Vevo F2, an ultra-high to low frequency (71MHz-1MHz) ultrasound and photoacoustic imaging system for preclinical use. This launch expanded the company's product portfolio and enhanced its market position.
- January 2023: Seno Medical entered into an exclusive distributor agreement with Genetik, Inc., to market, sell, and service the company's Imagio Opto-Acoustic/Ultrasound (OA/US) Breast Imaging System. This strategic partnership broadened Seno Medical's market reach and distribution network.
In-Depth Photoacoustic Imaging Market Market Outlook
The future of the photoacoustic imaging market is bright, driven by ongoing technological advancements, increasing clinical adoption, and expansion into new applications. Strategic partnerships and collaborations are further expected to accelerate market growth. The market is poised for significant expansion in the coming years, presenting lucrative opportunities for both established players and new entrants. The focus on developing cost-effective and portable systems will further drive market penetration and expansion into new geographical markets.
Photoacoustic Imaging Market Segmentation
-
1. Type
- 1.1. Imaging Systems
- 1.2. Lasers
- 1.3. Others
-
2. Product Type
- 2.1. Photoacoustic Tomography
- 2.2. Photoacoustic Microscopy
-
3. Application
- 3.1. Oncology
- 3.2. Cardiology
- 3.3. Hematology
- 3.4. Other Applications
-
4. End User
- 4.1. Hospitals
- 4.2. Diagnostic Centers
- 4.3. Academic and Research Institutes
Photoacoustic Imaging Market Segmentation By Geography
-
1. North America
- 1.1. United States
- 1.2. Canada
- 1.3. Mexico
-
2. Europe
- 2.1. Germany
- 2.2. United Kingdom
- 2.3. France
- 2.4. Italy
- 2.5. Spain
- 2.6. Rest of Europe
-
3. Asia Pacific
- 3.1. China
- 3.2. Japan
- 3.3. India
- 3.4. Australia
- 3.5. South Korea
- 3.6. Rest of Asia Pacific
- 4. Rest of the World
Photoacoustic Imaging Market REPORT HIGHLIGHTS
| Aspects | Details |
|---|---|
| Study Period | 2019-2033 |
| Base Year | 2024 |
| Estimated Year | 2025 |
| Forecast Period | 2025-2033 |
| Historical Period | 2019-2024 |
| Growth Rate | CAGR of 15.00% from 2019-2033 |
| Segmentation |
|
Table of Contents
- 1. Introduction
- 1.1. Research Scope
- 1.2. Market Segmentation
- 1.3. Research Methodology
- 1.4. Definitions and Assumptions
- 2. Executive Summary
- 2.1. Introduction
- 3. Market Dynamics
- 3.1. Introduction
- 3.2. Market Drivers
- 3.2.1. Rising Prevalence of Chronic Diseases; Increasing Adoption of Photoacoustic Imaging in Research Studies
- 3.3. Market Restrains
- 3.3.1. High Cost of the Imaging Systems and Lack of Skilled Professionals
- 3.4. Market Trends
- 3.4.1. Oncology Segment is Expected to Witness Significant Growth Over the Forecast Period
- 4. Market Factor Analysis
- 4.1. Porters Five Forces
- 4.2. Supply/Value Chain
- 4.3. PESTEL analysis
- 4.4. Market Entropy
- 4.5. Patent/Trademark Analysis
- 5. Global Photoacoustic Imaging Market Analysis, Insights and Forecast, 2019-2031
- 5.1. Market Analysis, Insights and Forecast - by Type
- 5.1.1. Imaging Systems
- 5.1.2. Lasers
- 5.1.3. Others
- 5.2. Market Analysis, Insights and Forecast - by Product Type
- 5.2.1. Photoacoustic Tomography
- 5.2.2. Photoacoustic Microscopy
- 5.3. Market Analysis, Insights and Forecast - by Application
- 5.3.1. Oncology
- 5.3.2. Cardiology
- 5.3.3. Hematology
- 5.3.4. Other Applications
- 5.4. Market Analysis, Insights and Forecast - by End User
- 5.4.1. Hospitals
- 5.4.2. Diagnostic Centers
- 5.4.3. Academic and Research Institutes
- 5.5. Market Analysis, Insights and Forecast - by Region
- 5.5.1. North America
- 5.5.2. Europe
- 5.5.3. Asia Pacific
- 5.5.4. Rest of the World
- 5.1. Market Analysis, Insights and Forecast - by Type
- 6. North America Photoacoustic Imaging Market Analysis, Insights and Forecast, 2019-2031
- 6.1. Market Analysis, Insights and Forecast - by Type
- 6.1.1. Imaging Systems
- 6.1.2. Lasers
- 6.1.3. Others
- 6.2. Market Analysis, Insights and Forecast - by Product Type
- 6.2.1. Photoacoustic Tomography
- 6.2.2. Photoacoustic Microscopy
- 6.3. Market Analysis, Insights and Forecast - by Application
- 6.3.1. Oncology
- 6.3.2. Cardiology
- 6.3.3. Hematology
- 6.3.4. Other Applications
- 6.4. Market Analysis, Insights and Forecast - by End User
- 6.4.1. Hospitals
- 6.4.2. Diagnostic Centers
- 6.4.3. Academic and Research Institutes
- 6.1. Market Analysis, Insights and Forecast - by Type
- 7. Europe Photoacoustic Imaging Market Analysis, Insights and Forecast, 2019-2031
- 7.1. Market Analysis, Insights and Forecast - by Type
- 7.1.1. Imaging Systems
- 7.1.2. Lasers
- 7.1.3. Others
- 7.2. Market Analysis, Insights and Forecast - by Product Type
- 7.2.1. Photoacoustic Tomography
- 7.2.2. Photoacoustic Microscopy
- 7.3. Market Analysis, Insights and Forecast - by Application
- 7.3.1. Oncology
- 7.3.2. Cardiology
- 7.3.3. Hematology
- 7.3.4. Other Applications
- 7.4. Market Analysis, Insights and Forecast - by End User
- 7.4.1. Hospitals
- 7.4.2. Diagnostic Centers
- 7.4.3. Academic and Research Institutes
- 7.1. Market Analysis, Insights and Forecast - by Type
- 8. Asia Pacific Photoacoustic Imaging Market Analysis, Insights and Forecast, 2019-2031
- 8.1. Market Analysis, Insights and Forecast - by Type
- 8.1.1. Imaging Systems
- 8.1.2. Lasers
- 8.1.3. Others
- 8.2. Market Analysis, Insights and Forecast - by Product Type
- 8.2.1. Photoacoustic Tomography
- 8.2.2. Photoacoustic Microscopy
- 8.3. Market Analysis, Insights and Forecast - by Application
- 8.3.1. Oncology
- 8.3.2. Cardiology
- 8.3.3. Hematology
- 8.3.4. Other Applications
- 8.4. Market Analysis, Insights and Forecast - by End User
- 8.4.1. Hospitals
- 8.4.2. Diagnostic Centers
- 8.4.3. Academic and Research Institutes
- 8.1. Market Analysis, Insights and Forecast - by Type
- 9. Rest of the World Photoacoustic Imaging Market Analysis, Insights and Forecast, 2019-2031
- 9.1. Market Analysis, Insights and Forecast - by Type
- 9.1.1. Imaging Systems
- 9.1.2. Lasers
- 9.1.3. Others
- 9.2. Market Analysis, Insights and Forecast - by Product Type
- 9.2.1. Photoacoustic Tomography
- 9.2.2. Photoacoustic Microscopy
- 9.3. Market Analysis, Insights and Forecast - by Application
- 9.3.1. Oncology
- 9.3.2. Cardiology
- 9.3.3. Hematology
- 9.3.4. Other Applications
- 9.4. Market Analysis, Insights and Forecast - by End User
- 9.4.1. Hospitals
- 9.4.2. Diagnostic Centers
- 9.4.3. Academic and Research Institutes
- 9.1. Market Analysis, Insights and Forecast - by Type
- 10. North America Photoacoustic Imaging Market Analysis, Insights and Forecast, 2019-2031
- 10.1. Market Analysis, Insights and Forecast - By Country/Sub-region
- 10.1.1 United States
- 10.1.2 Canada
- 10.1.3 Mexico
- 11. Europe Photoacoustic Imaging Market Analysis, Insights and Forecast, 2019-2031
- 11.1. Market Analysis, Insights and Forecast - By Country/Sub-region
- 11.1.1 Germany
- 11.1.2 United Kingdom
- 11.1.3 France
- 11.1.4 Spain
- 11.1.5 Italy
- 11.1.6 Spain
- 11.1.7 Belgium
- 11.1.8 Netherland
- 11.1.9 Nordics
- 11.1.10 Rest of Europe
- 12. Asia Pacific Photoacoustic Imaging Market Analysis, Insights and Forecast, 2019-2031
- 12.1. Market Analysis, Insights and Forecast - By Country/Sub-region
- 12.1.1 China
- 12.1.2 Japan
- 12.1.3 India
- 12.1.4 South Korea
- 12.1.5 Southeast Asia
- 12.1.6 Australia
- 12.1.7 Indonesia
- 12.1.8 Phillipes
- 12.1.9 Singapore
- 12.1.10 Thailandc
- 12.1.11 Rest of Asia Pacific
- 13. South America Photoacoustic Imaging Market Analysis, Insights and Forecast, 2019-2031
- 13.1. Market Analysis, Insights and Forecast - By Country/Sub-region
- 13.1.1 Brazil
- 13.1.2 Argentina
- 13.1.3 Peru
- 13.1.4 Chile
- 13.1.5 Colombia
- 13.1.6 Ecuador
- 13.1.7 Venezuela
- 13.1.8 Rest of South America
- 14. North America Photoacoustic Imaging Market Analysis, Insights and Forecast, 2019-2031
- 14.1. Market Analysis, Insights and Forecast - By Country/Sub-region
- 14.1.1 United States
- 14.1.2 Canada
- 14.1.3 Mexico
- 15. MEA Photoacoustic Imaging Market Analysis, Insights and Forecast, 2019-2031
- 15.1. Market Analysis, Insights and Forecast - By Country/Sub-region
- 15.1.1 United Arab Emirates
- 15.1.2 Saudi Arabia
- 15.1.3 South Africa
- 15.1.4 Rest of Middle East and Africa
- 16. Competitive Analysis
- 16.1. Global Market Share Analysis 2024
- 16.2. Company Profiles
- 16.2.1 Seno Medical
- 16.2.1.1. Overview
- 16.2.1.2. Products
- 16.2.1.3. SWOT Analysis
- 16.2.1.4. Recent Developments
- 16.2.1.5. Financials (Based on Availability)
- 16.2.2 TomoWave Laboratories Inc
- 16.2.2.1. Overview
- 16.2.2.2. Products
- 16.2.2.3. SWOT Analysis
- 16.2.2.4. Recent Developments
- 16.2.2.5. Financials (Based on Availability)
- 16.2.3 Advantest Corporation
- 16.2.3.1. Overview
- 16.2.3.2. Products
- 16.2.3.3. SWOT Analysis
- 16.2.3.4. Recent Developments
- 16.2.3.5. Financials (Based on Availability)
- 16.2.4 iThera Medical GmbH
- 16.2.4.1. Overview
- 16.2.4.2. Products
- 16.2.4.3. SWOT Analysis
- 16.2.4.4. Recent Developments
- 16.2.4.5. Financials (Based on Availability)
- 16.2.5 Photosound Technologies Inc
- 16.2.5.1. Overview
- 16.2.5.2. Products
- 16.2.5.3. SWOT Analysis
- 16.2.5.4. Recent Developments
- 16.2.5.5. Financials (Based on Availability)
- 16.2.6 Kibero
- 16.2.6.1. Overview
- 16.2.6.2. Products
- 16.2.6.3. SWOT Analysis
- 16.2.6.4. Recent Developments
- 16.2.6.5. Financials (Based on Availability)
- 16.2.7 Fujifilm Holdings Corporation (Fujifilm Visualsonics Inc )
- 16.2.7.1. Overview
- 16.2.7.2. Products
- 16.2.7.3. SWOT Analysis
- 16.2.7.4. Recent Developments
- 16.2.7.5. Financials (Based on Availability)
- 16.2.8 illumiSonics Inc
- 16.2.8.1. Overview
- 16.2.8.2. Products
- 16.2.8.3. SWOT Analysis
- 16.2.8.4. Recent Developments
- 16.2.8.5. Financials (Based on Availability)
- 16.2.9 InnoLas Laser GmbH
- 16.2.9.1. Overview
- 16.2.9.2. Products
- 16.2.9.3. SWOT Analysis
- 16.2.9.4. Recent Developments
- 16.2.9.5. Financials (Based on Availability)
- 16.2.10 VibroniX
- 16.2.10.1. Overview
- 16.2.10.2. Products
- 16.2.10.3. SWOT Analysis
- 16.2.10.4. Recent Developments
- 16.2.10.5. Financials (Based on Availability)
- 16.2.11 Aspectus GmbH
- 16.2.11.1. Overview
- 16.2.11.2. Products
- 16.2.11.3. SWOT Analysis
- 16.2.11.4. Recent Developments
- 16.2.11.5. Financials (Based on Availability)
- 16.2.1 Seno Medical
List of Figures
- Figure 1: Global Photoacoustic Imaging Market Revenue Breakdown (Million, %) by Region 2024 & 2032
- Figure 2: North America Photoacoustic Imaging Market Revenue (Million), by Country 2024 & 2032
- Figure 3: North America Photoacoustic Imaging Market Revenue Share (%), by Country 2024 & 2032
- Figure 4: Europe Photoacoustic Imaging Market Revenue (Million), by Country 2024 & 2032
- Figure 5: Europe Photoacoustic Imaging Market Revenue Share (%), by Country 2024 & 2032
- Figure 6: Asia Pacific Photoacoustic Imaging Market Revenue (Million), by Country 2024 & 2032
- Figure 7: Asia Pacific Photoacoustic Imaging Market Revenue Share (%), by Country 2024 & 2032
- Figure 8: South America Photoacoustic Imaging Market Revenue (Million), by Country 2024 & 2032
- Figure 9: South America Photoacoustic Imaging Market Revenue Share (%), by Country 2024 & 2032
- Figure 10: North America Photoacoustic Imaging Market Revenue (Million), by Country 2024 & 2032
- Figure 11: North America Photoacoustic Imaging Market Revenue Share (%), by Country 2024 & 2032
- Figure 12: MEA Photoacoustic Imaging Market Revenue (Million), by Country 2024 & 2032
- Figure 13: MEA Photoacoustic Imaging Market Revenue Share (%), by Country 2024 & 2032
- Figure 14: North America Photoacoustic Imaging Market Revenue (Million), by Type 2024 & 2032
- Figure 15: North America Photoacoustic Imaging Market Revenue Share (%), by Type 2024 & 2032
- Figure 16: North America Photoacoustic Imaging Market Revenue (Million), by Product Type 2024 & 2032
- Figure 17: North America Photoacoustic Imaging Market Revenue Share (%), by Product Type 2024 & 2032
- Figure 18: North America Photoacoustic Imaging Market Revenue (Million), by Application 2024 & 2032
- Figure 19: North America Photoacoustic Imaging Market Revenue Share (%), by Application 2024 & 2032
- Figure 20: North America Photoacoustic Imaging Market Revenue (Million), by End User 2024 & 2032
- Figure 21: North America Photoacoustic Imaging Market Revenue Share (%), by End User 2024 & 2032
- Figure 22: North America Photoacoustic Imaging Market Revenue (Million), by Country 2024 & 2032
- Figure 23: North America Photoacoustic Imaging Market Revenue Share (%), by Country 2024 & 2032
- Figure 24: Europe Photoacoustic Imaging Market Revenue (Million), by Type 2024 & 2032
- Figure 25: Europe Photoacoustic Imaging Market Revenue Share (%), by Type 2024 & 2032
- Figure 26: Europe Photoacoustic Imaging Market Revenue (Million), by Product Type 2024 & 2032
- Figure 27: Europe Photoacoustic Imaging Market Revenue Share (%), by Product Type 2024 & 2032
- Figure 28: Europe Photoacoustic Imaging Market Revenue (Million), by Application 2024 & 2032
- Figure 29: Europe Photoacoustic Imaging Market Revenue Share (%), by Application 2024 & 2032
- Figure 30: Europe Photoacoustic Imaging Market Revenue (Million), by End User 2024 & 2032
- Figure 31: Europe Photoacoustic Imaging Market Revenue Share (%), by End User 2024 & 2032
- Figure 32: Europe Photoacoustic Imaging Market Revenue (Million), by Country 2024 & 2032
- Figure 33: Europe Photoacoustic Imaging Market Revenue Share (%), by Country 2024 & 2032
- Figure 34: Asia Pacific Photoacoustic Imaging Market Revenue (Million), by Type 2024 & 2032
- Figure 35: Asia Pacific Photoacoustic Imaging Market Revenue Share (%), by Type 2024 & 2032
- Figure 36: Asia Pacific Photoacoustic Imaging Market Revenue (Million), by Product Type 2024 & 2032
- Figure 37: Asia Pacific Photoacoustic Imaging Market Revenue Share (%), by Product Type 2024 & 2032
- Figure 38: Asia Pacific Photoacoustic Imaging Market Revenue (Million), by Application 2024 & 2032
- Figure 39: Asia Pacific Photoacoustic Imaging Market Revenue Share (%), by Application 2024 & 2032
- Figure 40: Asia Pacific Photoacoustic Imaging Market Revenue (Million), by End User 2024 & 2032
- Figure 41: Asia Pacific Photoacoustic Imaging Market Revenue Share (%), by End User 2024 & 2032
- Figure 42: Asia Pacific Photoacoustic Imaging Market Revenue (Million), by Country 2024 & 2032
- Figure 43: Asia Pacific Photoacoustic Imaging Market Revenue Share (%), by Country 2024 & 2032
- Figure 44: Rest of the World Photoacoustic Imaging Market Revenue (Million), by Type 2024 & 2032
- Figure 45: Rest of the World Photoacoustic Imaging Market Revenue Share (%), by Type 2024 & 2032
- Figure 46: Rest of the World Photoacoustic Imaging Market Revenue (Million), by Product Type 2024 & 2032
- Figure 47: Rest of the World Photoacoustic Imaging Market Revenue Share (%), by Product Type 2024 & 2032
- Figure 48: Rest of the World Photoacoustic Imaging Market Revenue (Million), by Application 2024 & 2032
- Figure 49: Rest of the World Photoacoustic Imaging Market Revenue Share (%), by Application 2024 & 2032
- Figure 50: Rest of the World Photoacoustic Imaging Market Revenue (Million), by End User 2024 & 2032
- Figure 51: Rest of the World Photoacoustic Imaging Market Revenue Share (%), by End User 2024 & 2032
- Figure 52: Rest of the World Photoacoustic Imaging Market Revenue (Million), by Country 2024 & 2032
- Figure 53: Rest of the World Photoacoustic Imaging Market Revenue Share (%), by Country 2024 & 2032
List of Tables
- Table 1: Global Photoacoustic Imaging Market Revenue Million Forecast, by Region 2019 & 2032
- Table 2: Global Photoacoustic Imaging Market Revenue Million Forecast, by Type 2019 & 2032
- Table 3: Global Photoacoustic Imaging Market Revenue Million Forecast, by Product Type 2019 & 2032
- Table 4: Global Photoacoustic Imaging Market Revenue Million Forecast, by Application 2019 & 2032
- Table 5: Global Photoacoustic Imaging Market Revenue Million Forecast, by End User 2019 & 2032
- Table 6: Global Photoacoustic Imaging Market Revenue Million Forecast, by Region 2019 & 2032
- Table 7: Global Photoacoustic Imaging Market Revenue Million Forecast, by Country 2019 & 2032
- Table 8: United States Photoacoustic Imaging Market Revenue (Million) Forecast, by Application 2019 & 2032
- Table 9: Canada Photoacoustic Imaging Market Revenue (Million) Forecast, by Application 2019 & 2032
- Table 10: Mexico Photoacoustic Imaging Market Revenue (Million) Forecast, by Application 2019 & 2032
- Table 11: Global Photoacoustic Imaging Market Revenue Million Forecast, by Country 2019 & 2032
- Table 12: Germany Photoacoustic Imaging Market Revenue (Million) Forecast, by Application 2019 & 2032
- Table 13: United Kingdom Photoacoustic Imaging Market Revenue (Million) Forecast, by Application 2019 & 2032
- Table 14: France Photoacoustic Imaging Market Revenue (Million) Forecast, by Application 2019 & 2032
- Table 15: Spain Photoacoustic Imaging Market Revenue (Million) Forecast, by Application 2019 & 2032
- Table 16: Italy Photoacoustic Imaging Market Revenue (Million) Forecast, by Application 2019 & 2032
- Table 17: Spain Photoacoustic Imaging Market Revenue (Million) Forecast, by Application 2019 & 2032
- Table 18: Belgium Photoacoustic Imaging Market Revenue (Million) Forecast, by Application 2019 & 2032
- Table 19: Netherland Photoacoustic Imaging Market Revenue (Million) Forecast, by Application 2019 & 2032
- Table 20: Nordics Photoacoustic Imaging Market Revenue (Million) Forecast, by Application 2019 & 2032
- Table 21: Rest of Europe Photoacoustic Imaging Market Revenue (Million) Forecast, by Application 2019 & 2032
- Table 22: Global Photoacoustic Imaging Market Revenue Million Forecast, by Country 2019 & 2032
- Table 23: China Photoacoustic Imaging Market Revenue (Million) Forecast, by Application 2019 & 2032
- Table 24: Japan Photoacoustic Imaging Market Revenue (Million) Forecast, by Application 2019 & 2032
- Table 25: India Photoacoustic Imaging Market Revenue (Million) Forecast, by Application 2019 & 2032
- Table 26: South Korea Photoacoustic Imaging Market Revenue (Million) Forecast, by Application 2019 & 2032
- Table 27: Southeast Asia Photoacoustic Imaging Market Revenue (Million) Forecast, by Application 2019 & 2032
- Table 28: Australia Photoacoustic Imaging Market Revenue (Million) Forecast, by Application 2019 & 2032
- Table 29: Indonesia Photoacoustic Imaging Market Revenue (Million) Forecast, by Application 2019 & 2032
- Table 30: Phillipes Photoacoustic Imaging Market Revenue (Million) Forecast, by Application 2019 & 2032
- Table 31: Singapore Photoacoustic Imaging Market Revenue (Million) Forecast, by Application 2019 & 2032
- Table 32: Thailandc Photoacoustic Imaging Market Revenue (Million) Forecast, by Application 2019 & 2032
- Table 33: Rest of Asia Pacific Photoacoustic Imaging Market Revenue (Million) Forecast, by Application 2019 & 2032
- Table 34: Global Photoacoustic Imaging Market Revenue Million Forecast, by Country 2019 & 2032
- Table 35: Brazil Photoacoustic Imaging Market Revenue (Million) Forecast, by Application 2019 & 2032
- Table 36: Argentina Photoacoustic Imaging Market Revenue (Million) Forecast, by Application 2019 & 2032
- Table 37: Peru Photoacoustic Imaging Market Revenue (Million) Forecast, by Application 2019 & 2032
- Table 38: Chile Photoacoustic Imaging Market Revenue (Million) Forecast, by Application 2019 & 2032
- Table 39: Colombia Photoacoustic Imaging Market Revenue (Million) Forecast, by Application 2019 & 2032
- Table 40: Ecuador Photoacoustic Imaging Market Revenue (Million) Forecast, by Application 2019 & 2032
- Table 41: Venezuela Photoacoustic Imaging Market Revenue (Million) Forecast, by Application 2019 & 2032
- Table 42: Rest of South America Photoacoustic Imaging Market Revenue (Million) Forecast, by Application 2019 & 2032
- Table 43: Global Photoacoustic Imaging Market Revenue Million Forecast, by Country 2019 & 2032
- Table 44: United States Photoacoustic Imaging Market Revenue (Million) Forecast, by Application 2019 & 2032
- Table 45: Canada Photoacoustic Imaging Market Revenue (Million) Forecast, by Application 2019 & 2032
- Table 46: Mexico Photoacoustic Imaging Market Revenue (Million) Forecast, by Application 2019 & 2032
- Table 47: Global Photoacoustic Imaging Market Revenue Million Forecast, by Country 2019 & 2032
- Table 48: United Arab Emirates Photoacoustic Imaging Market Revenue (Million) Forecast, by Application 2019 & 2032
- Table 49: Saudi Arabia Photoacoustic Imaging Market Revenue (Million) Forecast, by Application 2019 & 2032
- Table 50: South Africa Photoacoustic Imaging Market Revenue (Million) Forecast, by Application 2019 & 2032
- Table 51: Rest of Middle East and Africa Photoacoustic Imaging Market Revenue (Million) Forecast, by Application 2019 & 2032
- Table 52: Global Photoacoustic Imaging Market Revenue Million Forecast, by Type 2019 & 2032
- Table 53: Global Photoacoustic Imaging Market Revenue Million Forecast, by Product Type 2019 & 2032
- Table 54: Global Photoacoustic Imaging Market Revenue Million Forecast, by Application 2019 & 2032
- Table 55: Global Photoacoustic Imaging Market Revenue Million Forecast, by End User 2019 & 2032
- Table 56: Global Photoacoustic Imaging Market Revenue Million Forecast, by Country 2019 & 2032
- Table 57: United States Photoacoustic Imaging Market Revenue (Million) Forecast, by Application 2019 & 2032
- Table 58: Canada Photoacoustic Imaging Market Revenue (Million) Forecast, by Application 2019 & 2032
- Table 59: Mexico Photoacoustic Imaging Market Revenue (Million) Forecast, by Application 2019 & 2032
- Table 60: Global Photoacoustic Imaging Market Revenue Million Forecast, by Type 2019 & 2032
- Table 61: Global Photoacoustic Imaging Market Revenue Million Forecast, by Product Type 2019 & 2032
- Table 62: Global Photoacoustic Imaging Market Revenue Million Forecast, by Application 2019 & 2032
- Table 63: Global Photoacoustic Imaging Market Revenue Million Forecast, by End User 2019 & 2032
- Table 64: Global Photoacoustic Imaging Market Revenue Million Forecast, by Country 2019 & 2032
- Table 65: Germany Photoacoustic Imaging Market Revenue (Million) Forecast, by Application 2019 & 2032
- Table 66: United Kingdom Photoacoustic Imaging Market Revenue (Million) Forecast, by Application 2019 & 2032
- Table 67: France Photoacoustic Imaging Market Revenue (Million) Forecast, by Application 2019 & 2032
- Table 68: Italy Photoacoustic Imaging Market Revenue (Million) Forecast, by Application 2019 & 2032
- Table 69: Spain Photoacoustic Imaging Market Revenue (Million) Forecast, by Application 2019 & 2032
- Table 70: Rest of Europe Photoacoustic Imaging Market Revenue (Million) Forecast, by Application 2019 & 2032
- Table 71: Global Photoacoustic Imaging Market Revenue Million Forecast, by Type 2019 & 2032
- Table 72: Global Photoacoustic Imaging Market Revenue Million Forecast, by Product Type 2019 & 2032
- Table 73: Global Photoacoustic Imaging Market Revenue Million Forecast, by Application 2019 & 2032
- Table 74: Global Photoacoustic Imaging Market Revenue Million Forecast, by End User 2019 & 2032
- Table 75: Global Photoacoustic Imaging Market Revenue Million Forecast, by Country 2019 & 2032
- Table 76: China Photoacoustic Imaging Market Revenue (Million) Forecast, by Application 2019 & 2032
- Table 77: Japan Photoacoustic Imaging Market Revenue (Million) Forecast, by Application 2019 & 2032
- Table 78: India Photoacoustic Imaging Market Revenue (Million) Forecast, by Application 2019 & 2032
- Table 79: Australia Photoacoustic Imaging Market Revenue (Million) Forecast, by Application 2019 & 2032
- Table 80: South Korea Photoacoustic Imaging Market Revenue (Million) Forecast, by Application 2019 & 2032
- Table 81: Rest of Asia Pacific Photoacoustic Imaging Market Revenue (Million) Forecast, by Application 2019 & 2032
- Table 82: Global Photoacoustic Imaging Market Revenue Million Forecast, by Type 2019 & 2032
- Table 83: Global Photoacoustic Imaging Market Revenue Million Forecast, by Product Type 2019 & 2032
- Table 84: Global Photoacoustic Imaging Market Revenue Million Forecast, by Application 2019 & 2032
- Table 85: Global Photoacoustic Imaging Market Revenue Million Forecast, by End User 2019 & 2032
- Table 86: Global Photoacoustic Imaging Market Revenue Million Forecast, by Country 2019 & 2032
Frequently Asked Questions
1. What is the projected Compound Annual Growth Rate (CAGR) of the Photoacoustic Imaging Market?
The projected CAGR is approximately 15.00%.
2. Which companies are prominent players in the Photoacoustic Imaging Market?
Key companies in the market include Seno Medical, TomoWave Laboratories Inc, Advantest Corporation, iThera Medical GmbH, Photosound Technologies Inc, Kibero, Fujifilm Holdings Corporation (Fujifilm Visualsonics Inc ), illumiSonics Inc, InnoLas Laser GmbH, VibroniX, Aspectus GmbH.
3. What are the main segments of the Photoacoustic Imaging Market?
The market segments include Type, Product Type, Application, End User.
4. Can you provide details about the market size?
The market size is estimated to be USD 108.92 Million as of 2022.
5. What are some drivers contributing to market growth?
Rising Prevalence of Chronic Diseases; Increasing Adoption of Photoacoustic Imaging in Research Studies.
6. What are the notable trends driving market growth?
Oncology Segment is Expected to Witness Significant Growth Over the Forecast Period.
7. Are there any restraints impacting market growth?
High Cost of the Imaging Systems and Lack of Skilled Professionals.
8. Can you provide examples of recent developments in the market?
January 2023: Seno Medical entered into an exclusive distributor agreement with Genetik, Inc., to market, sell, and service the company's Imagio Opto-Acoustic/Ultrasound (OA/US) Breast Imaging System.
9. What pricing options are available for accessing the report?
Pricing options include single-user, multi-user, and enterprise licenses priced at USD 4750, USD 5250, and USD 8750 respectively.
10. Is the market size provided in terms of value or volume?
The market size is provided in terms of value, measured in Million.
11. Are there any specific market keywords associated with the report?
Yes, the market keyword associated with the report is "Photoacoustic Imaging Market," which aids in identifying and referencing the specific market segment covered.
12. How do I determine which pricing option suits my needs best?
The pricing options vary based on user requirements and access needs. Individual users may opt for single-user licenses, while businesses requiring broader access may choose multi-user or enterprise licenses for cost-effective access to the report.
13. Are there any additional resources or data provided in the Photoacoustic Imaging Market report?
While the report offers comprehensive insights, it's advisable to review the specific contents or supplementary materials provided to ascertain if additional resources or data are available.
14. How can I stay updated on further developments or reports in the Photoacoustic Imaging Market?
To stay informed about further developments, trends, and reports in the Photoacoustic Imaging Market, consider subscribing to industry newsletters, following relevant companies and organizations, or regularly checking reputable industry news sources and publications.
Methodology
Step 1 - Identification of Relevant Samples Size from Population Database


Step 2 - Approaches for Defining Global Market Size (Value, Volume* & Price*)

Note*: In applicable scenarios
Step 3 - Data Sources
Primary Research
- Web Analytics
- Survey Reports
- Research Institute
- Latest Research Reports
- Opinion Leaders
Secondary Research
- Annual Reports
- White Paper
- Latest Press Release
- Industry Association
- Paid Database
- Investor Presentations

Step 4 - Data Triangulation
Involves using different sources of information in order to increase the validity of a study
These sources are likely to be stakeholders in a program - participants, other researchers, program staff, other community members, and so on.
Then we put all data in single framework & apply various statistical tools to find out the dynamic on the market.
During the analysis stage, feedback from the stakeholder groups would be compared to determine areas of agreement as well as areas of divergence


