
Key Insights
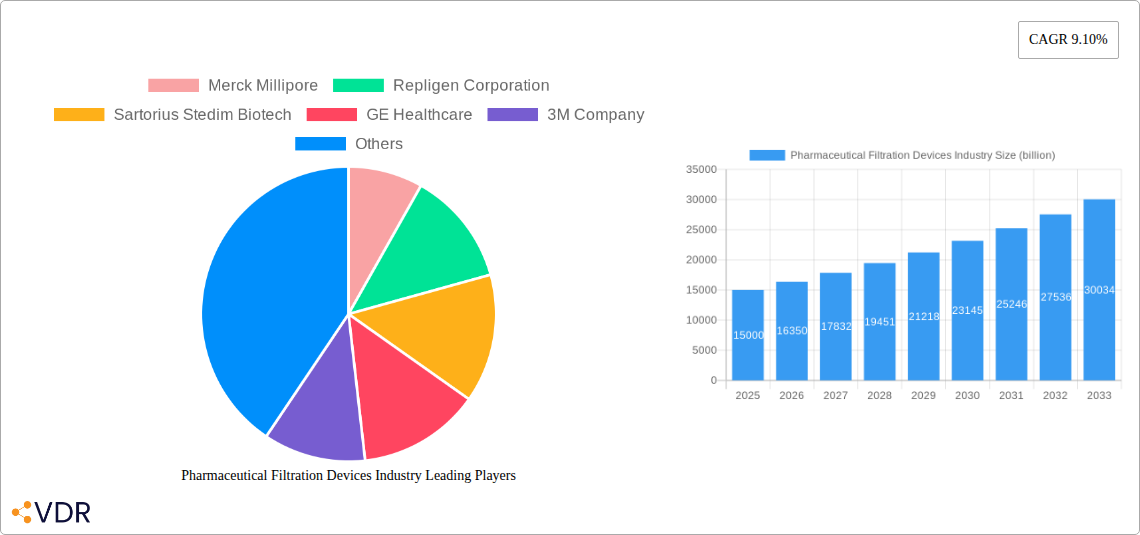
The pharmaceutical filtration devices market is experiencing robust growth, driven by increasing demand for sterile injectable drugs, biologics, and advanced therapies. The market's expansion is fueled by several key factors, including stringent regulatory requirements for pharmaceutical product purity, advancements in filtration technologies (particularly nanofiltration and ultrafiltration), and a growing need for efficient and cost-effective manufacturing processes within the pharmaceutical industry. The rising prevalence of chronic diseases globally further contributes to the market's expansion, as it necessitates higher production volumes of pharmaceuticals requiring sophisticated filtration techniques. Major application areas include final product processing, raw material filtration, cell separation, and water purification, with polyethersulfone (PES) and polyvinylidene difluoride (PVDF) membranes dominating the material segment due to their superior chemical resistance and performance characteristics. The market is highly competitive, with established players like Merck Millipore, Sartorius Stedim Biotech, and Danaher Corporation holding significant market share. However, the emergence of innovative filtration technologies and new entrants presents opportunities for growth and market share disruption. Geographic growth is expected to be driven by expanding pharmaceutical manufacturing facilities in emerging economies, particularly within the Asia-Pacific region, fueled by increasing healthcare expenditure and government initiatives to bolster domestic pharmaceutical production.
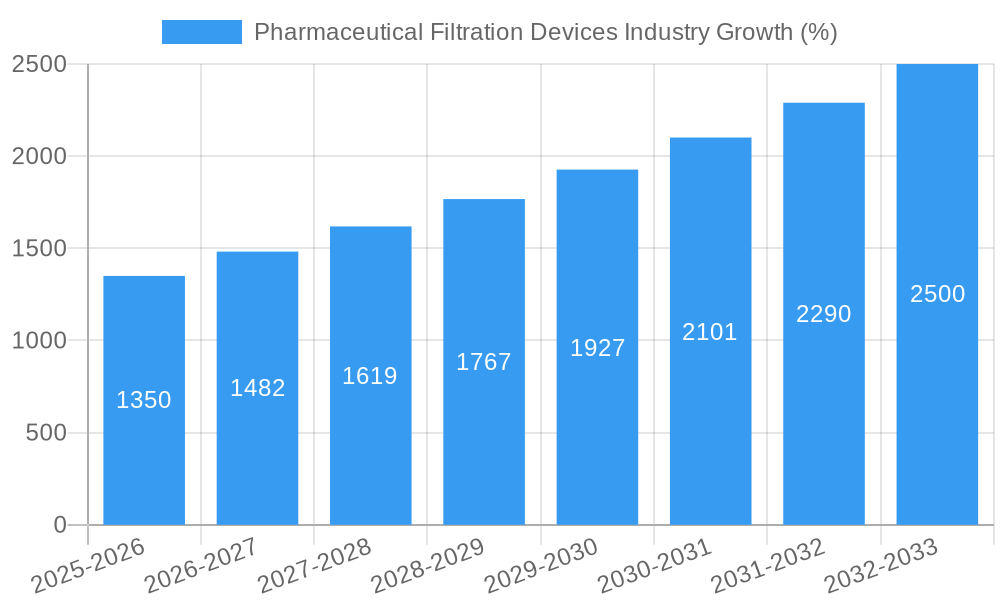
The forecast period (2025-2033) projects continued expansion at a compound annual growth rate (CAGR) of 9.10%, resulting in substantial market value increase. However, potential restraints include the high cost of advanced filtration technologies and the need for skilled personnel to operate and maintain complex filtration systems. Despite these challenges, the long-term outlook remains positive, underpinned by ongoing innovations in filtration membrane materials and techniques, coupled with increasing demand for high-quality pharmaceuticals globally. Strategic partnerships, mergers and acquisitions, and technological advancements are expected to shape the competitive landscape during this period. Companies are likely to focus on developing innovative and cost-effective filtration solutions to cater to the evolving needs of the pharmaceutical industry.
Pharmaceutical Filtration Devices Industry: A Comprehensive Market Report (2019-2033)
This comprehensive report provides an in-depth analysis of the global Pharmaceutical Filtration Devices industry, offering invaluable insights for industry professionals, investors, and strategic decision-makers. With a study period spanning 2019-2033, a base year of 2025, and a forecast period of 2025-2033, this report delivers a detailed understanding of market dynamics, growth trends, and future opportunities. The market is segmented by application (Final Product Processing, Raw Material Filtration, Cell Separation, Water Purification, Air Purification), material (Polyethersulfone (PES), Mixed Cellulose Ester & Cellulose Acetate (MCE & CA), Polyvinylidene Difluoride (PVDF), Nylon Membrane Filters, Others), and technique (Microfiltration, Ultrafiltration, Nanofiltration, Others). Key players analyzed include Merck Millipore, Repligen Corporation, Sartorius Stedim Biotech, GE Healthcare, 3M Company, GEA Group, Danaher Corporation, Graver Technologies, Thermo Fisher Scientific, and Parker Hannifin Corporation. The total market size in 2025 is estimated at $XX billion.
Pharmaceutical Filtration Devices Industry Market Dynamics & Structure
The pharmaceutical filtration devices market is characterized by moderate concentration, with a few major players holding significant market share. Technological innovation, driven by the need for higher efficiency and sterility, is a key driver. Stringent regulatory frameworks, particularly in pharmaceuticals, significantly impact product development and market access. Competitive pressures arise from the availability of substitute technologies and the emergence of new entrants. The end-user demographic is primarily pharmaceutical companies, contract manufacturing organizations (CMOs), and biopharmaceutical manufacturers. M&A activity is relatively frequent, reflecting the industry's consolidation trend.
- Market Concentration: The top 5 players hold approximately XX% of the market share in 2025.
- Technological Innovation: Focus on single-use technologies, automation, and advanced filtration membranes drives growth.
- Regulatory Landscape: Compliance with GMP (Good Manufacturing Practices) and other regulations is crucial.
- Competitive Substitutes: Alternative separation and purification techniques pose a competitive threat.
- M&A Activity: An estimated XX M&A deals occurred between 2019 and 2024, with a predicted XX deals for 2025-2033.
- Innovation Barriers: High R&D costs and lengthy regulatory approval processes pose challenges.
Pharmaceutical Filtration Devices Industry Growth Trends & Insights
The pharmaceutical filtration devices market is experiencing robust growth, driven by increasing demand for biopharmaceuticals, rising prevalence of chronic diseases, and stringent quality control requirements. The market exhibited a CAGR of XX% during the historical period (2019-2024) and is projected to grow at a CAGR of XX% during the forecast period (2025-2033). This growth is fueled by factors like technological advancements in filtration techniques and the adoption of single-use systems. Market penetration is highest in North America and Europe, with significant growth potential in emerging markets like Asia-Pacific. Consumer behavior is shifting towards more efficient and cost-effective solutions, prompting innovation in the industry. The global market is projected to reach $XX billion by 2033.
Dominant Regions, Countries, or Segments in Pharmaceutical Filtration Devices Industry
North America currently dominates the pharmaceutical filtration devices market, driven by high pharmaceutical production, robust R&D investments, and stringent regulatory frameworks. Europe follows closely, also showcasing a high adoption rate. Within the segments, Final Product Processing holds the largest market share, followed by Raw Material Filtration. Polyethersulfone (PES) and Mixed Cellulose Ester & Cellulose Acetate (MCE & CA) are the leading membrane materials. Ultrafiltration remains the dominant filtration technique.
- Key Drivers: Stringent regulatory standards, high investments in R&D, and a large biopharmaceutical industry.
- Dominance Factors: Established infrastructure, high disposable incomes, and favorable government policies.
- Growth Potential: Emerging markets (Asia-Pacific, Latin America) present significant growth opportunities.
- Regional Market Share: North America holds approximately XX% of the market share in 2025, followed by Europe at XX%.
Pharmaceutical Filtration Devices Industry Product Landscape
The product landscape is characterized by a diverse range of filtration devices, including membrane filters, depth filters, and cartridge filters, each catering to specific applications and requirements. Recent innovations focus on improving filtration efficiency, reducing processing times, and enhancing sterility assurance. Unique selling propositions include single-use systems for enhanced sterility and reduced cleaning validation needs, as well as advanced membrane materials for higher throughput and selectivity.
Key Drivers, Barriers & Challenges in Pharmaceutical Filtration Devices Industry
Key Drivers: Increasing demand for biologics, stringent regulatory requirements for product purity, and advancements in filtration technologies are major drivers. The growing focus on personalized medicine further fuels market growth.
Key Challenges: Stringent regulatory approvals, supply chain disruptions impacting raw material availability, and intense competition from established and emerging players pose significant challenges. These factors can result in project delays, cost increases, and reduced profitability. For example, the COVID-19 pandemic impacted supply chains, leading to XX% increase in raw material costs in 2020.
Emerging Opportunities in Pharmaceutical Filtration Devices Industry
Emerging opportunities lie in the development of novel filtration technologies, such as microfluidic devices and advanced membrane materials. Growing demand for personalized medicine and gene therapy will drive the need for specialized filtration solutions. Untapped markets in emerging economies and expanding applications in cell and gene therapy offer substantial growth potential.
Growth Accelerators in the Pharmaceutical Filtration Devices Industry Industry
Strategic partnerships between filtration device manufacturers and pharmaceutical companies are accelerating market growth. Technological advancements in membrane technology, coupled with the increasing adoption of single-use systems, will continue to drive growth. Expansion into emerging markets and the development of novel applications, particularly in the field of cell and gene therapy, are crucial growth catalysts.
Key Players Shaping the Pharmaceutical Filtration Devices Industry Market
- Merck Millipore (Merck Millipore)
- Repligen Corporation (Repligen Corporation)
- Sartorius Stedim Biotech (Sartorius Stedim Biotech)
- GE Healthcare (GE Healthcare)
- 3M Company (3M Company)
- GEA Group (GEA Group)
- Danaher Corporation (Danaher Corporation)
- Graver Technologies
- Thermo Fisher Scientific (Thermo Fisher Scientific)
- Parker Hannifin Corporation (Parker Hannifin Corporation)
Notable Milestones in Pharmaceutical Filtration Devices Industry Sector
- 2020: Increased focus on single-use systems due to the COVID-19 pandemic.
- 2021: Launch of a new high-performance membrane filter by Sartorius Stedim Biotech.
- 2022: Acquisition of a smaller filtration company by Merck Millipore.
- 2023: Introduction of advanced automation solutions for filtration processes by GE Healthcare.
- 2024: Regulatory approval for a novel filtration technology by Repligen Corporation.
In-Depth Pharmaceutical Filtration Devices Industry Market Outlook
The pharmaceutical filtration devices market is poised for continued growth, driven by sustained demand for biopharmaceuticals and technological advancements. The increasing adoption of single-use technologies, expansion into emerging markets, and strategic partnerships will contribute to the market's long-term expansion. Opportunities exist in the development of more efficient and cost-effective filtration solutions catering to emerging therapeutic areas, such as cell and gene therapy. The market is projected to witness significant growth, offering lucrative opportunities for industry participants.
Pharmaceutical Filtration Devices Industry Segmentation
-
1. Material
- 1.1. Polyethersulfone (PES)
- 1.2. Mixed Ce
- 1.3. Polyvinylidene Difluoride (PVDF)
- 1.4. Nylon Membrane Filters
- 1.5. Others
-
2. Technique
- 2.1. Microfiltration
- 2.2. Ultrafiltration
- 2.3. Nanofiltration
- 2.4. Others
-
3. Application
- 3.1. Final Product Processing
- 3.2. Raw Material Filtration
- 3.3. Cell Separation
- 3.4. Water Purification
- 3.5. Air Purification
Pharmaceutical Filtration Devices Industry Segmentation By Geography
-
1. North America
- 1.1. United States
- 1.2. Canada
- 1.3. Mexico
-
2. Europe
- 2.1. Germany
- 2.2. United Kingdom
- 2.3. France
- 2.4. Italy
- 2.5. Spain
- 2.6. Rest of Europe
-
3. Asia Pacific
- 3.1. China
- 3.2. Japan
- 3.3. India
- 3.4. Australia
- 3.5. South Korea
- 3.6. Rest of Asia Pacific
- 4. Rest of the World

Pharmaceutical Filtration Devices Industry REPORT HIGHLIGHTS
| Aspects | Details |
|---|---|
| Study Period | 2019-2033 |
| Base Year | 2024 |
| Estimated Year | 2025 |
| Forecast Period | 2025-2033 |
| Historical Period | 2019-2024 |
| Growth Rate | CAGR of 9.10% from 2019-2033 |
| Segmentation |
|
Table of Contents
- 1. Introduction
- 1.1. Research Scope
- 1.2. Market Segmentation
- 1.3. Research Methodology
- 1.4. Definitions and Assumptions
- 2. Executive Summary
- 2.1. Introduction
- 3. Market Dynamics
- 3.1. Introduction
- 3.2. Market Drivers
- 3.2.1. Increasing Adoption of Single-Use Technologies; Advancements in Nanofiltration Technology
- 3.3. Market Restrains
- 3.3.1. High Capital Required for Operations; Membrane Fouling
- 3.4. Market Trends
- 3.4.1. Microfiltration is Expected to Register a High CAGR Through the Forecast Period
- 4. Market Factor Analysis
- 4.1. Porters Five Forces
- 4.2. Supply/Value Chain
- 4.3. PESTEL analysis
- 4.4. Market Entropy
- 4.5. Patent/Trademark Analysis
- 5. Global Pharmaceutical Filtration Devices Industry Analysis, Insights and Forecast, 2019-2031
- 5.1. Market Analysis, Insights and Forecast - by Material
- 5.1.1. Polyethersulfone (PES)
- 5.1.2. Mixed Ce
- 5.1.3. Polyvinylidene Difluoride (PVDF)
- 5.1.4. Nylon Membrane Filters
- 5.1.5. Others
- 5.2. Market Analysis, Insights and Forecast - by Technique
- 5.2.1. Microfiltration
- 5.2.2. Ultrafiltration
- 5.2.3. Nanofiltration
- 5.2.4. Others
- 5.3. Market Analysis, Insights and Forecast - by Application
- 5.3.1. Final Product Processing
- 5.3.2. Raw Material Filtration
- 5.3.3. Cell Separation
- 5.3.4. Water Purification
- 5.3.5. Air Purification
- 5.4. Market Analysis, Insights and Forecast - by Region
- 5.4.1. North America
- 5.4.2. Europe
- 5.4.3. Asia Pacific
- 5.4.4. Rest of the World
- 5.1. Market Analysis, Insights and Forecast - by Material
- 6. North America Pharmaceutical Filtration Devices Industry Analysis, Insights and Forecast, 2019-2031
- 6.1. Market Analysis, Insights and Forecast - by Material
- 6.1.1. Polyethersulfone (PES)
- 6.1.2. Mixed Ce
- 6.1.3. Polyvinylidene Difluoride (PVDF)
- 6.1.4. Nylon Membrane Filters
- 6.1.5. Others
- 6.2. Market Analysis, Insights and Forecast - by Technique
- 6.2.1. Microfiltration
- 6.2.2. Ultrafiltration
- 6.2.3. Nanofiltration
- 6.2.4. Others
- 6.3. Market Analysis, Insights and Forecast - by Application
- 6.3.1. Final Product Processing
- 6.3.2. Raw Material Filtration
- 6.3.3. Cell Separation
- 6.3.4. Water Purification
- 6.3.5. Air Purification
- 6.1. Market Analysis, Insights and Forecast - by Material
- 7. Europe Pharmaceutical Filtration Devices Industry Analysis, Insights and Forecast, 2019-2031
- 7.1. Market Analysis, Insights and Forecast - by Material
- 7.1.1. Polyethersulfone (PES)
- 7.1.2. Mixed Ce
- 7.1.3. Polyvinylidene Difluoride (PVDF)
- 7.1.4. Nylon Membrane Filters
- 7.1.5. Others
- 7.2. Market Analysis, Insights and Forecast - by Technique
- 7.2.1. Microfiltration
- 7.2.2. Ultrafiltration
- 7.2.3. Nanofiltration
- 7.2.4. Others
- 7.3. Market Analysis, Insights and Forecast - by Application
- 7.3.1. Final Product Processing
- 7.3.2. Raw Material Filtration
- 7.3.3. Cell Separation
- 7.3.4. Water Purification
- 7.3.5. Air Purification
- 7.1. Market Analysis, Insights and Forecast - by Material
- 8. Asia Pacific Pharmaceutical Filtration Devices Industry Analysis, Insights and Forecast, 2019-2031
- 8.1. Market Analysis, Insights and Forecast - by Material
- 8.1.1. Polyethersulfone (PES)
- 8.1.2. Mixed Ce
- 8.1.3. Polyvinylidene Difluoride (PVDF)
- 8.1.4. Nylon Membrane Filters
- 8.1.5. Others
- 8.2. Market Analysis, Insights and Forecast - by Technique
- 8.2.1. Microfiltration
- 8.2.2. Ultrafiltration
- 8.2.3. Nanofiltration
- 8.2.4. Others
- 8.3. Market Analysis, Insights and Forecast - by Application
- 8.3.1. Final Product Processing
- 8.3.2. Raw Material Filtration
- 8.3.3. Cell Separation
- 8.3.4. Water Purification
- 8.3.5. Air Purification
- 8.1. Market Analysis, Insights and Forecast - by Material
- 9. Rest of the World Pharmaceutical Filtration Devices Industry Analysis, Insights and Forecast, 2019-2031
- 9.1. Market Analysis, Insights and Forecast - by Material
- 9.1.1. Polyethersulfone (PES)
- 9.1.2. Mixed Ce
- 9.1.3. Polyvinylidene Difluoride (PVDF)
- 9.1.4. Nylon Membrane Filters
- 9.1.5. Others
- 9.2. Market Analysis, Insights and Forecast - by Technique
- 9.2.1. Microfiltration
- 9.2.2. Ultrafiltration
- 9.2.3. Nanofiltration
- 9.2.4. Others
- 9.3. Market Analysis, Insights and Forecast - by Application
- 9.3.1. Final Product Processing
- 9.3.2. Raw Material Filtration
- 9.3.3. Cell Separation
- 9.3.4. Water Purification
- 9.3.5. Air Purification
- 9.1. Market Analysis, Insights and Forecast - by Material
- 10. North Americ Pharmaceutical Filtration Devices Industry Analysis, Insights and Forecast, 2019-2031
- 10.1. Market Analysis, Insights and Forecast - By Country/Sub-region
- 10.1.1 United States
- 10.1.2 Canada
- 10.1.3 Mexico
- 11. South America Pharmaceutical Filtration Devices Industry Analysis, Insights and Forecast, 2019-2031
- 11.1. Market Analysis, Insights and Forecast - By Country/Sub-region
- 11.1.1 Brazil
- 11.1.2 Mexico
- 11.1.3 Rest of South America
- 12. Europe Pharmaceutical Filtration Devices Industry Analysis, Insights and Forecast, 2019-2031
- 12.1. Market Analysis, Insights and Forecast - By Country/Sub-region
- 12.1.1 Germany
- 12.1.2 United Kingdom
- 12.1.3 France
- 12.1.4 Italy
- 12.1.5 Spain
- 12.1.6 Rest of Europe
- 13. Asia Pacific Pharmaceutical Filtration Devices Industry Analysis, Insights and Forecast, 2019-2031
- 13.1. Market Analysis, Insights and Forecast - By Country/Sub-region
- 13.1.1 China
- 13.1.2 Japan
- 13.1.3 India
- 13.1.4 South Korea
- 13.1.5 Taiwan
- 13.1.6 Australia
- 13.1.7 Rest of Asia-Pacific
- 14. MEA Pharmaceutical Filtration Devices Industry Analysis, Insights and Forecast, 2019-2031
- 14.1. Market Analysis, Insights and Forecast - By Country/Sub-region
- 14.1.1 Middle East
- 14.1.2 Africa
- 15. Competitive Analysis
- 15.1. Global Market Share Analysis 2024
- 15.2. Company Profiles
- 15.2.1 Merck Millipore
- 15.2.1.1. Overview
- 15.2.1.2. Products
- 15.2.1.3. SWOT Analysis
- 15.2.1.4. Recent Developments
- 15.2.1.5. Financials (Based on Availability)
- 15.2.2 Repligen Corporation
- 15.2.2.1. Overview
- 15.2.2.2. Products
- 15.2.2.3. SWOT Analysis
- 15.2.2.4. Recent Developments
- 15.2.2.5. Financials (Based on Availability)
- 15.2.3 Sartorius Stedim Biotech
- 15.2.3.1. Overview
- 15.2.3.2. Products
- 15.2.3.3. SWOT Analysis
- 15.2.3.4. Recent Developments
- 15.2.3.5. Financials (Based on Availability)
- 15.2.4 GE Healthcare
- 15.2.4.1. Overview
- 15.2.4.2. Products
- 15.2.4.3. SWOT Analysis
- 15.2.4.4. Recent Developments
- 15.2.4.5. Financials (Based on Availability)
- 15.2.5 3M Company
- 15.2.5.1. Overview
- 15.2.5.2. Products
- 15.2.5.3. SWOT Analysis
- 15.2.5.4. Recent Developments
- 15.2.5.5. Financials (Based on Availability)
- 15.2.6 GEA Group
- 15.2.6.1. Overview
- 15.2.6.2. Products
- 15.2.6.3. SWOT Analysis
- 15.2.6.4. Recent Developments
- 15.2.6.5. Financials (Based on Availability)
- 15.2.7 Danaher Corporation
- 15.2.7.1. Overview
- 15.2.7.2. Products
- 15.2.7.3. SWOT Analysis
- 15.2.7.4. Recent Developments
- 15.2.7.5. Financials (Based on Availability)
- 15.2.8 Graver Technologies
- 15.2.8.1. Overview
- 15.2.8.2. Products
- 15.2.8.3. SWOT Analysis
- 15.2.8.4. Recent Developments
- 15.2.8.5. Financials (Based on Availability)
- 15.2.9 Thermo Fisher Scientific
- 15.2.9.1. Overview
- 15.2.9.2. Products
- 15.2.9.3. SWOT Analysis
- 15.2.9.4. Recent Developments
- 15.2.9.5. Financials (Based on Availability)
- 15.2.10 Parker Hannifin Corporation
- 15.2.10.1. Overview
- 15.2.10.2. Products
- 15.2.10.3. SWOT Analysis
- 15.2.10.4. Recent Developments
- 15.2.10.5. Financials (Based on Availability)
- 15.2.1 Merck Millipore
List of Figures
- Figure 1: Global Pharmaceutical Filtration Devices Industry Revenue Breakdown (billion, %) by Region 2024 & 2032
- Figure 2: Global Pharmaceutical Filtration Devices Industry Volume Breakdown (K Units, %) by Region 2024 & 2032
- Figure 3: North Americ Pharmaceutical Filtration Devices Industry Revenue (billion), by Country 2024 & 2032
- Figure 4: North Americ Pharmaceutical Filtration Devices Industry Volume (K Units), by Country 2024 & 2032
- Figure 5: North Americ Pharmaceutical Filtration Devices Industry Revenue Share (%), by Country 2024 & 2032
- Figure 6: North Americ Pharmaceutical Filtration Devices Industry Volume Share (%), by Country 2024 & 2032
- Figure 7: South America Pharmaceutical Filtration Devices Industry Revenue (billion), by Country 2024 & 2032
- Figure 8: South America Pharmaceutical Filtration Devices Industry Volume (K Units), by Country 2024 & 2032
- Figure 9: South America Pharmaceutical Filtration Devices Industry Revenue Share (%), by Country 2024 & 2032
- Figure 10: South America Pharmaceutical Filtration Devices Industry Volume Share (%), by Country 2024 & 2032
- Figure 11: Europe Pharmaceutical Filtration Devices Industry Revenue (billion), by Country 2024 & 2032
- Figure 12: Europe Pharmaceutical Filtration Devices Industry Volume (K Units), by Country 2024 & 2032
- Figure 13: Europe Pharmaceutical Filtration Devices Industry Revenue Share (%), by Country 2024 & 2032
- Figure 14: Europe Pharmaceutical Filtration Devices Industry Volume Share (%), by Country 2024 & 2032
- Figure 15: Asia Pacific Pharmaceutical Filtration Devices Industry Revenue (billion), by Country 2024 & 2032
- Figure 16: Asia Pacific Pharmaceutical Filtration Devices Industry Volume (K Units), by Country 2024 & 2032
- Figure 17: Asia Pacific Pharmaceutical Filtration Devices Industry Revenue Share (%), by Country 2024 & 2032
- Figure 18: Asia Pacific Pharmaceutical Filtration Devices Industry Volume Share (%), by Country 2024 & 2032
- Figure 19: MEA Pharmaceutical Filtration Devices Industry Revenue (billion), by Country 2024 & 2032
- Figure 20: MEA Pharmaceutical Filtration Devices Industry Volume (K Units), by Country 2024 & 2032
- Figure 21: MEA Pharmaceutical Filtration Devices Industry Revenue Share (%), by Country 2024 & 2032
- Figure 22: MEA Pharmaceutical Filtration Devices Industry Volume Share (%), by Country 2024 & 2032
- Figure 23: North America Pharmaceutical Filtration Devices Industry Revenue (billion), by Material 2024 & 2032
- Figure 24: North America Pharmaceutical Filtration Devices Industry Volume (K Units), by Material 2024 & 2032
- Figure 25: North America Pharmaceutical Filtration Devices Industry Revenue Share (%), by Material 2024 & 2032
- Figure 26: North America Pharmaceutical Filtration Devices Industry Volume Share (%), by Material 2024 & 2032
- Figure 27: North America Pharmaceutical Filtration Devices Industry Revenue (billion), by Technique 2024 & 2032
- Figure 28: North America Pharmaceutical Filtration Devices Industry Volume (K Units), by Technique 2024 & 2032
- Figure 29: North America Pharmaceutical Filtration Devices Industry Revenue Share (%), by Technique 2024 & 2032
- Figure 30: North America Pharmaceutical Filtration Devices Industry Volume Share (%), by Technique 2024 & 2032
- Figure 31: North America Pharmaceutical Filtration Devices Industry Revenue (billion), by Application 2024 & 2032
- Figure 32: North America Pharmaceutical Filtration Devices Industry Volume (K Units), by Application 2024 & 2032
- Figure 33: North America Pharmaceutical Filtration Devices Industry Revenue Share (%), by Application 2024 & 2032
- Figure 34: North America Pharmaceutical Filtration Devices Industry Volume Share (%), by Application 2024 & 2032
- Figure 35: North America Pharmaceutical Filtration Devices Industry Revenue (billion), by Country 2024 & 2032
- Figure 36: North America Pharmaceutical Filtration Devices Industry Volume (K Units), by Country 2024 & 2032
- Figure 37: North America Pharmaceutical Filtration Devices Industry Revenue Share (%), by Country 2024 & 2032
- Figure 38: North America Pharmaceutical Filtration Devices Industry Volume Share (%), by Country 2024 & 2032
- Figure 39: Europe Pharmaceutical Filtration Devices Industry Revenue (billion), by Material 2024 & 2032
- Figure 40: Europe Pharmaceutical Filtration Devices Industry Volume (K Units), by Material 2024 & 2032
- Figure 41: Europe Pharmaceutical Filtration Devices Industry Revenue Share (%), by Material 2024 & 2032
- Figure 42: Europe Pharmaceutical Filtration Devices Industry Volume Share (%), by Material 2024 & 2032
- Figure 43: Europe Pharmaceutical Filtration Devices Industry Revenue (billion), by Technique 2024 & 2032
- Figure 44: Europe Pharmaceutical Filtration Devices Industry Volume (K Units), by Technique 2024 & 2032
- Figure 45: Europe Pharmaceutical Filtration Devices Industry Revenue Share (%), by Technique 2024 & 2032
- Figure 46: Europe Pharmaceutical Filtration Devices Industry Volume Share (%), by Technique 2024 & 2032
- Figure 47: Europe Pharmaceutical Filtration Devices Industry Revenue (billion), by Application 2024 & 2032
- Figure 48: Europe Pharmaceutical Filtration Devices Industry Volume (K Units), by Application 2024 & 2032
- Figure 49: Europe Pharmaceutical Filtration Devices Industry Revenue Share (%), by Application 2024 & 2032
- Figure 50: Europe Pharmaceutical Filtration Devices Industry Volume Share (%), by Application 2024 & 2032
- Figure 51: Europe Pharmaceutical Filtration Devices Industry Revenue (billion), by Country 2024 & 2032
- Figure 52: Europe Pharmaceutical Filtration Devices Industry Volume (K Units), by Country 2024 & 2032
- Figure 53: Europe Pharmaceutical Filtration Devices Industry Revenue Share (%), by Country 2024 & 2032
- Figure 54: Europe Pharmaceutical Filtration Devices Industry Volume Share (%), by Country 2024 & 2032
- Figure 55: Asia Pacific Pharmaceutical Filtration Devices Industry Revenue (billion), by Material 2024 & 2032
- Figure 56: Asia Pacific Pharmaceutical Filtration Devices Industry Volume (K Units), by Material 2024 & 2032
- Figure 57: Asia Pacific Pharmaceutical Filtration Devices Industry Revenue Share (%), by Material 2024 & 2032
- Figure 58: Asia Pacific Pharmaceutical Filtration Devices Industry Volume Share (%), by Material 2024 & 2032
- Figure 59: Asia Pacific Pharmaceutical Filtration Devices Industry Revenue (billion), by Technique 2024 & 2032
- Figure 60: Asia Pacific Pharmaceutical Filtration Devices Industry Volume (K Units), by Technique 2024 & 2032
- Figure 61: Asia Pacific Pharmaceutical Filtration Devices Industry Revenue Share (%), by Technique 2024 & 2032
- Figure 62: Asia Pacific Pharmaceutical Filtration Devices Industry Volume Share (%), by Technique 2024 & 2032
- Figure 63: Asia Pacific Pharmaceutical Filtration Devices Industry Revenue (billion), by Application 2024 & 2032
- Figure 64: Asia Pacific Pharmaceutical Filtration Devices Industry Volume (K Units), by Application 2024 & 2032
- Figure 65: Asia Pacific Pharmaceutical Filtration Devices Industry Revenue Share (%), by Application 2024 & 2032
- Figure 66: Asia Pacific Pharmaceutical Filtration Devices Industry Volume Share (%), by Application 2024 & 2032
- Figure 67: Asia Pacific Pharmaceutical Filtration Devices Industry Revenue (billion), by Country 2024 & 2032
- Figure 68: Asia Pacific Pharmaceutical Filtration Devices Industry Volume (K Units), by Country 2024 & 2032
- Figure 69: Asia Pacific Pharmaceutical Filtration Devices Industry Revenue Share (%), by Country 2024 & 2032
- Figure 70: Asia Pacific Pharmaceutical Filtration Devices Industry Volume Share (%), by Country 2024 & 2032
- Figure 71: Rest of the World Pharmaceutical Filtration Devices Industry Revenue (billion), by Material 2024 & 2032
- Figure 72: Rest of the World Pharmaceutical Filtration Devices Industry Volume (K Units), by Material 2024 & 2032
- Figure 73: Rest of the World Pharmaceutical Filtration Devices Industry Revenue Share (%), by Material 2024 & 2032
- Figure 74: Rest of the World Pharmaceutical Filtration Devices Industry Volume Share (%), by Material 2024 & 2032
- Figure 75: Rest of the World Pharmaceutical Filtration Devices Industry Revenue (billion), by Technique 2024 & 2032
- Figure 76: Rest of the World Pharmaceutical Filtration Devices Industry Volume (K Units), by Technique 2024 & 2032
- Figure 77: Rest of the World Pharmaceutical Filtration Devices Industry Revenue Share (%), by Technique 2024 & 2032
- Figure 78: Rest of the World Pharmaceutical Filtration Devices Industry Volume Share (%), by Technique 2024 & 2032
- Figure 79: Rest of the World Pharmaceutical Filtration Devices Industry Revenue (billion), by Application 2024 & 2032
- Figure 80: Rest of the World Pharmaceutical Filtration Devices Industry Volume (K Units), by Application 2024 & 2032
- Figure 81: Rest of the World Pharmaceutical Filtration Devices Industry Revenue Share (%), by Application 2024 & 2032
- Figure 82: Rest of the World Pharmaceutical Filtration Devices Industry Volume Share (%), by Application 2024 & 2032
- Figure 83: Rest of the World Pharmaceutical Filtration Devices Industry Revenue (billion), by Country 2024 & 2032
- Figure 84: Rest of the World Pharmaceutical Filtration Devices Industry Volume (K Units), by Country 2024 & 2032
- Figure 85: Rest of the World Pharmaceutical Filtration Devices Industry Revenue Share (%), by Country 2024 & 2032
- Figure 86: Rest of the World Pharmaceutical Filtration Devices Industry Volume Share (%), by Country 2024 & 2032
List of Tables
- Table 1: Global Pharmaceutical Filtration Devices Industry Revenue billion Forecast, by Region 2019 & 2032
- Table 2: Global Pharmaceutical Filtration Devices Industry Volume K Units Forecast, by Region 2019 & 2032
- Table 3: Global Pharmaceutical Filtration Devices Industry Revenue billion Forecast, by Material 2019 & 2032
- Table 4: Global Pharmaceutical Filtration Devices Industry Volume K Units Forecast, by Material 2019 & 2032
- Table 5: Global Pharmaceutical Filtration Devices Industry Revenue billion Forecast, by Technique 2019 & 2032
- Table 6: Global Pharmaceutical Filtration Devices Industry Volume K Units Forecast, by Technique 2019 & 2032
- Table 7: Global Pharmaceutical Filtration Devices Industry Revenue billion Forecast, by Application 2019 & 2032
- Table 8: Global Pharmaceutical Filtration Devices Industry Volume K Units Forecast, by Application 2019 & 2032
- Table 9: Global Pharmaceutical Filtration Devices Industry Revenue billion Forecast, by Region 2019 & 2032
- Table 10: Global Pharmaceutical Filtration Devices Industry Volume K Units Forecast, by Region 2019 & 2032
- Table 11: Global Pharmaceutical Filtration Devices Industry Revenue billion Forecast, by Country 2019 & 2032
- Table 12: Global Pharmaceutical Filtration Devices Industry Volume K Units Forecast, by Country 2019 & 2032
- Table 13: United States Pharmaceutical Filtration Devices Industry Revenue (billion) Forecast, by Application 2019 & 2032
- Table 14: United States Pharmaceutical Filtration Devices Industry Volume (K Units) Forecast, by Application 2019 & 2032
- Table 15: Canada Pharmaceutical Filtration Devices Industry Revenue (billion) Forecast, by Application 2019 & 2032
- Table 16: Canada Pharmaceutical Filtration Devices Industry Volume (K Units) Forecast, by Application 2019 & 2032
- Table 17: Mexico Pharmaceutical Filtration Devices Industry Revenue (billion) Forecast, by Application 2019 & 2032
- Table 18: Mexico Pharmaceutical Filtration Devices Industry Volume (K Units) Forecast, by Application 2019 & 2032
- Table 19: Global Pharmaceutical Filtration Devices Industry Revenue billion Forecast, by Country 2019 & 2032
- Table 20: Global Pharmaceutical Filtration Devices Industry Volume K Units Forecast, by Country 2019 & 2032
- Table 21: Brazil Pharmaceutical Filtration Devices Industry Revenue (billion) Forecast, by Application 2019 & 2032
- Table 22: Brazil Pharmaceutical Filtration Devices Industry Volume (K Units) Forecast, by Application 2019 & 2032
- Table 23: Mexico Pharmaceutical Filtration Devices Industry Revenue (billion) Forecast, by Application 2019 & 2032
- Table 24: Mexico Pharmaceutical Filtration Devices Industry Volume (K Units) Forecast, by Application 2019 & 2032
- Table 25: Rest of South America Pharmaceutical Filtration Devices Industry Revenue (billion) Forecast, by Application 2019 & 2032
- Table 26: Rest of South America Pharmaceutical Filtration Devices Industry Volume (K Units) Forecast, by Application 2019 & 2032
- Table 27: Global Pharmaceutical Filtration Devices Industry Revenue billion Forecast, by Country 2019 & 2032
- Table 28: Global Pharmaceutical Filtration Devices Industry Volume K Units Forecast, by Country 2019 & 2032
- Table 29: Germany Pharmaceutical Filtration Devices Industry Revenue (billion) Forecast, by Application 2019 & 2032
- Table 30: Germany Pharmaceutical Filtration Devices Industry Volume (K Units) Forecast, by Application 2019 & 2032
- Table 31: United Kingdom Pharmaceutical Filtration Devices Industry Revenue (billion) Forecast, by Application 2019 & 2032
- Table 32: United Kingdom Pharmaceutical Filtration Devices Industry Volume (K Units) Forecast, by Application 2019 & 2032
- Table 33: France Pharmaceutical Filtration Devices Industry Revenue (billion) Forecast, by Application 2019 & 2032
- Table 34: France Pharmaceutical Filtration Devices Industry Volume (K Units) Forecast, by Application 2019 & 2032
- Table 35: Italy Pharmaceutical Filtration Devices Industry Revenue (billion) Forecast, by Application 2019 & 2032
- Table 36: Italy Pharmaceutical Filtration Devices Industry Volume (K Units) Forecast, by Application 2019 & 2032
- Table 37: Spain Pharmaceutical Filtration Devices Industry Revenue (billion) Forecast, by Application 2019 & 2032
- Table 38: Spain Pharmaceutical Filtration Devices Industry Volume (K Units) Forecast, by Application 2019 & 2032
- Table 39: Rest of Europe Pharmaceutical Filtration Devices Industry Revenue (billion) Forecast, by Application 2019 & 2032
- Table 40: Rest of Europe Pharmaceutical Filtration Devices Industry Volume (K Units) Forecast, by Application 2019 & 2032
- Table 41: Global Pharmaceutical Filtration Devices Industry Revenue billion Forecast, by Country 2019 & 2032
- Table 42: Global Pharmaceutical Filtration Devices Industry Volume K Units Forecast, by Country 2019 & 2032
- Table 43: China Pharmaceutical Filtration Devices Industry Revenue (billion) Forecast, by Application 2019 & 2032
- Table 44: China Pharmaceutical Filtration Devices Industry Volume (K Units) Forecast, by Application 2019 & 2032
- Table 45: Japan Pharmaceutical Filtration Devices Industry Revenue (billion) Forecast, by Application 2019 & 2032
- Table 46: Japan Pharmaceutical Filtration Devices Industry Volume (K Units) Forecast, by Application 2019 & 2032
- Table 47: India Pharmaceutical Filtration Devices Industry Revenue (billion) Forecast, by Application 2019 & 2032
- Table 48: India Pharmaceutical Filtration Devices Industry Volume (K Units) Forecast, by Application 2019 & 2032
- Table 49: South Korea Pharmaceutical Filtration Devices Industry Revenue (billion) Forecast, by Application 2019 & 2032
- Table 50: South Korea Pharmaceutical Filtration Devices Industry Volume (K Units) Forecast, by Application 2019 & 2032
- Table 51: Taiwan Pharmaceutical Filtration Devices Industry Revenue (billion) Forecast, by Application 2019 & 2032
- Table 52: Taiwan Pharmaceutical Filtration Devices Industry Volume (K Units) Forecast, by Application 2019 & 2032
- Table 53: Australia Pharmaceutical Filtration Devices Industry Revenue (billion) Forecast, by Application 2019 & 2032
- Table 54: Australia Pharmaceutical Filtration Devices Industry Volume (K Units) Forecast, by Application 2019 & 2032
- Table 55: Rest of Asia-Pacific Pharmaceutical Filtration Devices Industry Revenue (billion) Forecast, by Application 2019 & 2032
- Table 56: Rest of Asia-Pacific Pharmaceutical Filtration Devices Industry Volume (K Units) Forecast, by Application 2019 & 2032
- Table 57: Global Pharmaceutical Filtration Devices Industry Revenue billion Forecast, by Country 2019 & 2032
- Table 58: Global Pharmaceutical Filtration Devices Industry Volume K Units Forecast, by Country 2019 & 2032
- Table 59: Middle East Pharmaceutical Filtration Devices Industry Revenue (billion) Forecast, by Application 2019 & 2032
- Table 60: Middle East Pharmaceutical Filtration Devices Industry Volume (K Units) Forecast, by Application 2019 & 2032
- Table 61: Africa Pharmaceutical Filtration Devices Industry Revenue (billion) Forecast, by Application 2019 & 2032
- Table 62: Africa Pharmaceutical Filtration Devices Industry Volume (K Units) Forecast, by Application 2019 & 2032
- Table 63: Global Pharmaceutical Filtration Devices Industry Revenue billion Forecast, by Material 2019 & 2032
- Table 64: Global Pharmaceutical Filtration Devices Industry Volume K Units Forecast, by Material 2019 & 2032
- Table 65: Global Pharmaceutical Filtration Devices Industry Revenue billion Forecast, by Technique 2019 & 2032
- Table 66: Global Pharmaceutical Filtration Devices Industry Volume K Units Forecast, by Technique 2019 & 2032
- Table 67: Global Pharmaceutical Filtration Devices Industry Revenue billion Forecast, by Application 2019 & 2032
- Table 68: Global Pharmaceutical Filtration Devices Industry Volume K Units Forecast, by Application 2019 & 2032
- Table 69: Global Pharmaceutical Filtration Devices Industry Revenue billion Forecast, by Country 2019 & 2032
- Table 70: Global Pharmaceutical Filtration Devices Industry Volume K Units Forecast, by Country 2019 & 2032
- Table 71: United States Pharmaceutical Filtration Devices Industry Revenue (billion) Forecast, by Application 2019 & 2032
- Table 72: United States Pharmaceutical Filtration Devices Industry Volume (K Units) Forecast, by Application 2019 & 2032
- Table 73: Canada Pharmaceutical Filtration Devices Industry Revenue (billion) Forecast, by Application 2019 & 2032
- Table 74: Canada Pharmaceutical Filtration Devices Industry Volume (K Units) Forecast, by Application 2019 & 2032
- Table 75: Mexico Pharmaceutical Filtration Devices Industry Revenue (billion) Forecast, by Application 2019 & 2032
- Table 76: Mexico Pharmaceutical Filtration Devices Industry Volume (K Units) Forecast, by Application 2019 & 2032
- Table 77: Global Pharmaceutical Filtration Devices Industry Revenue billion Forecast, by Material 2019 & 2032
- Table 78: Global Pharmaceutical Filtration Devices Industry Volume K Units Forecast, by Material 2019 & 2032
- Table 79: Global Pharmaceutical Filtration Devices Industry Revenue billion Forecast, by Technique 2019 & 2032
- Table 80: Global Pharmaceutical Filtration Devices Industry Volume K Units Forecast, by Technique 2019 & 2032
- Table 81: Global Pharmaceutical Filtration Devices Industry Revenue billion Forecast, by Application 2019 & 2032
- Table 82: Global Pharmaceutical Filtration Devices Industry Volume K Units Forecast, by Application 2019 & 2032
- Table 83: Global Pharmaceutical Filtration Devices Industry Revenue billion Forecast, by Country 2019 & 2032
- Table 84: Global Pharmaceutical Filtration Devices Industry Volume K Units Forecast, by Country 2019 & 2032
- Table 85: Germany Pharmaceutical Filtration Devices Industry Revenue (billion) Forecast, by Application 2019 & 2032
- Table 86: Germany Pharmaceutical Filtration Devices Industry Volume (K Units) Forecast, by Application 2019 & 2032
- Table 87: United Kingdom Pharmaceutical Filtration Devices Industry Revenue (billion) Forecast, by Application 2019 & 2032
- Table 88: United Kingdom Pharmaceutical Filtration Devices Industry Volume (K Units) Forecast, by Application 2019 & 2032
- Table 89: France Pharmaceutical Filtration Devices Industry Revenue (billion) Forecast, by Application 2019 & 2032
- Table 90: France Pharmaceutical Filtration Devices Industry Volume (K Units) Forecast, by Application 2019 & 2032
- Table 91: Italy Pharmaceutical Filtration Devices Industry Revenue (billion) Forecast, by Application 2019 & 2032
- Table 92: Italy Pharmaceutical Filtration Devices Industry Volume (K Units) Forecast, by Application 2019 & 2032
- Table 93: Spain Pharmaceutical Filtration Devices Industry Revenue (billion) Forecast, by Application 2019 & 2032
- Table 94: Spain Pharmaceutical Filtration Devices Industry Volume (K Units) Forecast, by Application 2019 & 2032
- Table 95: Rest of Europe Pharmaceutical Filtration Devices Industry Revenue (billion) Forecast, by Application 2019 & 2032
- Table 96: Rest of Europe Pharmaceutical Filtration Devices Industry Volume (K Units) Forecast, by Application 2019 & 2032
- Table 97: Global Pharmaceutical Filtration Devices Industry Revenue billion Forecast, by Material 2019 & 2032
- Table 98: Global Pharmaceutical Filtration Devices Industry Volume K Units Forecast, by Material 2019 & 2032
- Table 99: Global Pharmaceutical Filtration Devices Industry Revenue billion Forecast, by Technique 2019 & 2032
- Table 100: Global Pharmaceutical Filtration Devices Industry Volume K Units Forecast, by Technique 2019 & 2032
- Table 101: Global Pharmaceutical Filtration Devices Industry Revenue billion Forecast, by Application 2019 & 2032
- Table 102: Global Pharmaceutical Filtration Devices Industry Volume K Units Forecast, by Application 2019 & 2032
- Table 103: Global Pharmaceutical Filtration Devices Industry Revenue billion Forecast, by Country 2019 & 2032
- Table 104: Global Pharmaceutical Filtration Devices Industry Volume K Units Forecast, by Country 2019 & 2032
- Table 105: China Pharmaceutical Filtration Devices Industry Revenue (billion) Forecast, by Application 2019 & 2032
- Table 106: China Pharmaceutical Filtration Devices Industry Volume (K Units) Forecast, by Application 2019 & 2032
- Table 107: Japan Pharmaceutical Filtration Devices Industry Revenue (billion) Forecast, by Application 2019 & 2032
- Table 108: Japan Pharmaceutical Filtration Devices Industry Volume (K Units) Forecast, by Application 2019 & 2032
- Table 109: India Pharmaceutical Filtration Devices Industry Revenue (billion) Forecast, by Application 2019 & 2032
- Table 110: India Pharmaceutical Filtration Devices Industry Volume (K Units) Forecast, by Application 2019 & 2032
- Table 111: Australia Pharmaceutical Filtration Devices Industry Revenue (billion) Forecast, by Application 2019 & 2032
- Table 112: Australia Pharmaceutical Filtration Devices Industry Volume (K Units) Forecast, by Application 2019 & 2032
- Table 113: South Korea Pharmaceutical Filtration Devices Industry Revenue (billion) Forecast, by Application 2019 & 2032
- Table 114: South Korea Pharmaceutical Filtration Devices Industry Volume (K Units) Forecast, by Application 2019 & 2032
- Table 115: Rest of Asia Pacific Pharmaceutical Filtration Devices Industry Revenue (billion) Forecast, by Application 2019 & 2032
- Table 116: Rest of Asia Pacific Pharmaceutical Filtration Devices Industry Volume (K Units) Forecast, by Application 2019 & 2032
- Table 117: Global Pharmaceutical Filtration Devices Industry Revenue billion Forecast, by Material 2019 & 2032
- Table 118: Global Pharmaceutical Filtration Devices Industry Volume K Units Forecast, by Material 2019 & 2032
- Table 119: Global Pharmaceutical Filtration Devices Industry Revenue billion Forecast, by Technique 2019 & 2032
- Table 120: Global Pharmaceutical Filtration Devices Industry Volume K Units Forecast, by Technique 2019 & 2032
- Table 121: Global Pharmaceutical Filtration Devices Industry Revenue billion Forecast, by Application 2019 & 2032
- Table 122: Global Pharmaceutical Filtration Devices Industry Volume K Units Forecast, by Application 2019 & 2032
- Table 123: Global Pharmaceutical Filtration Devices Industry Revenue billion Forecast, by Country 2019 & 2032
- Table 124: Global Pharmaceutical Filtration Devices Industry Volume K Units Forecast, by Country 2019 & 2032
Frequently Asked Questions
1. What is the projected Compound Annual Growth Rate (CAGR) of the Pharmaceutical Filtration Devices Industry?
The projected CAGR is approximately 9.10%.
2. Which companies are prominent players in the Pharmaceutical Filtration Devices Industry?
Key companies in the market include Merck Millipore, Repligen Corporation, Sartorius Stedim Biotech, GE Healthcare, 3M Company, GEA Group, Danaher Corporation, Graver Technologies, Thermo Fisher Scientific, Parker Hannifin Corporation.
3. What are the main segments of the Pharmaceutical Filtration Devices Industry?
The market segments include Material, Technique, Application.
4. Can you provide details about the market size?
The market size is estimated to be USD XX billion as of 2022.
5. What are some drivers contributing to market growth?
Increasing Adoption of Single-Use Technologies; Advancements in Nanofiltration Technology.
6. What are the notable trends driving market growth?
Microfiltration is Expected to Register a High CAGR Through the Forecast Period.
7. Are there any restraints impacting market growth?
High Capital Required for Operations; Membrane Fouling.
8. Can you provide examples of recent developments in the market?
N/A
9. What pricing options are available for accessing the report?
Pricing options include single-user, multi-user, and enterprise licenses priced at USD 4750, USD 5250, and USD 8750 respectively.
10. Is the market size provided in terms of value or volume?
The market size is provided in terms of value, measured in billion and volume, measured in K Units.
11. Are there any specific market keywords associated with the report?
Yes, the market keyword associated with the report is "Pharmaceutical Filtration Devices Industry," which aids in identifying and referencing the specific market segment covered.
12. How do I determine which pricing option suits my needs best?
The pricing options vary based on user requirements and access needs. Individual users may opt for single-user licenses, while businesses requiring broader access may choose multi-user or enterprise licenses for cost-effective access to the report.
13. Are there any additional resources or data provided in the Pharmaceutical Filtration Devices Industry report?
While the report offers comprehensive insights, it's advisable to review the specific contents or supplementary materials provided to ascertain if additional resources or data are available.
14. How can I stay updated on further developments or reports in the Pharmaceutical Filtration Devices Industry?
To stay informed about further developments, trends, and reports in the Pharmaceutical Filtration Devices Industry, consider subscribing to industry newsletters, following relevant companies and organizations, or regularly checking reputable industry news sources and publications.
Methodology
Step 1 - Identification of Relevant Samples Size from Population Database


Step 2 - Approaches for Defining Global Market Size (Value, Volume* & Price*)

Note*: In applicable scenarios
Step 3 - Data Sources
Primary Research
- Web Analytics
- Survey Reports
- Research Institute
- Latest Research Reports
- Opinion Leaders
Secondary Research
- Annual Reports
- White Paper
- Latest Press Release
- Industry Association
- Paid Database
- Investor Presentations

Step 4 - Data Triangulation
Involves using different sources of information in order to increase the validity of a study
These sources are likely to be stakeholders in a program - participants, other researchers, program staff, other community members, and so on.
Then we put all data in single framework & apply various statistical tools to find out the dynamic on the market.
During the analysis stage, feedback from the stakeholder groups would be compared to determine areas of agreement as well as areas of divergence


