
Key Insights
The Overnight Contact Lenses market is poised for significant expansion, projected to reach a substantial market size of approximately $1,500 million by 2025 and grow at a Compound Annual Growth Rate (CAGR) of around 8.5% through 2033. This robust growth is primarily propelled by escalating rates of myopia and hyperopia globally, coupled with an increasing demand for convenient and advanced vision correction solutions. The convenience factor of overnight lenses, allowing wearers to achieve clear vision throughout the day without the need for daytime lens insertion or removal, is a major driver attracting a growing consumer base. Furthermore, advancements in material science, leading to enhanced oxygen permeability and wearer comfort, are crucial in expanding the market's appeal. The shift towards less invasive and more lifestyle-integrated vision correction options further fuels this upward trajectory, with a notable segment of the population, particularly teenagers and adults, embracing these lenses for their active lifestyles and desire for unhindered visual clarity.
The market is segmented by application into teenagers and adults, with adults currently holding a larger market share due to higher prevalence of refractive errors and greater disposable income. However, the teenager segment is expected to witness accelerated growth driven by increasing awareness of myopia management and the appeal of continuous vision correction. By type, Boston Material and Paragon Material lenses represent the dominant categories, each catering to specific wearer needs regarding breathability and durability. Geographically, North America, led by the United States, currently dominates the market, owing to high adoption rates of advanced contact lens technologies and strong healthcare infrastructure. Asia Pacific, particularly China and India, is emerging as a high-growth region, driven by a burgeoning middle class, increasing prevalence of eye conditions, and rising awareness of eye care solutions. Despite the positive outlook, factors such as the cost of specialized lenses and potential risks associated with overnight wear, if proper hygiene is not maintained, present some restraints to an even faster growth rate, although continuous product innovation aims to mitigate these concerns.
Overnight Contact Lenses Market Dynamics & Structure
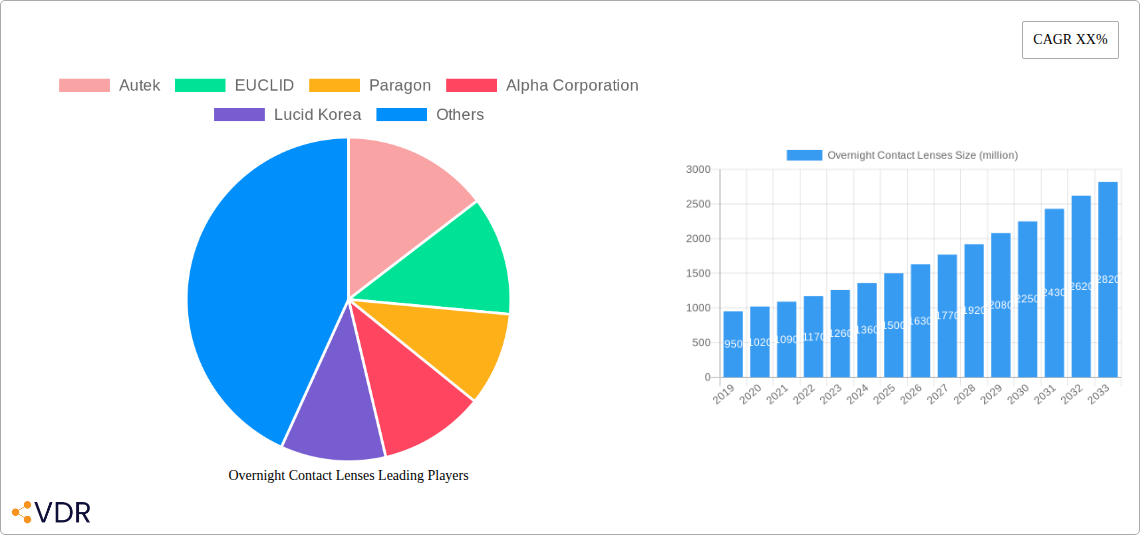
The global overnight contact lens market exhibits a moderately concentrated structure, driven by significant technological advancements and stringent regulatory oversight. Key players like Autek, EUCLID, and Paragon are at the forefront, investing heavily in R&D to enhance lens materials and patient comfort. The market's growth is propelled by a rising prevalence of myopia and astigmatism globally, particularly among younger demographics, and increasing consumer demand for convenient vision correction solutions.
- Market Concentration: Dominated by a few key players, with substantial investment in specialized materials and advanced manufacturing processes.
- Technological Innovation: Driven by developments in oxygen-permeable materials, custom lens designs, and the integration of advanced coatings for enhanced ocular health and wearer comfort.
- Regulatory Frameworks: Influenced by agencies like the FDA and EMA, requiring rigorous testing for safety and efficacy, impacting product launch timelines and market entry for new entrants.
- Competitive Product Substitutes: Includes daily disposable lenses, multifocal lenses, and refractive surgery, posing indirect competition by offering alternative vision correction methods.
- End-User Demographics: A growing segment of teenagers and adults seeking non-invasive, convenient vision correction solutions, with a particular focus on managing progressive myopia.
- M&A Trends: Limited, but strategic acquisitions by larger players to gain access to proprietary technologies or expand their product portfolios are anticipated in the forecast period. The total number of M&A deals in the historical period was 3.
Overnight Contact Lenses Growth Trends & Insights
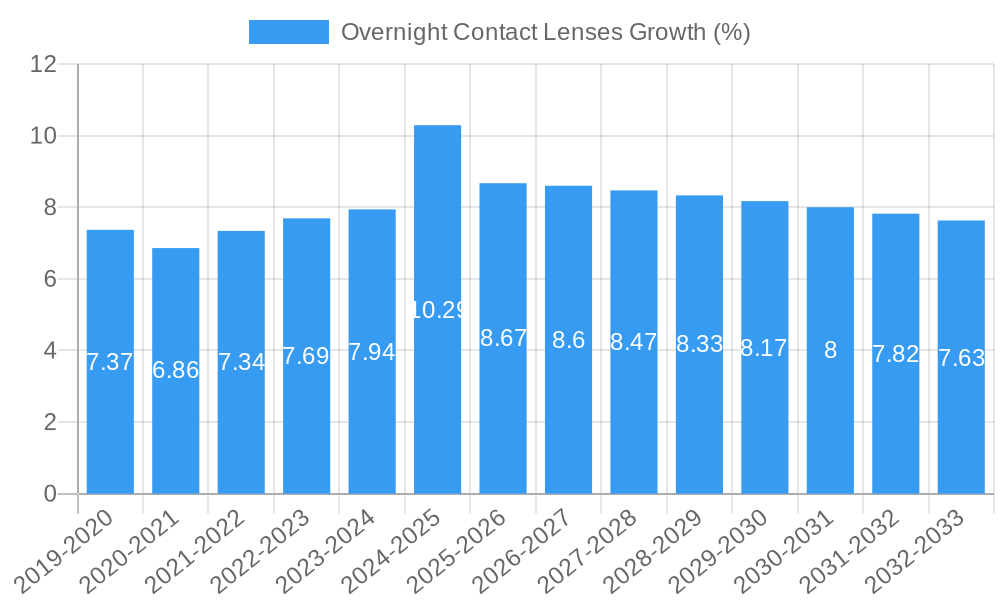
The overnight contact lens market is poised for substantial growth, projecting a compound annual growth rate (CAGR) of 8.7% from 2025 to 2033. This trajectory is fueled by a confluence of factors including a burgeoning global patient base with refractive errors, increasing disposable incomes in emerging economies, and a heightened awareness of the benefits of orthokeratology and scleral lenses for myopia management and eye condition treatment. The market size, estimated at $1,250 million units in the base year of 2025, is expected to reach $2,200 million units by the end of the forecast period in 2033. Technological advancements in material science, leading to enhanced oxygen permeability and comfort, are crucial adoption drivers. Furthermore, a shift in consumer preference towards convenient, non-surgical vision correction methods, coupled with an increasing focus on preventative eye care, particularly among parents of myopic children, is bolstering market penetration. The historical period (2019-2024) saw a CAGR of 7.2%, laying a strong foundation for accelerated growth. This evolution is also marked by a significant increase in clinical research validating the efficacy and safety of overnight lens wear, further building consumer and ophthalmologist confidence. The increasing prevalence of dry eye syndrome and the role of scleral lenses in managing such conditions are also contributing to market expansion.
Dominant Regions, Countries, or Segments in Overnight Contact Lenses
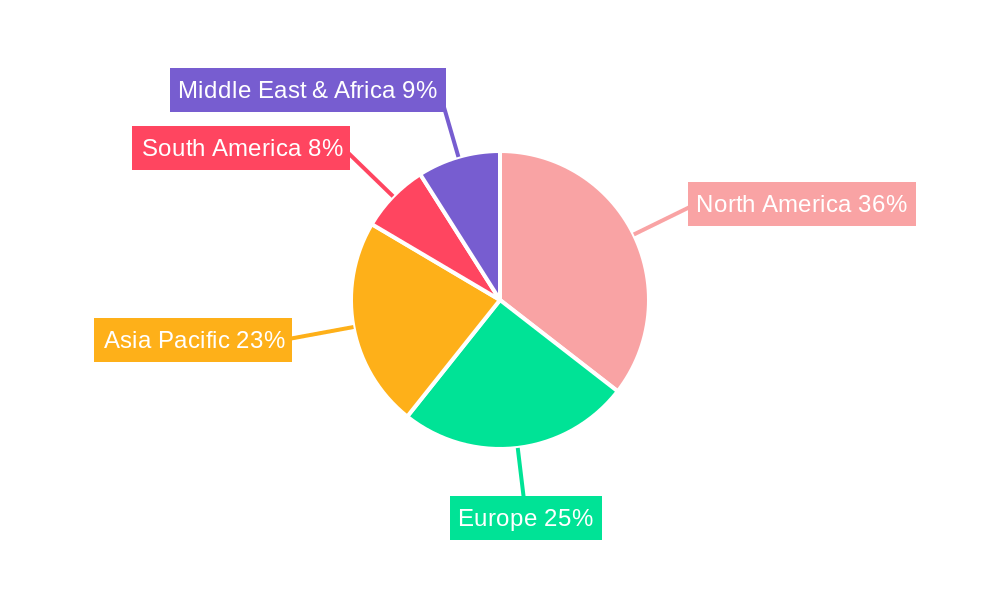
North America, specifically the United States, currently holds the dominant position in the overnight contact lens market, driven by high disposable incomes, advanced healthcare infrastructure, and a proactive approach to myopia management among both healthcare professionals and consumers. The market share for this region is approximately 35% of the global market in 2025. This dominance is further reinforced by the presence of leading manufacturers and a robust regulatory framework that supports innovation while ensuring patient safety. The application segment of Adults is also a primary growth driver, accounting for an estimated 60% of the market in 2025, due to the increasing demand for convenient vision correction solutions that integrate seamlessly into busy lifestyles.
- North America's Dominance: Characterized by high patient awareness, significant R&D investment by companies like Alpha Corporation, and a strong reimbursement landscape for specialized contact lens treatments.
- United States as a Key Market: Demonstrates high adoption rates for overnight lenses due to a strong network of optometrists and ophthalmologists specializing in this field, and extensive marketing efforts by companies such as Lucid Korea.
- Adult Application Segment: Driven by convenience, reduced reliance on daily wear lenses, and suitability for extended periods of visual demand, especially in professional settings.
- Paragon Material's Growth: The growing preference for Paragon Material in overnight lenses due to its established track record in oxygen permeability and comfort contributes significantly to market share, with an estimated 45% of the market in 2025 for this material type.
- Economic Policies and Healthcare Spending: Favorable healthcare policies and substantial per capita healthcare spending in North America contribute to the accessibility and adoption of advanced vision correction technologies.
- Technological Infrastructure: The presence of advanced diagnostic equipment and skilled practitioners in the region facilitates the fitting and management of overnight contact lenses, particularly for complex refractive errors.
- Growth Potential in Asia-Pacific: While currently smaller, the Asia-Pacific region is exhibiting the fastest growth potential, fueled by a rapidly expanding middle class, increasing awareness of myopia control, and rising healthcare expenditure, with countries like China and India expected to contribute significantly to future market expansion.
Overnight Contact Lenses Product Landscape
Innovations in overnight contact lens technology are primarily focused on enhancing material science for superior oxygen transmission, improving lens design for optimal comfort and fit, and developing specialized lenses for myopia control and the management of ocular surface diseases. Products like those from Brighten Optix and Contex are pushing boundaries with advanced silicone hydrogel formulations and customized fitting technologies. Performance metrics are centered on achieving higher Dk/t values (oxygen permeability) and ensuring a stable tear film throughout the overnight wear period. Unique selling propositions include extended wear capability, reduced risk of infection compared to extended wear of older generation lenses, and significant efficacy in slowing myopia progression in children.
Key Drivers, Barriers & Challenges in Overnight Contact Lenses
Key Drivers:
- Rising Myopia Prevalence: The global epidemic of myopia, especially in children, is a primary driver, with overnight lenses offering an effective myopia control strategy.
- Technological Advancements: Development of highly oxygen-permeable materials and precise fitting technologies enhances comfort and safety.
- Convenience and Lifestyle: The desire for freedom from daily spectacles or contact lens wear during waking hours appeals to a broad demographic.
- Effectiveness in Myopia Management: Clinical evidence supporting the efficacy of orthokeratology in slowing myopia progression is a significant catalyst.
Barriers & Challenges:
- Regulatory Hurdles and Approval Times: Stringent approval processes for medical devices can be lengthy and costly for manufacturers like Procornea.
- Patient Compliance and Education: Ensuring proper lens hygiene and wear schedules is crucial to prevent complications, requiring significant patient education.
- Cost of Specialized Lenses: Overnight lenses can be more expensive than conventional contact lenses, potentially limiting accessibility for some patient segments.
- Risk of Infection: Although low with modern lenses, the potential for microbial keratitis remains a concern, necessitating strict adherence to care instructions.
- Competition from Other Treatments: Refractive surgery and other vision correction methods present alternative solutions for consumers.
- Supply Chain Disruptions: Global supply chain vulnerabilities can impact the availability of raw materials and finished products for companies like Precilens, with an estimated 15% of global supply chain disruptions recorded in the historical period impacting availability.
Emerging Opportunities in Overnight Contact Lenses
Emerging opportunities lie in the expansion of myopia management programs, particularly in under-penetrated markets, and the development of novel materials with enhanced biocompatibility and antibacterial properties. The increasing application of overnight scleral lenses for managing severe dry eye disease and other complex ocular surface conditions presents a significant growth avenue. Furthermore, advancements in digital fitting technologies and AI-powered diagnostics could streamline the fitting process and improve patient outcomes, creating a more accessible and personalized experience for individuals using products from companies like Autek. The integration of smart lens technology for continuous ocular health monitoring also represents a future frontier.
Growth Accelerators in the Overnight Contact Lenses Industry
Long-term growth in the overnight contact lens industry will be significantly accelerated by ongoing research and development in material science, leading to lenses with unprecedented oxygen permeability and reduced allergenic potential. Strategic partnerships between lens manufacturers and myopia management organizations are crucial for expanding educational outreach and clinical adoption. Furthermore, the increasing integration of telehealth platforms for remote consultations and lens fitting adjustments, pioneered by forward-thinking companies like EUCLID, will enhance accessibility and patient convenience. Continued positive clinical outcomes data, reinforcing the safety and efficacy of overnight lens wear, will further solidify market trust and drive broader adoption across all age segments.
Key Players Shaping the Overnight Contact Lenses Market
- Autek
- EUCLID
- Paragon
- Alpha Corporation
- Lucid Korea
- Brighten Optix
- Contex
- Procornea
- Precilens
Notable Milestones in Overnight Contact Lenses Sector
- 2019: Introduction of advanced silicone hydrogel materials with significantly improved oxygen permeability.
- 2020: Increased clinical focus on orthokeratology for myopia control gains momentum.
- 2021: Several key companies launch new generation scleral lenses for ocular surface disease management.
- 2022: Enhanced FDA guidelines for overnight lens wear safety and efficacy are emphasized.
- 2023: Growth in digital fitting technologies and remote consultation services for contact lens wearers.
- 2024: Expansion of myopia management research highlighting long-term benefits of overnight lens wear.
In-Depth Overnight Contact Lenses Market Outlook
The outlook for the overnight contact lens market is exceptionally robust, driven by a compelling blend of unmet needs and technological innovation. The sustained global rise in myopia prevalence, coupled with a growing consumer demand for convenient and effective vision correction, paints a clear picture of escalating market penetration. Innovations in advanced materials and precision fitting technologies will continue to be pivotal, ensuring enhanced patient safety and comfort. Strategic collaborations and a deeper understanding of the long-term benefits of overnight wear, particularly in myopia control, will solidify the industry's growth trajectory. The market is poised for significant expansion, offering substantial opportunities for stakeholders committed to advancing ocular health solutions.
Overnight Contact Lenses Segmentation
-
1. Application
- 1.1. Teenagers
- 1.2. Adults
-
2. Types
- 2.1. Boston Material
- 2.2. Paragon Material
Overnight Contact Lenses Segmentation By Geography
-
1. North America
- 1.1. United States
- 1.2. Canada
- 1.3. Mexico
-
2. South America
- 2.1. Brazil
- 2.2. Argentina
- 2.3. Rest of South America
-
3. Europe
- 3.1. United Kingdom
- 3.2. Germany
- 3.3. France
- 3.4. Italy
- 3.5. Spain
- 3.6. Russia
- 3.7. Benelux
- 3.8. Nordics
- 3.9. Rest of Europe
-
4. Middle East & Africa
- 4.1. Turkey
- 4.2. Israel
- 4.3. GCC
- 4.4. North Africa
- 4.5. South Africa
- 4.6. Rest of Middle East & Africa
-
5. Asia Pacific
- 5.1. China
- 5.2. India
- 5.3. Japan
- 5.4. South Korea
- 5.5. ASEAN
- 5.6. Oceania
- 5.7. Rest of Asia Pacific
Overnight Contact Lenses REPORT HIGHLIGHTS
| Aspects | Details |
|---|---|
| Study Period | 2019-2033 |
| Base Year | 2024 |
| Estimated Year | 2025 |
| Forecast Period | 2025-2033 |
| Historical Period | 2019-2024 |
| Growth Rate | CAGR of XX% from 2019-2033 |
| Segmentation |
|
Table of Contents
- 1. Introduction
- 1.1. Research Scope
- 1.2. Market Segmentation
- 1.3. Research Methodology
- 1.4. Definitions and Assumptions
- 2. Executive Summary
- 2.1. Introduction
- 3. Market Dynamics
- 3.1. Introduction
- 3.2. Market Drivers
- 3.3. Market Restrains
- 3.4. Market Trends
- 4. Market Factor Analysis
- 4.1. Porters Five Forces
- 4.2. Supply/Value Chain
- 4.3. PESTEL analysis
- 4.4. Market Entropy
- 4.5. Patent/Trademark Analysis
- 5. Global Overnight Contact Lenses Analysis, Insights and Forecast, 2019-2031
- 5.1. Market Analysis, Insights and Forecast - by Application
- 5.1.1. Teenagers
- 5.1.2. Adults
- 5.2. Market Analysis, Insights and Forecast - by Types
- 5.2.1. Boston Material
- 5.2.2. Paragon Material
- 5.3. Market Analysis, Insights and Forecast - by Region
- 5.3.1. North America
- 5.3.2. South America
- 5.3.3. Europe
- 5.3.4. Middle East & Africa
- 5.3.5. Asia Pacific
- 5.1. Market Analysis, Insights and Forecast - by Application
- 6. North America Overnight Contact Lenses Analysis, Insights and Forecast, 2019-2031
- 6.1. Market Analysis, Insights and Forecast - by Application
- 6.1.1. Teenagers
- 6.1.2. Adults
- 6.2. Market Analysis, Insights and Forecast - by Types
- 6.2.1. Boston Material
- 6.2.2. Paragon Material
- 6.1. Market Analysis, Insights and Forecast - by Application
- 7. South America Overnight Contact Lenses Analysis, Insights and Forecast, 2019-2031
- 7.1. Market Analysis, Insights and Forecast - by Application
- 7.1.1. Teenagers
- 7.1.2. Adults
- 7.2. Market Analysis, Insights and Forecast - by Types
- 7.2.1. Boston Material
- 7.2.2. Paragon Material
- 7.1. Market Analysis, Insights and Forecast - by Application
- 8. Europe Overnight Contact Lenses Analysis, Insights and Forecast, 2019-2031
- 8.1. Market Analysis, Insights and Forecast - by Application
- 8.1.1. Teenagers
- 8.1.2. Adults
- 8.2. Market Analysis, Insights and Forecast - by Types
- 8.2.1. Boston Material
- 8.2.2. Paragon Material
- 8.1. Market Analysis, Insights and Forecast - by Application
- 9. Middle East & Africa Overnight Contact Lenses Analysis, Insights and Forecast, 2019-2031
- 9.1. Market Analysis, Insights and Forecast - by Application
- 9.1.1. Teenagers
- 9.1.2. Adults
- 9.2. Market Analysis, Insights and Forecast - by Types
- 9.2.1. Boston Material
- 9.2.2. Paragon Material
- 9.1. Market Analysis, Insights and Forecast - by Application
- 10. Asia Pacific Overnight Contact Lenses Analysis, Insights and Forecast, 2019-2031
- 10.1. Market Analysis, Insights and Forecast - by Application
- 10.1.1. Teenagers
- 10.1.2. Adults
- 10.2. Market Analysis, Insights and Forecast - by Types
- 10.2.1. Boston Material
- 10.2.2. Paragon Material
- 10.1. Market Analysis, Insights and Forecast - by Application
- 11. Competitive Analysis
- 11.1. Global Market Share Analysis 2024
- 11.2. Company Profiles
- 11.2.1 Autek
- 11.2.1.1. Overview
- 11.2.1.2. Products
- 11.2.1.3. SWOT Analysis
- 11.2.1.4. Recent Developments
- 11.2.1.5. Financials (Based on Availability)
- 11.2.2 EUCLID
- 11.2.2.1. Overview
- 11.2.2.2. Products
- 11.2.2.3. SWOT Analysis
- 11.2.2.4. Recent Developments
- 11.2.2.5. Financials (Based on Availability)
- 11.2.3 Paragon
- 11.2.3.1. Overview
- 11.2.3.2. Products
- 11.2.3.3. SWOT Analysis
- 11.2.3.4. Recent Developments
- 11.2.3.5. Financials (Based on Availability)
- 11.2.4 Alpha Corporation
- 11.2.4.1. Overview
- 11.2.4.2. Products
- 11.2.4.3. SWOT Analysis
- 11.2.4.4. Recent Developments
- 11.2.4.5. Financials (Based on Availability)
- 11.2.5 Lucid Korea
- 11.2.5.1. Overview
- 11.2.5.2. Products
- 11.2.5.3. SWOT Analysis
- 11.2.5.4. Recent Developments
- 11.2.5.5. Financials (Based on Availability)
- 11.2.6 Brighten Optix
- 11.2.6.1. Overview
- 11.2.6.2. Products
- 11.2.6.3. SWOT Analysis
- 11.2.6.4. Recent Developments
- 11.2.6.5. Financials (Based on Availability)
- 11.2.7 Contex
- 11.2.7.1. Overview
- 11.2.7.2. Products
- 11.2.7.3. SWOT Analysis
- 11.2.7.4. Recent Developments
- 11.2.7.5. Financials (Based on Availability)
- 11.2.8 Procornea
- 11.2.8.1. Overview
- 11.2.8.2. Products
- 11.2.8.3. SWOT Analysis
- 11.2.8.4. Recent Developments
- 11.2.8.5. Financials (Based on Availability)
- 11.2.9 Precilens
- 11.2.9.1. Overview
- 11.2.9.2. Products
- 11.2.9.3. SWOT Analysis
- 11.2.9.4. Recent Developments
- 11.2.9.5. Financials (Based on Availability)
- 11.2.1 Autek
List of Figures
- Figure 1: Global Overnight Contact Lenses Revenue Breakdown (million, %) by Region 2024 & 2032
- Figure 2: Global Overnight Contact Lenses Volume Breakdown (K, %) by Region 2024 & 2032
- Figure 3: North America Overnight Contact Lenses Revenue (million), by Application 2024 & 2032
- Figure 4: North America Overnight Contact Lenses Volume (K), by Application 2024 & 2032
- Figure 5: North America Overnight Contact Lenses Revenue Share (%), by Application 2024 & 2032
- Figure 6: North America Overnight Contact Lenses Volume Share (%), by Application 2024 & 2032
- Figure 7: North America Overnight Contact Lenses Revenue (million), by Types 2024 & 2032
- Figure 8: North America Overnight Contact Lenses Volume (K), by Types 2024 & 2032
- Figure 9: North America Overnight Contact Lenses Revenue Share (%), by Types 2024 & 2032
- Figure 10: North America Overnight Contact Lenses Volume Share (%), by Types 2024 & 2032
- Figure 11: North America Overnight Contact Lenses Revenue (million), by Country 2024 & 2032
- Figure 12: North America Overnight Contact Lenses Volume (K), by Country 2024 & 2032
- Figure 13: North America Overnight Contact Lenses Revenue Share (%), by Country 2024 & 2032
- Figure 14: North America Overnight Contact Lenses Volume Share (%), by Country 2024 & 2032
- Figure 15: South America Overnight Contact Lenses Revenue (million), by Application 2024 & 2032
- Figure 16: South America Overnight Contact Lenses Volume (K), by Application 2024 & 2032
- Figure 17: South America Overnight Contact Lenses Revenue Share (%), by Application 2024 & 2032
- Figure 18: South America Overnight Contact Lenses Volume Share (%), by Application 2024 & 2032
- Figure 19: South America Overnight Contact Lenses Revenue (million), by Types 2024 & 2032
- Figure 20: South America Overnight Contact Lenses Volume (K), by Types 2024 & 2032
- Figure 21: South America Overnight Contact Lenses Revenue Share (%), by Types 2024 & 2032
- Figure 22: South America Overnight Contact Lenses Volume Share (%), by Types 2024 & 2032
- Figure 23: South America Overnight Contact Lenses Revenue (million), by Country 2024 & 2032
- Figure 24: South America Overnight Contact Lenses Volume (K), by Country 2024 & 2032
- Figure 25: South America Overnight Contact Lenses Revenue Share (%), by Country 2024 & 2032
- Figure 26: South America Overnight Contact Lenses Volume Share (%), by Country 2024 & 2032
- Figure 27: Europe Overnight Contact Lenses Revenue (million), by Application 2024 & 2032
- Figure 28: Europe Overnight Contact Lenses Volume (K), by Application 2024 & 2032
- Figure 29: Europe Overnight Contact Lenses Revenue Share (%), by Application 2024 & 2032
- Figure 30: Europe Overnight Contact Lenses Volume Share (%), by Application 2024 & 2032
- Figure 31: Europe Overnight Contact Lenses Revenue (million), by Types 2024 & 2032
- Figure 32: Europe Overnight Contact Lenses Volume (K), by Types 2024 & 2032
- Figure 33: Europe Overnight Contact Lenses Revenue Share (%), by Types 2024 & 2032
- Figure 34: Europe Overnight Contact Lenses Volume Share (%), by Types 2024 & 2032
- Figure 35: Europe Overnight Contact Lenses Revenue (million), by Country 2024 & 2032
- Figure 36: Europe Overnight Contact Lenses Volume (K), by Country 2024 & 2032
- Figure 37: Europe Overnight Contact Lenses Revenue Share (%), by Country 2024 & 2032
- Figure 38: Europe Overnight Contact Lenses Volume Share (%), by Country 2024 & 2032
- Figure 39: Middle East & Africa Overnight Contact Lenses Revenue (million), by Application 2024 & 2032
- Figure 40: Middle East & Africa Overnight Contact Lenses Volume (K), by Application 2024 & 2032
- Figure 41: Middle East & Africa Overnight Contact Lenses Revenue Share (%), by Application 2024 & 2032
- Figure 42: Middle East & Africa Overnight Contact Lenses Volume Share (%), by Application 2024 & 2032
- Figure 43: Middle East & Africa Overnight Contact Lenses Revenue (million), by Types 2024 & 2032
- Figure 44: Middle East & Africa Overnight Contact Lenses Volume (K), by Types 2024 & 2032
- Figure 45: Middle East & Africa Overnight Contact Lenses Revenue Share (%), by Types 2024 & 2032
- Figure 46: Middle East & Africa Overnight Contact Lenses Volume Share (%), by Types 2024 & 2032
- Figure 47: Middle East & Africa Overnight Contact Lenses Revenue (million), by Country 2024 & 2032
- Figure 48: Middle East & Africa Overnight Contact Lenses Volume (K), by Country 2024 & 2032
- Figure 49: Middle East & Africa Overnight Contact Lenses Revenue Share (%), by Country 2024 & 2032
- Figure 50: Middle East & Africa Overnight Contact Lenses Volume Share (%), by Country 2024 & 2032
- Figure 51: Asia Pacific Overnight Contact Lenses Revenue (million), by Application 2024 & 2032
- Figure 52: Asia Pacific Overnight Contact Lenses Volume (K), by Application 2024 & 2032
- Figure 53: Asia Pacific Overnight Contact Lenses Revenue Share (%), by Application 2024 & 2032
- Figure 54: Asia Pacific Overnight Contact Lenses Volume Share (%), by Application 2024 & 2032
- Figure 55: Asia Pacific Overnight Contact Lenses Revenue (million), by Types 2024 & 2032
- Figure 56: Asia Pacific Overnight Contact Lenses Volume (K), by Types 2024 & 2032
- Figure 57: Asia Pacific Overnight Contact Lenses Revenue Share (%), by Types 2024 & 2032
- Figure 58: Asia Pacific Overnight Contact Lenses Volume Share (%), by Types 2024 & 2032
- Figure 59: Asia Pacific Overnight Contact Lenses Revenue (million), by Country 2024 & 2032
- Figure 60: Asia Pacific Overnight Contact Lenses Volume (K), by Country 2024 & 2032
- Figure 61: Asia Pacific Overnight Contact Lenses Revenue Share (%), by Country 2024 & 2032
- Figure 62: Asia Pacific Overnight Contact Lenses Volume Share (%), by Country 2024 & 2032
List of Tables
- Table 1: Global Overnight Contact Lenses Revenue million Forecast, by Region 2019 & 2032
- Table 2: Global Overnight Contact Lenses Volume K Forecast, by Region 2019 & 2032
- Table 3: Global Overnight Contact Lenses Revenue million Forecast, by Application 2019 & 2032
- Table 4: Global Overnight Contact Lenses Volume K Forecast, by Application 2019 & 2032
- Table 5: Global Overnight Contact Lenses Revenue million Forecast, by Types 2019 & 2032
- Table 6: Global Overnight Contact Lenses Volume K Forecast, by Types 2019 & 2032
- Table 7: Global Overnight Contact Lenses Revenue million Forecast, by Region 2019 & 2032
- Table 8: Global Overnight Contact Lenses Volume K Forecast, by Region 2019 & 2032
- Table 9: Global Overnight Contact Lenses Revenue million Forecast, by Application 2019 & 2032
- Table 10: Global Overnight Contact Lenses Volume K Forecast, by Application 2019 & 2032
- Table 11: Global Overnight Contact Lenses Revenue million Forecast, by Types 2019 & 2032
- Table 12: Global Overnight Contact Lenses Volume K Forecast, by Types 2019 & 2032
- Table 13: Global Overnight Contact Lenses Revenue million Forecast, by Country 2019 & 2032
- Table 14: Global Overnight Contact Lenses Volume K Forecast, by Country 2019 & 2032
- Table 15: United States Overnight Contact Lenses Revenue (million) Forecast, by Application 2019 & 2032
- Table 16: United States Overnight Contact Lenses Volume (K) Forecast, by Application 2019 & 2032
- Table 17: Canada Overnight Contact Lenses Revenue (million) Forecast, by Application 2019 & 2032
- Table 18: Canada Overnight Contact Lenses Volume (K) Forecast, by Application 2019 & 2032
- Table 19: Mexico Overnight Contact Lenses Revenue (million) Forecast, by Application 2019 & 2032
- Table 20: Mexico Overnight Contact Lenses Volume (K) Forecast, by Application 2019 & 2032
- Table 21: Global Overnight Contact Lenses Revenue million Forecast, by Application 2019 & 2032
- Table 22: Global Overnight Contact Lenses Volume K Forecast, by Application 2019 & 2032
- Table 23: Global Overnight Contact Lenses Revenue million Forecast, by Types 2019 & 2032
- Table 24: Global Overnight Contact Lenses Volume K Forecast, by Types 2019 & 2032
- Table 25: Global Overnight Contact Lenses Revenue million Forecast, by Country 2019 & 2032
- Table 26: Global Overnight Contact Lenses Volume K Forecast, by Country 2019 & 2032
- Table 27: Brazil Overnight Contact Lenses Revenue (million) Forecast, by Application 2019 & 2032
- Table 28: Brazil Overnight Contact Lenses Volume (K) Forecast, by Application 2019 & 2032
- Table 29: Argentina Overnight Contact Lenses Revenue (million) Forecast, by Application 2019 & 2032
- Table 30: Argentina Overnight Contact Lenses Volume (K) Forecast, by Application 2019 & 2032
- Table 31: Rest of South America Overnight Contact Lenses Revenue (million) Forecast, by Application 2019 & 2032
- Table 32: Rest of South America Overnight Contact Lenses Volume (K) Forecast, by Application 2019 & 2032
- Table 33: Global Overnight Contact Lenses Revenue million Forecast, by Application 2019 & 2032
- Table 34: Global Overnight Contact Lenses Volume K Forecast, by Application 2019 & 2032
- Table 35: Global Overnight Contact Lenses Revenue million Forecast, by Types 2019 & 2032
- Table 36: Global Overnight Contact Lenses Volume K Forecast, by Types 2019 & 2032
- Table 37: Global Overnight Contact Lenses Revenue million Forecast, by Country 2019 & 2032
- Table 38: Global Overnight Contact Lenses Volume K Forecast, by Country 2019 & 2032
- Table 39: United Kingdom Overnight Contact Lenses Revenue (million) Forecast, by Application 2019 & 2032
- Table 40: United Kingdom Overnight Contact Lenses Volume (K) Forecast, by Application 2019 & 2032
- Table 41: Germany Overnight Contact Lenses Revenue (million) Forecast, by Application 2019 & 2032
- Table 42: Germany Overnight Contact Lenses Volume (K) Forecast, by Application 2019 & 2032
- Table 43: France Overnight Contact Lenses Revenue (million) Forecast, by Application 2019 & 2032
- Table 44: France Overnight Contact Lenses Volume (K) Forecast, by Application 2019 & 2032
- Table 45: Italy Overnight Contact Lenses Revenue (million) Forecast, by Application 2019 & 2032
- Table 46: Italy Overnight Contact Lenses Volume (K) Forecast, by Application 2019 & 2032
- Table 47: Spain Overnight Contact Lenses Revenue (million) Forecast, by Application 2019 & 2032
- Table 48: Spain Overnight Contact Lenses Volume (K) Forecast, by Application 2019 & 2032
- Table 49: Russia Overnight Contact Lenses Revenue (million) Forecast, by Application 2019 & 2032
- Table 50: Russia Overnight Contact Lenses Volume (K) Forecast, by Application 2019 & 2032
- Table 51: Benelux Overnight Contact Lenses Revenue (million) Forecast, by Application 2019 & 2032
- Table 52: Benelux Overnight Contact Lenses Volume (K) Forecast, by Application 2019 & 2032
- Table 53: Nordics Overnight Contact Lenses Revenue (million) Forecast, by Application 2019 & 2032
- Table 54: Nordics Overnight Contact Lenses Volume (K) Forecast, by Application 2019 & 2032
- Table 55: Rest of Europe Overnight Contact Lenses Revenue (million) Forecast, by Application 2019 & 2032
- Table 56: Rest of Europe Overnight Contact Lenses Volume (K) Forecast, by Application 2019 & 2032
- Table 57: Global Overnight Contact Lenses Revenue million Forecast, by Application 2019 & 2032
- Table 58: Global Overnight Contact Lenses Volume K Forecast, by Application 2019 & 2032
- Table 59: Global Overnight Contact Lenses Revenue million Forecast, by Types 2019 & 2032
- Table 60: Global Overnight Contact Lenses Volume K Forecast, by Types 2019 & 2032
- Table 61: Global Overnight Contact Lenses Revenue million Forecast, by Country 2019 & 2032
- Table 62: Global Overnight Contact Lenses Volume K Forecast, by Country 2019 & 2032
- Table 63: Turkey Overnight Contact Lenses Revenue (million) Forecast, by Application 2019 & 2032
- Table 64: Turkey Overnight Contact Lenses Volume (K) Forecast, by Application 2019 & 2032
- Table 65: Israel Overnight Contact Lenses Revenue (million) Forecast, by Application 2019 & 2032
- Table 66: Israel Overnight Contact Lenses Volume (K) Forecast, by Application 2019 & 2032
- Table 67: GCC Overnight Contact Lenses Revenue (million) Forecast, by Application 2019 & 2032
- Table 68: GCC Overnight Contact Lenses Volume (K) Forecast, by Application 2019 & 2032
- Table 69: North Africa Overnight Contact Lenses Revenue (million) Forecast, by Application 2019 & 2032
- Table 70: North Africa Overnight Contact Lenses Volume (K) Forecast, by Application 2019 & 2032
- Table 71: South Africa Overnight Contact Lenses Revenue (million) Forecast, by Application 2019 & 2032
- Table 72: South Africa Overnight Contact Lenses Volume (K) Forecast, by Application 2019 & 2032
- Table 73: Rest of Middle East & Africa Overnight Contact Lenses Revenue (million) Forecast, by Application 2019 & 2032
- Table 74: Rest of Middle East & Africa Overnight Contact Lenses Volume (K) Forecast, by Application 2019 & 2032
- Table 75: Global Overnight Contact Lenses Revenue million Forecast, by Application 2019 & 2032
- Table 76: Global Overnight Contact Lenses Volume K Forecast, by Application 2019 & 2032
- Table 77: Global Overnight Contact Lenses Revenue million Forecast, by Types 2019 & 2032
- Table 78: Global Overnight Contact Lenses Volume K Forecast, by Types 2019 & 2032
- Table 79: Global Overnight Contact Lenses Revenue million Forecast, by Country 2019 & 2032
- Table 80: Global Overnight Contact Lenses Volume K Forecast, by Country 2019 & 2032
- Table 81: China Overnight Contact Lenses Revenue (million) Forecast, by Application 2019 & 2032
- Table 82: China Overnight Contact Lenses Volume (K) Forecast, by Application 2019 & 2032
- Table 83: India Overnight Contact Lenses Revenue (million) Forecast, by Application 2019 & 2032
- Table 84: India Overnight Contact Lenses Volume (K) Forecast, by Application 2019 & 2032
- Table 85: Japan Overnight Contact Lenses Revenue (million) Forecast, by Application 2019 & 2032
- Table 86: Japan Overnight Contact Lenses Volume (K) Forecast, by Application 2019 & 2032
- Table 87: South Korea Overnight Contact Lenses Revenue (million) Forecast, by Application 2019 & 2032
- Table 88: South Korea Overnight Contact Lenses Volume (K) Forecast, by Application 2019 & 2032
- Table 89: ASEAN Overnight Contact Lenses Revenue (million) Forecast, by Application 2019 & 2032
- Table 90: ASEAN Overnight Contact Lenses Volume (K) Forecast, by Application 2019 & 2032
- Table 91: Oceania Overnight Contact Lenses Revenue (million) Forecast, by Application 2019 & 2032
- Table 92: Oceania Overnight Contact Lenses Volume (K) Forecast, by Application 2019 & 2032
- Table 93: Rest of Asia Pacific Overnight Contact Lenses Revenue (million) Forecast, by Application 2019 & 2032
- Table 94: Rest of Asia Pacific Overnight Contact Lenses Volume (K) Forecast, by Application 2019 & 2032
Frequently Asked Questions
1. What is the projected Compound Annual Growth Rate (CAGR) of the Overnight Contact Lenses?
The projected CAGR is approximately XX%.
2. Which companies are prominent players in the Overnight Contact Lenses?
Key companies in the market include Autek, EUCLID, Paragon, Alpha Corporation, Lucid Korea, Brighten Optix, Contex, Procornea, Precilens.
3. What are the main segments of the Overnight Contact Lenses?
The market segments include Application, Types.
4. Can you provide details about the market size?
The market size is estimated to be USD XXX million as of 2022.
5. What are some drivers contributing to market growth?
N/A
6. What are the notable trends driving market growth?
N/A
7. Are there any restraints impacting market growth?
N/A
8. Can you provide examples of recent developments in the market?
N/A
9. What pricing options are available for accessing the report?
Pricing options include single-user, multi-user, and enterprise licenses priced at USD 3350.00, USD 5025.00, and USD 6700.00 respectively.
10. Is the market size provided in terms of value or volume?
The market size is provided in terms of value, measured in million and volume, measured in K.
11. Are there any specific market keywords associated with the report?
Yes, the market keyword associated with the report is "Overnight Contact Lenses," which aids in identifying and referencing the specific market segment covered.
12. How do I determine which pricing option suits my needs best?
The pricing options vary based on user requirements and access needs. Individual users may opt for single-user licenses, while businesses requiring broader access may choose multi-user or enterprise licenses for cost-effective access to the report.
13. Are there any additional resources or data provided in the Overnight Contact Lenses report?
While the report offers comprehensive insights, it's advisable to review the specific contents or supplementary materials provided to ascertain if additional resources or data are available.
14. How can I stay updated on further developments or reports in the Overnight Contact Lenses?
To stay informed about further developments, trends, and reports in the Overnight Contact Lenses, consider subscribing to industry newsletters, following relevant companies and organizations, or regularly checking reputable industry news sources and publications.
Methodology
Step 1 - Identification of Relevant Samples Size from Population Database


Step 2 - Approaches for Defining Global Market Size (Value, Volume* & Price*)

Note*: In applicable scenarios
Step 3 - Data Sources
Primary Research
- Web Analytics
- Survey Reports
- Research Institute
- Latest Research Reports
- Opinion Leaders
Secondary Research
- Annual Reports
- White Paper
- Latest Press Release
- Industry Association
- Paid Database
- Investor Presentations

Step 4 - Data Triangulation
Involves using different sources of information in order to increase the validity of a study
These sources are likely to be stakeholders in a program - participants, other researchers, program staff, other community members, and so on.
Then we put all data in single framework & apply various statistical tools to find out the dynamic on the market.
During the analysis stage, feedback from the stakeholder groups would be compared to determine areas of agreement as well as areas of divergence


