
Key Insights
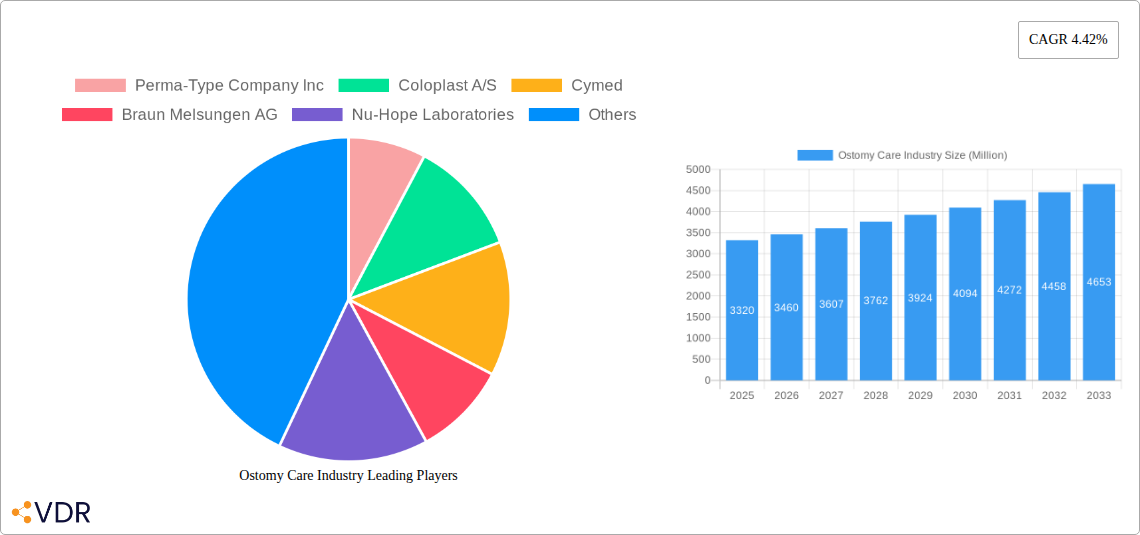
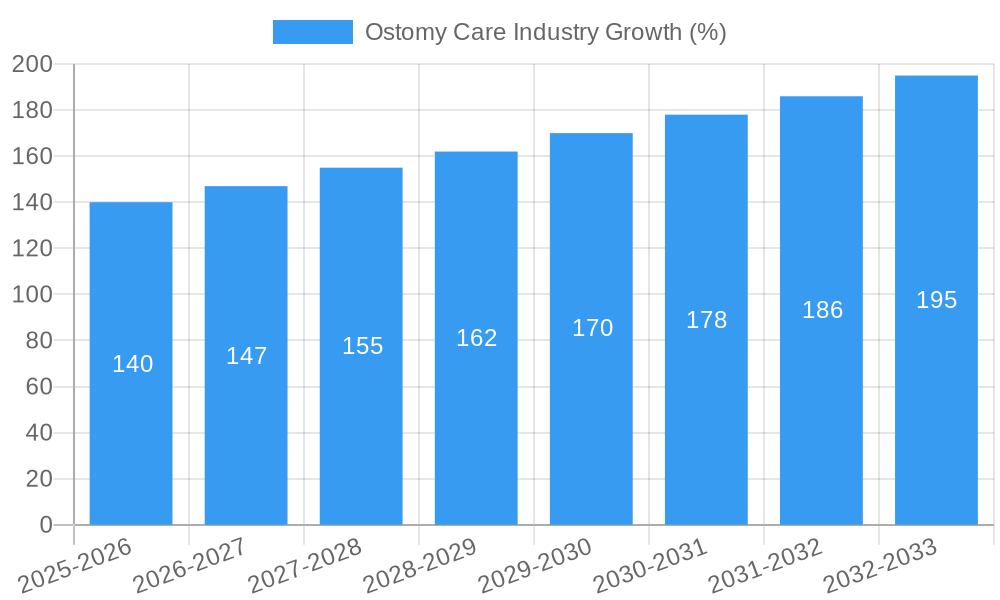
The ostomy care market, valued at $3.32 billion in 2025, is projected to experience robust growth, driven by rising prevalence of colorectal cancer, inflammatory bowel disease (IBD), and other conditions necessitating ostomy surgery. A compound annual growth rate (CAGR) of 4.42% from 2025 to 2033 indicates a significant expansion of this market, reaching an estimated value exceeding $4.8 billion by 2033. Key growth drivers include an aging global population, increasing awareness of ostomy care solutions, technological advancements leading to improved product efficacy and comfort, and the rising adoption of minimally invasive surgical procedures. The market segmentation reveals significant opportunities across product types (ostomy bags and accessories dominating), surgery types (colostomy holding the largest share), and end-users (hospitals and specialty clinics leading, followed by homecare settings and ambulatory surgical centers). Leading players like Coloplast, ConvaTec, and Hollister are driving innovation and market competition, focusing on developing advanced products, expanding their distribution networks, and engaging in strategic partnerships.
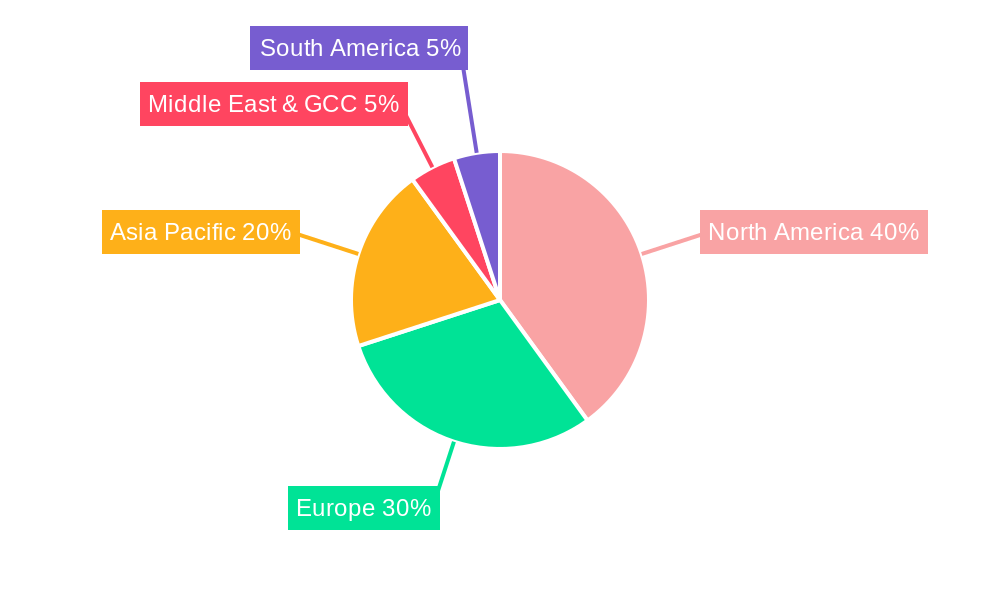
The market's growth is further bolstered by expanding healthcare infrastructure, particularly in developing economies, along with the increasing preference for home healthcare settings. However, challenges remain, including the high cost of ostomy care products, the need for skilled healthcare professionals, and the potential for complications related to ostomy surgery. Regional variations are expected, with North America and Europe maintaining a substantial market share due to high healthcare expenditure and advanced healthcare infrastructure. However, emerging markets in Asia-Pacific and the Middle East are anticipated to demonstrate significant growth potential due to improving healthcare access and increasing awareness of ostomy care. Future market dynamics will depend on the introduction of innovative products, technological advancements that enhance patient comfort and management, and ongoing efforts to improve access to affordable ostomy care solutions globally.
Ostomy Care Industry Market Report: 2019-2033
This comprehensive report provides a detailed analysis of the Ostomy Care industry, encompassing market dynamics, growth trends, regional performance, product landscape, and key players. The study period covers 2019-2033, with 2025 as the base and estimated year. The report is designed for industry professionals, investors, and researchers seeking in-depth insights into this vital healthcare sector. The market size is projected to reach xx Million units by 2033.
Ostomy Care Industry Market Dynamics & Structure
The Ostomy Care market is characterized by a moderately concentrated landscape with several major players holding significant market share. Coloplast A/S, ConvaTec Group Plc, and Hollister Inc. are among the dominant players, collectively accounting for approximately xx% of the global market in 2024. Technological innovation, particularly in materials science and device design, is a key driver, leading to improved product performance, comfort, and patient outcomes. Stringent regulatory frameworks, varying across regions, significantly influence market access and product approval timelines. The market also faces competition from substitute products and therapies, although their impact remains relatively limited. End-user demographics, with an aging population and rising incidence of diseases requiring ostomy surgery, present a significant growth opportunity. M&A activity, as exemplified by the Owens & Minor/Apria acquisition, is accelerating, with xx deals recorded in the historical period, driving consolidation and expansion within the industry.
- Market Concentration: Moderately concentrated, with top 3 players holding xx% market share (2024).
- Technological Innovation: Focus on improved materials, design, and ease of use.
- Regulatory Landscape: Stringent regulations impacting product approvals and market access.
- Competitive Substitutes: Limited impact from substitute therapies.
- End-User Demographics: Aging population and increased prevalence of relevant diseases are key drivers.
- M&A Activity: xx deals in the historical period (2019-2024), driving consolidation.
Ostomy Care Industry Growth Trends & Insights
The Ostomy Care market experienced robust growth during the historical period (2019-2024), with a CAGR of xx%. This growth is primarily attributed to factors such as an aging global population, increasing prevalence of chronic diseases necessitating ostomy surgery (colostomy, ileostomy, urostomy), and rising healthcare expenditure. Technological advancements resulting in improved product functionalities, such as improved adhesives, skin-friendly materials, and discreet designs, have also fuelled market expansion. Furthermore, the rising adoption of minimally invasive surgical techniques and the growing awareness among patients about the benefits of ostomy care products have contributed significantly to market growth. The market penetration of advanced ostomy bags, particularly those incorporating features such as odor control and improved seal technology, is also on the rise. Consumer behavior is shifting towards preference for convenient, discreet, and user-friendly products, thereby propelling demand for technologically advanced ostomy care solutions. The forecast period (2025-2033) anticipates continued growth, driven by similar trends, projecting a CAGR of xx%.
Dominant Regions, Countries, or Segments in Ostomy Care Industry
North America currently holds the largest market share within the Ostomy Care industry, driven by high healthcare expenditure, advanced healthcare infrastructure, and a relatively high prevalence of diseases requiring ostomy surgery. Within this region, the United States is the dominant market. Europe follows as the second largest market, with significant growth potential in emerging economies within the region. Among product types, Ostomy Bags constitute the largest segment, followed by Ostomy Accessories. The Colostomy segment dominates within the surgery type category due to its higher prevalence. Hospitals and specialty clinics represent the largest end-user segment, reflecting the significant role of healthcare institutions in ostomy care management. Growth in home care settings and ambulatory surgical centers is also observed, mirroring the trend toward increased outpatient procedures and patient preference for home-based care.
- Key Drivers (North America): High healthcare expenditure, advanced infrastructure, high prevalence of relevant diseases.
- Key Drivers (Europe): Growing healthcare awareness and adoption of advanced technologies.
- Dominant Product Type: Ostomy Bags
- Dominant Surgery Type: Colostomy
- Dominant End-User: Hospitals and Specialty Clinics
Ostomy Care Industry Product Landscape
The Ostomy Care product landscape is characterized by a range of innovations aimed at enhancing patient comfort, convenience, and safety. Ostomy bags are now available in a variety of designs, materials, and sizes, with features such as improved adhesives, odor control, and discreet profiles. Ostomy accessories, including skin barriers, pouches, and belts, have also undergone significant advancements, with a focus on hypoallergenic materials and improved adherence. Performance metrics such as seal strength, leak resistance, and skin irritation have witnessed notable improvements, contributing to heightened patient satisfaction and improved quality of life. Unique selling propositions now include the incorporation of advanced materials to reduce skin irritation, improved closure mechanisms for enhanced security, and user-friendly designs for easier application and removal.
Key Drivers, Barriers & Challenges in Ostomy Care Industry
Key Drivers: Technological advancements in materials and design, increasing prevalence of chronic diseases requiring ostomy surgery, growing awareness among patients, and rising healthcare expenditure. The launch of new products like Vitus Ostomy Care by HR Pharmaceuticals further exemplifies the push for innovation.
Key Challenges: High cost of ostomy care products can create access barriers for some patients. Stringent regulatory approvals pose challenges for new product launches. Supply chain disruptions, particularly those experienced during the recent pandemic, can impact product availability and pricing. Furthermore, intense competition among established players can pressure profit margins. The competitive landscape demands consistent innovation and effective marketing strategies for companies to maintain their market position.
Emerging Opportunities in Ostomy Care Industry
Emerging opportunities lie in the development of more discreet and comfortable ostomy products. Untapped markets exist in developing countries with rising healthcare expenditure. Innovative applications, such as telehealth and remote patient monitoring, can significantly enhance patient care and improve treatment outcomes. Evolving consumer preferences toward personalized solutions are also opening up new avenues for growth. Companies can cater to these needs by offering customized products and care plans.
Growth Accelerators in the Ostomy Care Industry
Technological breakthroughs, such as the development of OstomyCure's TIES implant, represent a significant growth accelerator. Strategic partnerships between manufacturers and healthcare providers can enhance market access and improve patient care. Expanding into emerging markets offers considerable growth potential. Investment in research and development is crucial for generating innovative products and improving existing offerings. Successful market penetration hinges on demonstrating value propositions based on comfort, convenience, and improved outcomes.
Key Players Shaping the Ostomy Care Industry Market
- Perma-Type Company Inc
- Coloplast A/S
- Cymed
- Braun Melsungen AG
- Nu-Hope Laboratories
- ConvaTec Group Plc
- Welland Medical Ltd
- Hollister Inc
- Marlen Manufacturing & Development Co
- ALCARE Co Ltd
- Torbot Group Inc
- Salts Healthcare
Notable Milestones in Ostomy Care Industry Sector
- January 2023: OstomyCure completes patient recruitment for its TIES implant clinical trial.
- February 2022: HR Pharmaceuticals launches Vitus Ostomy Care product line.
- January 2022: Owens & Minor acquires Apria Inc., expanding its ostomy portfolio.
In-Depth Ostomy Care Industry Market Outlook
The Ostomy Care market is poised for sustained growth, driven by an aging population and increasing prevalence of chronic diseases. Opportunities exist for companies to develop innovative and user-friendly products, leveraging technological advancements to improve patient outcomes and experiences. Strategic partnerships and expansion into emerging markets will be crucial for achieving long-term success within this dynamic sector. The focus on personalized solutions and improved patient engagement will further drive market expansion.
Ostomy Care Industry Segmentation
-
1. Product Type
- 1.1. Ostomy Bags
- 1.2. Ostomy Accessories
-
2. Surgery Type
- 2.1. Colostomy
- 2.2. Ileostomy
- 2.3. Urostomy
-
3. End User
- 3.1. Hospitals and Specialty clinics
- 3.2. Home care settings
- 3.3. Ambulatory Surgical Centers
Ostomy Care Industry Segmentation By Geography
-
1. North America
- 1.1. United States
- 1.2. Canada
- 1.3. Mexico
-
2. Europe
- 2.1. Germany
- 2.2. United Kingdom
- 2.3. France
- 2.4. Italy
- 2.5. Spain
- 2.6. Rest of Europe
-
3. Asia Pacific
- 3.1. China
- 3.2. Japan
- 3.3. India
- 3.4. Australia
- 3.5. South Korea
- 3.6. Rest of Asia Pacific
- 4. Middle East
-
5. GCC
- 5.1. South Africa
- 5.2. Rest of Middle East
-
6. South America
- 6.1. Brazil
- 6.2. Argentina
- 6.3. Rest of South America
Ostomy Care Industry REPORT HIGHLIGHTS
| Aspects | Details |
|---|---|
| Study Period | 2019-2033 |
| Base Year | 2024 |
| Estimated Year | 2025 |
| Forecast Period | 2025-2033 |
| Historical Period | 2019-2024 |
| Growth Rate | CAGR of 4.42% from 2019-2033 |
| Segmentation |
|
Table of Contents
- 1. Introduction
- 1.1. Research Scope
- 1.2. Market Segmentation
- 1.3. Research Methodology
- 1.4. Definitions and Assumptions
- 2. Executive Summary
- 2.1. Introduction
- 3. Market Dynamics
- 3.1. Introduction
- 3.2. Market Drivers
- 3.2.1. Growing Prevalence of Inflammatory Bowel Diseases; Technological Advancements in the Arena of Ostomy Care; Increase in Initiatives to Raise Ostomy Awareness
- 3.3. Market Restrains
- 3.3.1. Risk of Skin Irritation and Infections
- 3.4. Market Trends
- 3.4.1. Ostomy Bags Segment is Expected to Exhibit a Significant Market Growth Over the Forecast Period
- 4. Market Factor Analysis
- 4.1. Porters Five Forces
- 4.2. Supply/Value Chain
- 4.3. PESTEL analysis
- 4.4. Market Entropy
- 4.5. Patent/Trademark Analysis
- 5. Global Ostomy Care Industry Analysis, Insights and Forecast, 2019-2031
- 5.1. Market Analysis, Insights and Forecast - by Product Type
- 5.1.1. Ostomy Bags
- 5.1.2. Ostomy Accessories
- 5.2. Market Analysis, Insights and Forecast - by Surgery Type
- 5.2.1. Colostomy
- 5.2.2. Ileostomy
- 5.2.3. Urostomy
- 5.3. Market Analysis, Insights and Forecast - by End User
- 5.3.1. Hospitals and Specialty clinics
- 5.3.2. Home care settings
- 5.3.3. Ambulatory Surgical Centers
- 5.4. Market Analysis, Insights and Forecast - by Region
- 5.4.1. North America
- 5.4.2. Europe
- 5.4.3. Asia Pacific
- 5.4.4. Middle East
- 5.4.5. GCC
- 5.4.6. South America
- 5.1. Market Analysis, Insights and Forecast - by Product Type
- 6. North America Ostomy Care Industry Analysis, Insights and Forecast, 2019-2031
- 6.1. Market Analysis, Insights and Forecast - by Product Type
- 6.1.1. Ostomy Bags
- 6.1.2. Ostomy Accessories
- 6.2. Market Analysis, Insights and Forecast - by Surgery Type
- 6.2.1. Colostomy
- 6.2.2. Ileostomy
- 6.2.3. Urostomy
- 6.3. Market Analysis, Insights and Forecast - by End User
- 6.3.1. Hospitals and Specialty clinics
- 6.3.2. Home care settings
- 6.3.3. Ambulatory Surgical Centers
- 6.1. Market Analysis, Insights and Forecast - by Product Type
- 7. Europe Ostomy Care Industry Analysis, Insights and Forecast, 2019-2031
- 7.1. Market Analysis, Insights and Forecast - by Product Type
- 7.1.1. Ostomy Bags
- 7.1.2. Ostomy Accessories
- 7.2. Market Analysis, Insights and Forecast - by Surgery Type
- 7.2.1. Colostomy
- 7.2.2. Ileostomy
- 7.2.3. Urostomy
- 7.3. Market Analysis, Insights and Forecast - by End User
- 7.3.1. Hospitals and Specialty clinics
- 7.3.2. Home care settings
- 7.3.3. Ambulatory Surgical Centers
- 7.1. Market Analysis, Insights and Forecast - by Product Type
- 8. Asia Pacific Ostomy Care Industry Analysis, Insights and Forecast, 2019-2031
- 8.1. Market Analysis, Insights and Forecast - by Product Type
- 8.1.1. Ostomy Bags
- 8.1.2. Ostomy Accessories
- 8.2. Market Analysis, Insights and Forecast - by Surgery Type
- 8.2.1. Colostomy
- 8.2.2. Ileostomy
- 8.2.3. Urostomy
- 8.3. Market Analysis, Insights and Forecast - by End User
- 8.3.1. Hospitals and Specialty clinics
- 8.3.2. Home care settings
- 8.3.3. Ambulatory Surgical Centers
- 8.1. Market Analysis, Insights and Forecast - by Product Type
- 9. Middle East Ostomy Care Industry Analysis, Insights and Forecast, 2019-2031
- 9.1. Market Analysis, Insights and Forecast - by Product Type
- 9.1.1. Ostomy Bags
- 9.1.2. Ostomy Accessories
- 9.2. Market Analysis, Insights and Forecast - by Surgery Type
- 9.2.1. Colostomy
- 9.2.2. Ileostomy
- 9.2.3. Urostomy
- 9.3. Market Analysis, Insights and Forecast - by End User
- 9.3.1. Hospitals and Specialty clinics
- 9.3.2. Home care settings
- 9.3.3. Ambulatory Surgical Centers
- 9.1. Market Analysis, Insights and Forecast - by Product Type
- 10. GCC Ostomy Care Industry Analysis, Insights and Forecast, 2019-2031
- 10.1. Market Analysis, Insights and Forecast - by Product Type
- 10.1.1. Ostomy Bags
- 10.1.2. Ostomy Accessories
- 10.2. Market Analysis, Insights and Forecast - by Surgery Type
- 10.2.1. Colostomy
- 10.2.2. Ileostomy
- 10.2.3. Urostomy
- 10.3. Market Analysis, Insights and Forecast - by End User
- 10.3.1. Hospitals and Specialty clinics
- 10.3.2. Home care settings
- 10.3.3. Ambulatory Surgical Centers
- 10.1. Market Analysis, Insights and Forecast - by Product Type
- 11. South America Ostomy Care Industry Analysis, Insights and Forecast, 2019-2031
- 11.1. Market Analysis, Insights and Forecast - by Product Type
- 11.1.1. Ostomy Bags
- 11.1.2. Ostomy Accessories
- 11.2. Market Analysis, Insights and Forecast - by Surgery Type
- 11.2.1. Colostomy
- 11.2.2. Ileostomy
- 11.2.3. Urostomy
- 11.3. Market Analysis, Insights and Forecast - by End User
- 11.3.1. Hospitals and Specialty clinics
- 11.3.2. Home care settings
- 11.3.3. Ambulatory Surgical Centers
- 11.1. Market Analysis, Insights and Forecast - by Product Type
- 12. North America Ostomy Care Industry Analysis, Insights and Forecast, 2019-2031
- 12.1. Market Analysis, Insights and Forecast - By Country/Sub-region
- 12.1.1. undefined
- 13. Europe Ostomy Care Industry Analysis, Insights and Forecast, 2019-2031
- 13.1. Market Analysis, Insights and Forecast - By Country/Sub-region
- 13.1.1. undefined
- 14. Asia Pacific Ostomy Care Industry Analysis, Insights and Forecast, 2019-2031
- 14.1. Market Analysis, Insights and Forecast - By Country/Sub-region
- 14.1.1. undefined
- 15. Middle East Ostomy Care Industry Analysis, Insights and Forecast, 2019-2031
- 15.1. Market Analysis, Insights and Forecast - By Country/Sub-region
- 15.1.1. undefined
- 16. GCC Ostomy Care Industry Analysis, Insights and Forecast, 2019-2031
- 16.1. Market Analysis, Insights and Forecast - By Country/Sub-region
- 16.1.1. undefined
- 17. South America Ostomy Care Industry Analysis, Insights and Forecast, 2019-2031
- 17.1. Market Analysis, Insights and Forecast - By Country/Sub-region
- 17.1.1. undefined
- 18. Competitive Analysis
- 18.1. Global Market Share Analysis 2024
- 18.2. Company Profiles
- 18.2.1 Perma-Type Company Inc
- 18.2.1.1. Overview
- 18.2.1.2. Products
- 18.2.1.3. SWOT Analysis
- 18.2.1.4. Recent Developments
- 18.2.1.5. Financials (Based on Availability)
- 18.2.2 Coloplast A/S
- 18.2.2.1. Overview
- 18.2.2.2. Products
- 18.2.2.3. SWOT Analysis
- 18.2.2.4. Recent Developments
- 18.2.2.5. Financials (Based on Availability)
- 18.2.3 Cymed
- 18.2.3.1. Overview
- 18.2.3.2. Products
- 18.2.3.3. SWOT Analysis
- 18.2.3.4. Recent Developments
- 18.2.3.5. Financials (Based on Availability)
- 18.2.4 Braun Melsungen AG
- 18.2.4.1. Overview
- 18.2.4.2. Products
- 18.2.4.3. SWOT Analysis
- 18.2.4.4. Recent Developments
- 18.2.4.5. Financials (Based on Availability)
- 18.2.5 Nu-Hope Laboratories
- 18.2.5.1. Overview
- 18.2.5.2. Products
- 18.2.5.3. SWOT Analysis
- 18.2.5.4. Recent Developments
- 18.2.5.5. Financials (Based on Availability)
- 18.2.6 ConvaTec Group Plc
- 18.2.6.1. Overview
- 18.2.6.2. Products
- 18.2.6.3. SWOT Analysis
- 18.2.6.4. Recent Developments
- 18.2.6.5. Financials (Based on Availability)
- 18.2.7 Welland Medical Ltd
- 18.2.7.1. Overview
- 18.2.7.2. Products
- 18.2.7.3. SWOT Analysis
- 18.2.7.4. Recent Developments
- 18.2.7.5. Financials (Based on Availability)
- 18.2.8 Hollister Inc
- 18.2.8.1. Overview
- 18.2.8.2. Products
- 18.2.8.3. SWOT Analysis
- 18.2.8.4. Recent Developments
- 18.2.8.5. Financials (Based on Availability)
- 18.2.9 Marlen Manufacturing & Development Co
- 18.2.9.1. Overview
- 18.2.9.2. Products
- 18.2.9.3. SWOT Analysis
- 18.2.9.4. Recent Developments
- 18.2.9.5. Financials (Based on Availability)
- 18.2.10 ALCARE Co Ltd
- 18.2.10.1. Overview
- 18.2.10.2. Products
- 18.2.10.3. SWOT Analysis
- 18.2.10.4. Recent Developments
- 18.2.10.5. Financials (Based on Availability)
- 18.2.11 Torbot Group Inc
- 18.2.11.1. Overview
- 18.2.11.2. Products
- 18.2.11.3. SWOT Analysis
- 18.2.11.4. Recent Developments
- 18.2.11.5. Financials (Based on Availability)
- 18.2.12 Salts Healthcare
- 18.2.12.1. Overview
- 18.2.12.2. Products
- 18.2.12.3. SWOT Analysis
- 18.2.12.4. Recent Developments
- 18.2.12.5. Financials (Based on Availability)
- 18.2.1 Perma-Type Company Inc
List of Figures
- Figure 1: Global Ostomy Care Industry Revenue Breakdown (Million, %) by Region 2024 & 2032
- Figure 2: Global Ostomy Care Industry Volume Breakdown (K Unit, %) by Region 2024 & 2032
- Figure 3: North America Ostomy Care Industry Revenue (Million), by Country 2024 & 2032
- Figure 4: North America Ostomy Care Industry Volume (K Unit), by Country 2024 & 2032
- Figure 5: North America Ostomy Care Industry Revenue Share (%), by Country 2024 & 2032
- Figure 6: North America Ostomy Care Industry Volume Share (%), by Country 2024 & 2032
- Figure 7: Europe Ostomy Care Industry Revenue (Million), by Country 2024 & 2032
- Figure 8: Europe Ostomy Care Industry Volume (K Unit), by Country 2024 & 2032
- Figure 9: Europe Ostomy Care Industry Revenue Share (%), by Country 2024 & 2032
- Figure 10: Europe Ostomy Care Industry Volume Share (%), by Country 2024 & 2032
- Figure 11: Asia Pacific Ostomy Care Industry Revenue (Million), by Country 2024 & 2032
- Figure 12: Asia Pacific Ostomy Care Industry Volume (K Unit), by Country 2024 & 2032
- Figure 13: Asia Pacific Ostomy Care Industry Revenue Share (%), by Country 2024 & 2032
- Figure 14: Asia Pacific Ostomy Care Industry Volume Share (%), by Country 2024 & 2032
- Figure 15: Middle East Ostomy Care Industry Revenue (Million), by Country 2024 & 2032
- Figure 16: Middle East Ostomy Care Industry Volume (K Unit), by Country 2024 & 2032
- Figure 17: Middle East Ostomy Care Industry Revenue Share (%), by Country 2024 & 2032
- Figure 18: Middle East Ostomy Care Industry Volume Share (%), by Country 2024 & 2032
- Figure 19: GCC Ostomy Care Industry Revenue (Million), by Country 2024 & 2032
- Figure 20: GCC Ostomy Care Industry Volume (K Unit), by Country 2024 & 2032
- Figure 21: GCC Ostomy Care Industry Revenue Share (%), by Country 2024 & 2032
- Figure 22: GCC Ostomy Care Industry Volume Share (%), by Country 2024 & 2032
- Figure 23: South America Ostomy Care Industry Revenue (Million), by Country 2024 & 2032
- Figure 24: South America Ostomy Care Industry Volume (K Unit), by Country 2024 & 2032
- Figure 25: South America Ostomy Care Industry Revenue Share (%), by Country 2024 & 2032
- Figure 26: South America Ostomy Care Industry Volume Share (%), by Country 2024 & 2032
- Figure 27: North America Ostomy Care Industry Revenue (Million), by Product Type 2024 & 2032
- Figure 28: North America Ostomy Care Industry Volume (K Unit), by Product Type 2024 & 2032
- Figure 29: North America Ostomy Care Industry Revenue Share (%), by Product Type 2024 & 2032
- Figure 30: North America Ostomy Care Industry Volume Share (%), by Product Type 2024 & 2032
- Figure 31: North America Ostomy Care Industry Revenue (Million), by Surgery Type 2024 & 2032
- Figure 32: North America Ostomy Care Industry Volume (K Unit), by Surgery Type 2024 & 2032
- Figure 33: North America Ostomy Care Industry Revenue Share (%), by Surgery Type 2024 & 2032
- Figure 34: North America Ostomy Care Industry Volume Share (%), by Surgery Type 2024 & 2032
- Figure 35: North America Ostomy Care Industry Revenue (Million), by End User 2024 & 2032
- Figure 36: North America Ostomy Care Industry Volume (K Unit), by End User 2024 & 2032
- Figure 37: North America Ostomy Care Industry Revenue Share (%), by End User 2024 & 2032
- Figure 38: North America Ostomy Care Industry Volume Share (%), by End User 2024 & 2032
- Figure 39: North America Ostomy Care Industry Revenue (Million), by Country 2024 & 2032
- Figure 40: North America Ostomy Care Industry Volume (K Unit), by Country 2024 & 2032
- Figure 41: North America Ostomy Care Industry Revenue Share (%), by Country 2024 & 2032
- Figure 42: North America Ostomy Care Industry Volume Share (%), by Country 2024 & 2032
- Figure 43: Europe Ostomy Care Industry Revenue (Million), by Product Type 2024 & 2032
- Figure 44: Europe Ostomy Care Industry Volume (K Unit), by Product Type 2024 & 2032
- Figure 45: Europe Ostomy Care Industry Revenue Share (%), by Product Type 2024 & 2032
- Figure 46: Europe Ostomy Care Industry Volume Share (%), by Product Type 2024 & 2032
- Figure 47: Europe Ostomy Care Industry Revenue (Million), by Surgery Type 2024 & 2032
- Figure 48: Europe Ostomy Care Industry Volume (K Unit), by Surgery Type 2024 & 2032
- Figure 49: Europe Ostomy Care Industry Revenue Share (%), by Surgery Type 2024 & 2032
- Figure 50: Europe Ostomy Care Industry Volume Share (%), by Surgery Type 2024 & 2032
- Figure 51: Europe Ostomy Care Industry Revenue (Million), by End User 2024 & 2032
- Figure 52: Europe Ostomy Care Industry Volume (K Unit), by End User 2024 & 2032
- Figure 53: Europe Ostomy Care Industry Revenue Share (%), by End User 2024 & 2032
- Figure 54: Europe Ostomy Care Industry Volume Share (%), by End User 2024 & 2032
- Figure 55: Europe Ostomy Care Industry Revenue (Million), by Country 2024 & 2032
- Figure 56: Europe Ostomy Care Industry Volume (K Unit), by Country 2024 & 2032
- Figure 57: Europe Ostomy Care Industry Revenue Share (%), by Country 2024 & 2032
- Figure 58: Europe Ostomy Care Industry Volume Share (%), by Country 2024 & 2032
- Figure 59: Asia Pacific Ostomy Care Industry Revenue (Million), by Product Type 2024 & 2032
- Figure 60: Asia Pacific Ostomy Care Industry Volume (K Unit), by Product Type 2024 & 2032
- Figure 61: Asia Pacific Ostomy Care Industry Revenue Share (%), by Product Type 2024 & 2032
- Figure 62: Asia Pacific Ostomy Care Industry Volume Share (%), by Product Type 2024 & 2032
- Figure 63: Asia Pacific Ostomy Care Industry Revenue (Million), by Surgery Type 2024 & 2032
- Figure 64: Asia Pacific Ostomy Care Industry Volume (K Unit), by Surgery Type 2024 & 2032
- Figure 65: Asia Pacific Ostomy Care Industry Revenue Share (%), by Surgery Type 2024 & 2032
- Figure 66: Asia Pacific Ostomy Care Industry Volume Share (%), by Surgery Type 2024 & 2032
- Figure 67: Asia Pacific Ostomy Care Industry Revenue (Million), by End User 2024 & 2032
- Figure 68: Asia Pacific Ostomy Care Industry Volume (K Unit), by End User 2024 & 2032
- Figure 69: Asia Pacific Ostomy Care Industry Revenue Share (%), by End User 2024 & 2032
- Figure 70: Asia Pacific Ostomy Care Industry Volume Share (%), by End User 2024 & 2032
- Figure 71: Asia Pacific Ostomy Care Industry Revenue (Million), by Country 2024 & 2032
- Figure 72: Asia Pacific Ostomy Care Industry Volume (K Unit), by Country 2024 & 2032
- Figure 73: Asia Pacific Ostomy Care Industry Revenue Share (%), by Country 2024 & 2032
- Figure 74: Asia Pacific Ostomy Care Industry Volume Share (%), by Country 2024 & 2032
- Figure 75: Middle East Ostomy Care Industry Revenue (Million), by Product Type 2024 & 2032
- Figure 76: Middle East Ostomy Care Industry Volume (K Unit), by Product Type 2024 & 2032
- Figure 77: Middle East Ostomy Care Industry Revenue Share (%), by Product Type 2024 & 2032
- Figure 78: Middle East Ostomy Care Industry Volume Share (%), by Product Type 2024 & 2032
- Figure 79: Middle East Ostomy Care Industry Revenue (Million), by Surgery Type 2024 & 2032
- Figure 80: Middle East Ostomy Care Industry Volume (K Unit), by Surgery Type 2024 & 2032
- Figure 81: Middle East Ostomy Care Industry Revenue Share (%), by Surgery Type 2024 & 2032
- Figure 82: Middle East Ostomy Care Industry Volume Share (%), by Surgery Type 2024 & 2032
- Figure 83: Middle East Ostomy Care Industry Revenue (Million), by End User 2024 & 2032
- Figure 84: Middle East Ostomy Care Industry Volume (K Unit), by End User 2024 & 2032
- Figure 85: Middle East Ostomy Care Industry Revenue Share (%), by End User 2024 & 2032
- Figure 86: Middle East Ostomy Care Industry Volume Share (%), by End User 2024 & 2032
- Figure 87: Middle East Ostomy Care Industry Revenue (Million), by Country 2024 & 2032
- Figure 88: Middle East Ostomy Care Industry Volume (K Unit), by Country 2024 & 2032
- Figure 89: Middle East Ostomy Care Industry Revenue Share (%), by Country 2024 & 2032
- Figure 90: Middle East Ostomy Care Industry Volume Share (%), by Country 2024 & 2032
- Figure 91: GCC Ostomy Care Industry Revenue (Million), by Product Type 2024 & 2032
- Figure 92: GCC Ostomy Care Industry Volume (K Unit), by Product Type 2024 & 2032
- Figure 93: GCC Ostomy Care Industry Revenue Share (%), by Product Type 2024 & 2032
- Figure 94: GCC Ostomy Care Industry Volume Share (%), by Product Type 2024 & 2032
- Figure 95: GCC Ostomy Care Industry Revenue (Million), by Surgery Type 2024 & 2032
- Figure 96: GCC Ostomy Care Industry Volume (K Unit), by Surgery Type 2024 & 2032
- Figure 97: GCC Ostomy Care Industry Revenue Share (%), by Surgery Type 2024 & 2032
- Figure 98: GCC Ostomy Care Industry Volume Share (%), by Surgery Type 2024 & 2032
- Figure 99: GCC Ostomy Care Industry Revenue (Million), by End User 2024 & 2032
- Figure 100: GCC Ostomy Care Industry Volume (K Unit), by End User 2024 & 2032
- Figure 101: GCC Ostomy Care Industry Revenue Share (%), by End User 2024 & 2032
- Figure 102: GCC Ostomy Care Industry Volume Share (%), by End User 2024 & 2032
- Figure 103: GCC Ostomy Care Industry Revenue (Million), by Country 2024 & 2032
- Figure 104: GCC Ostomy Care Industry Volume (K Unit), by Country 2024 & 2032
- Figure 105: GCC Ostomy Care Industry Revenue Share (%), by Country 2024 & 2032
- Figure 106: GCC Ostomy Care Industry Volume Share (%), by Country 2024 & 2032
- Figure 107: South America Ostomy Care Industry Revenue (Million), by Product Type 2024 & 2032
- Figure 108: South America Ostomy Care Industry Volume (K Unit), by Product Type 2024 & 2032
- Figure 109: South America Ostomy Care Industry Revenue Share (%), by Product Type 2024 & 2032
- Figure 110: South America Ostomy Care Industry Volume Share (%), by Product Type 2024 & 2032
- Figure 111: South America Ostomy Care Industry Revenue (Million), by Surgery Type 2024 & 2032
- Figure 112: South America Ostomy Care Industry Volume (K Unit), by Surgery Type 2024 & 2032
- Figure 113: South America Ostomy Care Industry Revenue Share (%), by Surgery Type 2024 & 2032
- Figure 114: South America Ostomy Care Industry Volume Share (%), by Surgery Type 2024 & 2032
- Figure 115: South America Ostomy Care Industry Revenue (Million), by End User 2024 & 2032
- Figure 116: South America Ostomy Care Industry Volume (K Unit), by End User 2024 & 2032
- Figure 117: South America Ostomy Care Industry Revenue Share (%), by End User 2024 & 2032
- Figure 118: South America Ostomy Care Industry Volume Share (%), by End User 2024 & 2032
- Figure 119: South America Ostomy Care Industry Revenue (Million), by Country 2024 & 2032
- Figure 120: South America Ostomy Care Industry Volume (K Unit), by Country 2024 & 2032
- Figure 121: South America Ostomy Care Industry Revenue Share (%), by Country 2024 & 2032
- Figure 122: South America Ostomy Care Industry Volume Share (%), by Country 2024 & 2032
List of Tables
- Table 1: Global Ostomy Care Industry Revenue Million Forecast, by Region 2019 & 2032
- Table 2: Global Ostomy Care Industry Volume K Unit Forecast, by Region 2019 & 2032
- Table 3: Global Ostomy Care Industry Revenue Million Forecast, by Product Type 2019 & 2032
- Table 4: Global Ostomy Care Industry Volume K Unit Forecast, by Product Type 2019 & 2032
- Table 5: Global Ostomy Care Industry Revenue Million Forecast, by Surgery Type 2019 & 2032
- Table 6: Global Ostomy Care Industry Volume K Unit Forecast, by Surgery Type 2019 & 2032
- Table 7: Global Ostomy Care Industry Revenue Million Forecast, by End User 2019 & 2032
- Table 8: Global Ostomy Care Industry Volume K Unit Forecast, by End User 2019 & 2032
- Table 9: Global Ostomy Care Industry Revenue Million Forecast, by Region 2019 & 2032
- Table 10: Global Ostomy Care Industry Volume K Unit Forecast, by Region 2019 & 2032
- Table 11: Global Ostomy Care Industry Revenue Million Forecast, by Country 2019 & 2032
- Table 12: Global Ostomy Care Industry Volume K Unit Forecast, by Country 2019 & 2032
- Table 13: Global Ostomy Care Industry Revenue Million Forecast, by Country 2019 & 2032
- Table 14: Global Ostomy Care Industry Volume K Unit Forecast, by Country 2019 & 2032
- Table 15: Global Ostomy Care Industry Revenue Million Forecast, by Country 2019 & 2032
- Table 16: Global Ostomy Care Industry Volume K Unit Forecast, by Country 2019 & 2032
- Table 17: Global Ostomy Care Industry Revenue Million Forecast, by Country 2019 & 2032
- Table 18: Global Ostomy Care Industry Volume K Unit Forecast, by Country 2019 & 2032
- Table 19: Global Ostomy Care Industry Revenue Million Forecast, by Country 2019 & 2032
- Table 20: Global Ostomy Care Industry Volume K Unit Forecast, by Country 2019 & 2032
- Table 21: Global Ostomy Care Industry Revenue Million Forecast, by Country 2019 & 2032
- Table 22: Global Ostomy Care Industry Volume K Unit Forecast, by Country 2019 & 2032
- Table 23: Global Ostomy Care Industry Revenue Million Forecast, by Product Type 2019 & 2032
- Table 24: Global Ostomy Care Industry Volume K Unit Forecast, by Product Type 2019 & 2032
- Table 25: Global Ostomy Care Industry Revenue Million Forecast, by Surgery Type 2019 & 2032
- Table 26: Global Ostomy Care Industry Volume K Unit Forecast, by Surgery Type 2019 & 2032
- Table 27: Global Ostomy Care Industry Revenue Million Forecast, by End User 2019 & 2032
- Table 28: Global Ostomy Care Industry Volume K Unit Forecast, by End User 2019 & 2032
- Table 29: Global Ostomy Care Industry Revenue Million Forecast, by Country 2019 & 2032
- Table 30: Global Ostomy Care Industry Volume K Unit Forecast, by Country 2019 & 2032
- Table 31: United States Ostomy Care Industry Revenue (Million) Forecast, by Application 2019 & 2032
- Table 32: United States Ostomy Care Industry Volume (K Unit) Forecast, by Application 2019 & 2032
- Table 33: Canada Ostomy Care Industry Revenue (Million) Forecast, by Application 2019 & 2032
- Table 34: Canada Ostomy Care Industry Volume (K Unit) Forecast, by Application 2019 & 2032
- Table 35: Mexico Ostomy Care Industry Revenue (Million) Forecast, by Application 2019 & 2032
- Table 36: Mexico Ostomy Care Industry Volume (K Unit) Forecast, by Application 2019 & 2032
- Table 37: Global Ostomy Care Industry Revenue Million Forecast, by Product Type 2019 & 2032
- Table 38: Global Ostomy Care Industry Volume K Unit Forecast, by Product Type 2019 & 2032
- Table 39: Global Ostomy Care Industry Revenue Million Forecast, by Surgery Type 2019 & 2032
- Table 40: Global Ostomy Care Industry Volume K Unit Forecast, by Surgery Type 2019 & 2032
- Table 41: Global Ostomy Care Industry Revenue Million Forecast, by End User 2019 & 2032
- Table 42: Global Ostomy Care Industry Volume K Unit Forecast, by End User 2019 & 2032
- Table 43: Global Ostomy Care Industry Revenue Million Forecast, by Country 2019 & 2032
- Table 44: Global Ostomy Care Industry Volume K Unit Forecast, by Country 2019 & 2032
- Table 45: Germany Ostomy Care Industry Revenue (Million) Forecast, by Application 2019 & 2032
- Table 46: Germany Ostomy Care Industry Volume (K Unit) Forecast, by Application 2019 & 2032
- Table 47: United Kingdom Ostomy Care Industry Revenue (Million) Forecast, by Application 2019 & 2032
- Table 48: United Kingdom Ostomy Care Industry Volume (K Unit) Forecast, by Application 2019 & 2032
- Table 49: France Ostomy Care Industry Revenue (Million) Forecast, by Application 2019 & 2032
- Table 50: France Ostomy Care Industry Volume (K Unit) Forecast, by Application 2019 & 2032
- Table 51: Italy Ostomy Care Industry Revenue (Million) Forecast, by Application 2019 & 2032
- Table 52: Italy Ostomy Care Industry Volume (K Unit) Forecast, by Application 2019 & 2032
- Table 53: Spain Ostomy Care Industry Revenue (Million) Forecast, by Application 2019 & 2032
- Table 54: Spain Ostomy Care Industry Volume (K Unit) Forecast, by Application 2019 & 2032
- Table 55: Rest of Europe Ostomy Care Industry Revenue (Million) Forecast, by Application 2019 & 2032
- Table 56: Rest of Europe Ostomy Care Industry Volume (K Unit) Forecast, by Application 2019 & 2032
- Table 57: Global Ostomy Care Industry Revenue Million Forecast, by Product Type 2019 & 2032
- Table 58: Global Ostomy Care Industry Volume K Unit Forecast, by Product Type 2019 & 2032
- Table 59: Global Ostomy Care Industry Revenue Million Forecast, by Surgery Type 2019 & 2032
- Table 60: Global Ostomy Care Industry Volume K Unit Forecast, by Surgery Type 2019 & 2032
- Table 61: Global Ostomy Care Industry Revenue Million Forecast, by End User 2019 & 2032
- Table 62: Global Ostomy Care Industry Volume K Unit Forecast, by End User 2019 & 2032
- Table 63: Global Ostomy Care Industry Revenue Million Forecast, by Country 2019 & 2032
- Table 64: Global Ostomy Care Industry Volume K Unit Forecast, by Country 2019 & 2032
- Table 65: China Ostomy Care Industry Revenue (Million) Forecast, by Application 2019 & 2032
- Table 66: China Ostomy Care Industry Volume (K Unit) Forecast, by Application 2019 & 2032
- Table 67: Japan Ostomy Care Industry Revenue (Million) Forecast, by Application 2019 & 2032
- Table 68: Japan Ostomy Care Industry Volume (K Unit) Forecast, by Application 2019 & 2032
- Table 69: India Ostomy Care Industry Revenue (Million) Forecast, by Application 2019 & 2032
- Table 70: India Ostomy Care Industry Volume (K Unit) Forecast, by Application 2019 & 2032
- Table 71: Australia Ostomy Care Industry Revenue (Million) Forecast, by Application 2019 & 2032
- Table 72: Australia Ostomy Care Industry Volume (K Unit) Forecast, by Application 2019 & 2032
- Table 73: South Korea Ostomy Care Industry Revenue (Million) Forecast, by Application 2019 & 2032
- Table 74: South Korea Ostomy Care Industry Volume (K Unit) Forecast, by Application 2019 & 2032
- Table 75: Rest of Asia Pacific Ostomy Care Industry Revenue (Million) Forecast, by Application 2019 & 2032
- Table 76: Rest of Asia Pacific Ostomy Care Industry Volume (K Unit) Forecast, by Application 2019 & 2032
- Table 77: Global Ostomy Care Industry Revenue Million Forecast, by Product Type 2019 & 2032
- Table 78: Global Ostomy Care Industry Volume K Unit Forecast, by Product Type 2019 & 2032
- Table 79: Global Ostomy Care Industry Revenue Million Forecast, by Surgery Type 2019 & 2032
- Table 80: Global Ostomy Care Industry Volume K Unit Forecast, by Surgery Type 2019 & 2032
- Table 81: Global Ostomy Care Industry Revenue Million Forecast, by End User 2019 & 2032
- Table 82: Global Ostomy Care Industry Volume K Unit Forecast, by End User 2019 & 2032
- Table 83: Global Ostomy Care Industry Revenue Million Forecast, by Country 2019 & 2032
- Table 84: Global Ostomy Care Industry Volume K Unit Forecast, by Country 2019 & 2032
- Table 85: Global Ostomy Care Industry Revenue Million Forecast, by Product Type 2019 & 2032
- Table 86: Global Ostomy Care Industry Volume K Unit Forecast, by Product Type 2019 & 2032
- Table 87: Global Ostomy Care Industry Revenue Million Forecast, by Surgery Type 2019 & 2032
- Table 88: Global Ostomy Care Industry Volume K Unit Forecast, by Surgery Type 2019 & 2032
- Table 89: Global Ostomy Care Industry Revenue Million Forecast, by End User 2019 & 2032
- Table 90: Global Ostomy Care Industry Volume K Unit Forecast, by End User 2019 & 2032
- Table 91: Global Ostomy Care Industry Revenue Million Forecast, by Country 2019 & 2032
- Table 92: Global Ostomy Care Industry Volume K Unit Forecast, by Country 2019 & 2032
- Table 93: South Africa Ostomy Care Industry Revenue (Million) Forecast, by Application 2019 & 2032
- Table 94: South Africa Ostomy Care Industry Volume (K Unit) Forecast, by Application 2019 & 2032
- Table 95: Rest of Middle East Ostomy Care Industry Revenue (Million) Forecast, by Application 2019 & 2032
- Table 96: Rest of Middle East Ostomy Care Industry Volume (K Unit) Forecast, by Application 2019 & 2032
- Table 97: Global Ostomy Care Industry Revenue Million Forecast, by Product Type 2019 & 2032
- Table 98: Global Ostomy Care Industry Volume K Unit Forecast, by Product Type 2019 & 2032
- Table 99: Global Ostomy Care Industry Revenue Million Forecast, by Surgery Type 2019 & 2032
- Table 100: Global Ostomy Care Industry Volume K Unit Forecast, by Surgery Type 2019 & 2032
- Table 101: Global Ostomy Care Industry Revenue Million Forecast, by End User 2019 & 2032
- Table 102: Global Ostomy Care Industry Volume K Unit Forecast, by End User 2019 & 2032
- Table 103: Global Ostomy Care Industry Revenue Million Forecast, by Country 2019 & 2032
- Table 104: Global Ostomy Care Industry Volume K Unit Forecast, by Country 2019 & 2032
- Table 105: Brazil Ostomy Care Industry Revenue (Million) Forecast, by Application 2019 & 2032
- Table 106: Brazil Ostomy Care Industry Volume (K Unit) Forecast, by Application 2019 & 2032
- Table 107: Argentina Ostomy Care Industry Revenue (Million) Forecast, by Application 2019 & 2032
- Table 108: Argentina Ostomy Care Industry Volume (K Unit) Forecast, by Application 2019 & 2032
- Table 109: Rest of South America Ostomy Care Industry Revenue (Million) Forecast, by Application 2019 & 2032
- Table 110: Rest of South America Ostomy Care Industry Volume (K Unit) Forecast, by Application 2019 & 2032
Frequently Asked Questions
1. What is the projected Compound Annual Growth Rate (CAGR) of the Ostomy Care Industry?
The projected CAGR is approximately 4.42%.
2. Which companies are prominent players in the Ostomy Care Industry?
Key companies in the market include Perma-Type Company Inc, Coloplast A/S, Cymed, Braun Melsungen AG, Nu-Hope Laboratories, ConvaTec Group Plc, Welland Medical Ltd, Hollister Inc, Marlen Manufacturing & Development Co, ALCARE Co Ltd, Torbot Group Inc, Salts Healthcare.
3. What are the main segments of the Ostomy Care Industry?
The market segments include Product Type, Surgery Type, End User.
4. Can you provide details about the market size?
The market size is estimated to be USD 3.32 Million as of 2022.
5. What are some drivers contributing to market growth?
Growing Prevalence of Inflammatory Bowel Diseases; Technological Advancements in the Arena of Ostomy Care; Increase in Initiatives to Raise Ostomy Awareness.
6. What are the notable trends driving market growth?
Ostomy Bags Segment is Expected to Exhibit a Significant Market Growth Over the Forecast Period.
7. Are there any restraints impacting market growth?
Risk of Skin Irritation and Infections.
8. Can you provide examples of recent developments in the market?
January 2023: OstomyCure, announced the complete patient recruitment milestone in the clinical trial its proprietary innovative titanium port TI,ES implant technology. TIES is an innovative titanium port implant that can be implanted within the stoma and attached to a lid to effectively close and open the stoma.
9. What pricing options are available for accessing the report?
Pricing options include single-user, multi-user, and enterprise licenses priced at USD 4750, USD 5250, and USD 8750 respectively.
10. Is the market size provided in terms of value or volume?
The market size is provided in terms of value, measured in Million and volume, measured in K Unit.
11. Are there any specific market keywords associated with the report?
Yes, the market keyword associated with the report is "Ostomy Care Industry," which aids in identifying and referencing the specific market segment covered.
12. How do I determine which pricing option suits my needs best?
The pricing options vary based on user requirements and access needs. Individual users may opt for single-user licenses, while businesses requiring broader access may choose multi-user or enterprise licenses for cost-effective access to the report.
13. Are there any additional resources or data provided in the Ostomy Care Industry report?
While the report offers comprehensive insights, it's advisable to review the specific contents or supplementary materials provided to ascertain if additional resources or data are available.
14. How can I stay updated on further developments or reports in the Ostomy Care Industry?
To stay informed about further developments, trends, and reports in the Ostomy Care Industry, consider subscribing to industry newsletters, following relevant companies and organizations, or regularly checking reputable industry news sources and publications.
Methodology
Step 1 - Identification of Relevant Samples Size from Population Database


Step 2 - Approaches for Defining Global Market Size (Value, Volume* & Price*)

Note*: In applicable scenarios
Step 3 - Data Sources
Primary Research
- Web Analytics
- Survey Reports
- Research Institute
- Latest Research Reports
- Opinion Leaders
Secondary Research
- Annual Reports
- White Paper
- Latest Press Release
- Industry Association
- Paid Database
- Investor Presentations

Step 4 - Data Triangulation
Involves using different sources of information in order to increase the validity of a study
These sources are likely to be stakeholders in a program - participants, other researchers, program staff, other community members, and so on.
Then we put all data in single framework & apply various statistical tools to find out the dynamic on the market.
During the analysis stage, feedback from the stakeholder groups would be compared to determine areas of agreement as well as areas of divergence


