
Key Insights
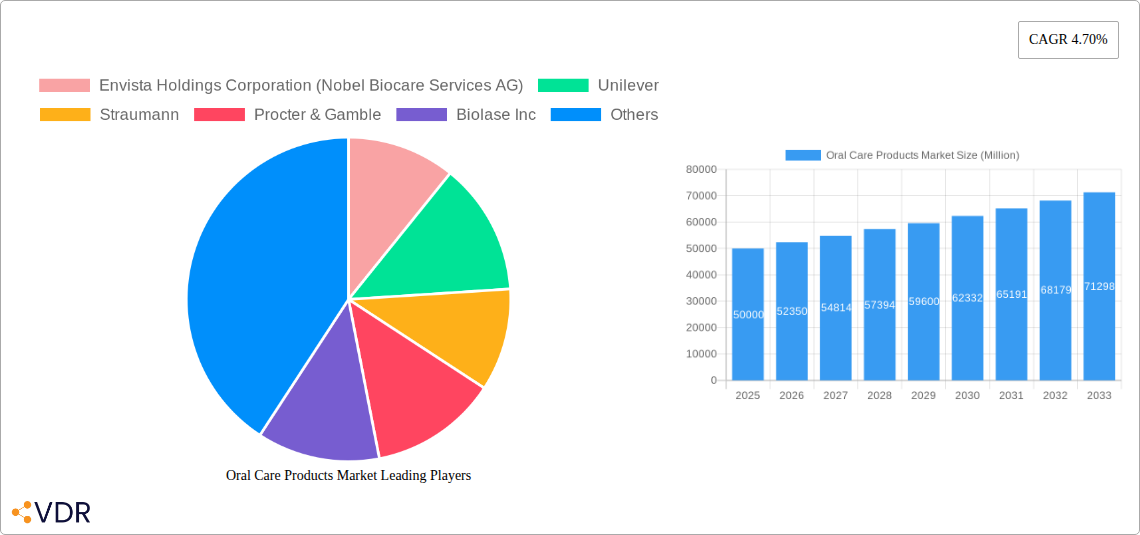
The global oral care products market, valued at approximately $XX million in 2025, is projected to experience robust growth, exhibiting a compound annual growth rate (CAGR) of 4.70% from 2025 to 2033. This expansion is driven by several key factors. Rising awareness of oral hygiene and its link to overall health is fueling demand for preventative products like toothbrushes, toothpaste, and mouthwash. The increasing prevalence of dental diseases, coupled with an aging population requiring more specialized care, contributes significantly to market growth. Technological advancements in dental procedures and materials, such as the widespread adoption of CAD/CAM technology in dental labs and the increasing use of advanced imaging techniques like CBCT, are further stimulating market expansion. The burgeoning middle class in developing economies, particularly in Asia-Pacific, is also a key driver, as increased disposable income translates to higher spending on oral care. However, the market faces some restraints, including the high cost of advanced dental treatments and materials, which can limit accessibility for certain segments of the population. Furthermore, the presence of numerous established players leads to intense competition, potentially impacting profit margins for individual companies.
Market segmentation reveals significant opportunities within various sub-sectors. The dental biomaterials segment, encompassing bone grafts and tissue regenerative materials, is anticipated to experience rapid growth due to the increasing demand for minimally invasive dental procedures and restorative dentistry. Similarly, the oral imaging segment benefits from technological innovation, with digital radiography and CBCT becoming increasingly prevalent in dental practices. The dental hygiene segment, which includes a wide range of everyday products, remains a significant revenue generator, benefiting from consistent demand and the introduction of innovative formulations with enhanced functionalities. The orthodontics and periodontics segments are also poised for growth driven by the rising prevalence of malocclusion and periodontal diseases, respectively. Geographic analysis shows strong performance in North America and Europe, driven by high healthcare spending and advanced dental infrastructure, while the Asia-Pacific region is anticipated to witness substantial growth fueled by rising disposable incomes and improved dental awareness. The competitive landscape is dominated by established multinational corporations, but smaller, specialized firms are also contributing to innovation and market growth.
This comprehensive report provides a detailed analysis of the Oral Care Products Market, encompassing its dynamics, growth trends, regional dominance, product landscape, key challenges, emerging opportunities, and key players. The report covers the period from 2019 to 2033, with 2025 serving as the base year and the forecast period spanning from 2025 to 2033. The market is segmented into key areas including Dental Biomaterials, Oral Imaging, Dental Hygiene, Lab Equipment, Orthodontics, Periodontics, Endodontics, and Dental Prosthetics. The total market size is projected to reach xx Million units by 2033.
Oral Care Products Market Dynamics & Structure
The Oral Care Products market is characterized by a moderately concentrated landscape, with key players like Colgate-Palmolive, Procter & Gamble, and Johnson & Johnson holding significant market share. Technological innovation, particularly in digital dentistry (e.g., CAD/CAM, intraoral scanners), is a major driver, alongside increasing awareness of oral health and rising disposable incomes in emerging markets. Stringent regulatory frameworks governing product safety and efficacy influence market dynamics. The market witnesses considerable M&A activity, as larger companies seek to expand their product portfolios and geographic reach. Competitive substitutes include traditional remedies and over-the-counter products. The end-user demographics are diverse, spanning from children to elderly populations, each with specific oral care needs.
- Market Concentration: Moderately concentrated, with top 5 players holding approximately xx% market share in 2025.
- Technological Innovation: Significant advancements in digital dentistry, materials science, and minimally invasive procedures.
- Regulatory Frameworks: Stringent regulations regarding product safety and efficacy, varying across regions.
- Competitive Substitutes: Traditional remedies, herbal products, and over-the-counter solutions pose a competitive challenge.
- End-User Demographics: Diverse demographic profile, with varying needs across age groups and socioeconomic strata.
- M&A Activity: High M&A activity observed in the historical period (2019-2024), with xx major deals recorded. The trend is expected to continue.
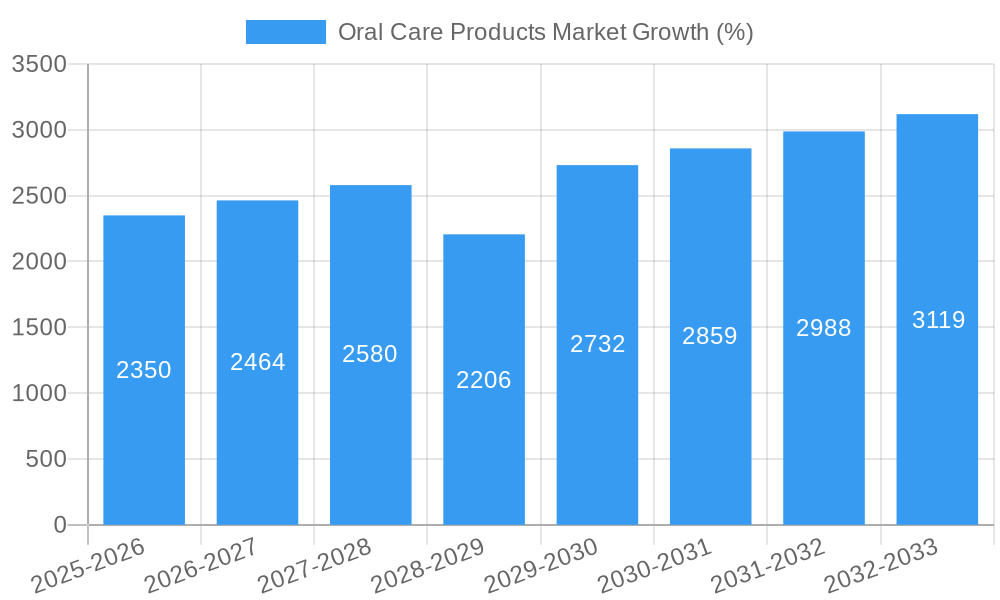
Oral Care Products Market Growth Trends & Insights
The Oral Care Products market exhibits robust growth, driven by factors such as increasing awareness of oral hygiene, technological advancements, and the rising prevalence of oral diseases. The market size grew from xx Million units in 2019 to xx Million units in 2024, registering a CAGR of xx% during the historical period. Adoption rates for advanced dental technologies, such as CBCT scanning and dental implants, are increasing steadily. Consumer behaviour is shifting towards premium and specialized oral care products, such as whitening products and electric toothbrushes. Disruptive technologies, including AI-powered diagnostic tools and personalized oral care solutions, are poised to further accelerate market growth in the forecast period. The market is expected to reach xx Million units by 2033, with a projected CAGR of xx% during the forecast period (2025-2033). Market penetration rates for specific product segments (e.g., electric toothbrushes) are projected to increase significantly by 2033.
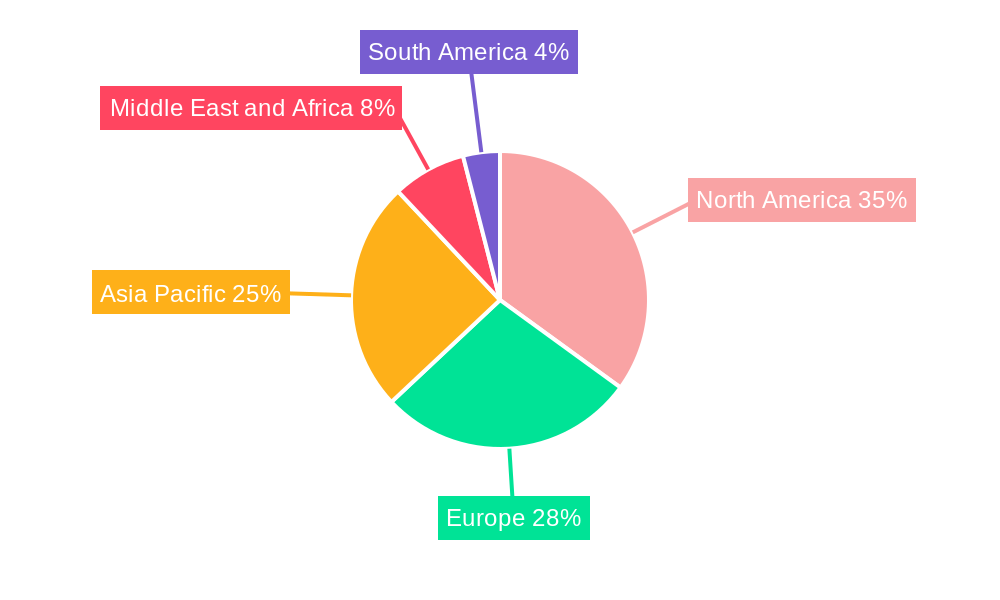
Dominant Regions, Countries, or Segments in Oral Care Products Market
North America and Europe currently dominate the Oral Care Products market, driven by high per capita spending on oral care, advanced healthcare infrastructure, and a high prevalence of dental diseases. However, Asia Pacific is poised for significant growth, fuelled by rising disposable incomes, improving healthcare access, and a growing middle class. Within segments, Dental Hygiene products (toothpaste, toothbrush, mouthwash) contribute the largest share, followed by Dental Prosthetics (implants, dentures). The Dental Biomaterials segment is expected to experience substantial growth, driven by an increasing demand for bone grafts and tissue regenerative materials.
- Key Regional Drivers:
- North America: High per capita expenditure, advanced dental infrastructure.
- Europe: Well-established healthcare systems, high awareness of oral health.
- Asia Pacific: Rapid economic growth, rising disposable incomes, and growing middle class.
- Leading Segments:
- Dental Hygiene: Largest market share, driven by high consumption of everyday products.
- Dental Prosthetics: Significant growth driven by aging population and increased demand for implants.
- Dental Biomaterials: Rapid growth projected due to advancements in regenerative dentistry.
Oral Care Products Market Product Landscape
The Oral Care Products market showcases continuous innovation, with new products featuring advanced formulations, improved efficacy, and enhanced user experience. Toothpastes with specialized functionalities (e.g., whitening, sensitivity relief) are gaining popularity. Electric toothbrushes with smart features and advanced brushing techniques are experiencing strong adoption. Dental implants are becoming increasingly sophisticated, with improved biocompatibility and longevity. The introduction of novel biomaterials promises to revolutionize dental procedures. Unique selling propositions increasingly focus on personalization, convenience, and improved outcomes.
Key Drivers, Barriers & Challenges in Oral Care Products Market
Key Drivers:
- Rising prevalence of oral diseases (e.g., periodontal disease, caries)
- Increasing awareness of oral hygiene and its impact on overall health
- Technological advancements in materials science and digital dentistry
- Growing demand for aesthetic dentistry and cosmetic procedures
- Favorable regulatory environment in several regions.
Key Challenges:
- High cost of advanced dental procedures and technologies, limiting accessibility in certain markets.
- Stringent regulatory approvals impacting product launch timelines.
- Intense competition among established players and emerging market entrants.
- Supply chain disruptions affecting raw material availability and product pricing.
- Fluctuations in raw material prices.
Emerging Opportunities in Oral Care Products Market
- Growing demand for personalized oral care solutions tailored to individual needs
- Expansion into untapped markets in developing economies
- Development of innovative materials with improved biocompatibility and functionality
- Growing adoption of teledentistry and remote oral health monitoring.
- Integration of AI and machine learning in diagnostics and treatment planning.
Growth Accelerators in the Oral Care Products Market Industry
Technological breakthroughs in materials science and digital dentistry are key growth catalysts. Strategic partnerships between dental professionals and manufacturers facilitate the development and adoption of innovative products and technologies. Market expansion into underserved regions presents significant opportunities for growth. The increasing focus on preventive oral care and early disease detection is further driving market growth.
Key Players Shaping the Oral Care Products Market Market
- Envista Holdings Corporation (Nobel Biocare Services AG)
- Unilever
- Straumann
- Procter & Gamble
- Biolase Inc
- 3M
- Dentsply Sirona
- Colgate-Palmolive Company
- Carestream Health
- GC Corporation
- GlaxoSmithKline
- Johnson & Johnson
Notable Milestones in Oral Care Products Market Sector
- August 2022: Firmline launched India's first oral care range for pregnant women, introducing a toothpaste and mouthwash designed to protect and improve oral health during pregnancy. This addresses a niche market and indicates growing attention to specialized oral care products.
- June 2022: Ivoclar launched VivaScan, a portable intraoral scanning solution, simplifying digital dentistry workflows and improving efficiency in dental practices. This highlights the ongoing trend towards digitalization in the sector.
In-Depth Oral Care Products Market Market Outlook
The Oral Care Products market is poised for sustained growth, driven by a confluence of factors including technological innovation, increasing awareness of oral health, and expanding access to dental care. Strategic investments in research and development, along with strategic partnerships, will further propel market expansion. Emerging markets present substantial opportunities for growth, while the development of personalized and preventative oral care solutions will redefine the market landscape. The market is expected to witness a significant increase in market size and adoption rates for advanced technologies in the coming years.
Oral Care Products Market Segmentation
-
1. Dental Prosthetics
- 1.1. Dental Implants and Abutments
- 1.2. Titanium Implants
- 1.3. Zirconium Implants
- 1.4. Dentures
- 1.5. Crown
- 1.6. Other Dental Prosthetics
-
2. Dental Biomaterial
- 2.1. Dental Bone Grafts
- 2.2. Tissue Regenerative Materials
- 2.3. Other Dental Biomaterials
-
3. Oral Imaging
- 3.1. Oral X-ray
- 3.2. Dental CBCT
- 3.3. Dental Optical Imaging
- 3.4. Other Oral Imaging Types
-
4. Dental Hygiene
- 4.1. Mouthwash/Dental Rinse
- 4.2. Dental Accessories
- 4.3. Dental Bleaching/Whitening Products
- 4.4. Toothbrush
- 4.5. Toothpaste
- 4.6. Other Dental Hygiene Products
-
5. Lab Equipment
- 5.1. CAD/CAM
- 5.2. Other Lab Equipment
-
6. Orthodontics
- 6.1. Fixed Braces
- 6.2. Removable Braces
-
7. Periodontics
- 7.1. Dental Anesthetics
- 7.2. Dental Hemostats
- 7.3. Dental Sutures
-
8. Endodontics
- 8.1. Endodotics Files
- 8.2. Obturators
- 8.3. Permanent Endodontic Sealers
Oral Care Products Market Segmentation By Geography
-
1. North America
- 1.1. United States
- 1.2. Canada
- 1.3. Mexico
-
2. Europe
- 2.1. Germany
- 2.2. United Kingdom
- 2.3. France
- 2.4. Italy
- 2.5. Spain
- 2.6. Rest of Europe
-
3. Asia Pacific
- 3.1. China
- 3.2. Japan
- 3.3. India
- 3.4. Australia
- 3.5. South Korea
- 3.6. Rest of Asia Pacific
-
4. Middle East and Africa
- 4.1. GCC
- 4.2. South Africa
- 4.3. Rest of Middle East and Africa
-
5. South America
- 5.1. Brazil
- 5.2. Argentina
- 5.3. Rest of South America
Oral Care Products Market REPORT HIGHLIGHTS
| Aspects | Details |
|---|---|
| Study Period | 2019-2033 |
| Base Year | 2024 |
| Estimated Year | 2025 |
| Forecast Period | 2025-2033 |
| Historical Period | 2019-2024 |
| Growth Rate | CAGR of 4.70% from 2019-2033 |
| Segmentation |
|
Table of Contents
- 1. Introduction
- 1.1. Research Scope
- 1.2. Market Segmentation
- 1.3. Research Methodology
- 1.4. Definitions and Assumptions
- 2. Executive Summary
- 2.1. Introduction
- 3. Market Dynamics
- 3.1. Introduction
- 3.2. Market Drivers
- 3.2.1. Rising Geriatric Population and Burden of Dental Diseases; Innovation in Technology Introducing Improved Product Varieties; Rising Oral Care Problems Among Children Due to Poor Eating Habits
- 3.3. Market Restrains
- 3.3.1. Economic Slowdown Affecting Consumer Purchasing Behavior
- 3.4. Market Trends
- 3.4.1. Titanium Implants Segment is Expected to Witness Considerable Growth Over the Forecast Period
- 4. Market Factor Analysis
- 4.1. Porters Five Forces
- 4.2. Supply/Value Chain
- 4.3. PESTEL analysis
- 4.4. Market Entropy
- 4.5. Patent/Trademark Analysis
- 5. Global Oral Care Products Market Analysis, Insights and Forecast, 2019-2031
- 5.1. Market Analysis, Insights and Forecast - by Dental Prosthetics
- 5.1.1. Dental Implants and Abutments
- 5.1.2. Titanium Implants
- 5.1.3. Zirconium Implants
- 5.1.4. Dentures
- 5.1.5. Crown
- 5.1.6. Other Dental Prosthetics
- 5.2. Market Analysis, Insights and Forecast - by Dental Biomaterial
- 5.2.1. Dental Bone Grafts
- 5.2.2. Tissue Regenerative Materials
- 5.2.3. Other Dental Biomaterials
- 5.3. Market Analysis, Insights and Forecast - by Oral Imaging
- 5.3.1. Oral X-ray
- 5.3.2. Dental CBCT
- 5.3.3. Dental Optical Imaging
- 5.3.4. Other Oral Imaging Types
- 5.4. Market Analysis, Insights and Forecast - by Dental Hygiene
- 5.4.1. Mouthwash/Dental Rinse
- 5.4.2. Dental Accessories
- 5.4.3. Dental Bleaching/Whitening Products
- 5.4.4. Toothbrush
- 5.4.5. Toothpaste
- 5.4.6. Other Dental Hygiene Products
- 5.5. Market Analysis, Insights and Forecast - by Lab Equipment
- 5.5.1. CAD/CAM
- 5.5.2. Other Lab Equipment
- 5.6. Market Analysis, Insights and Forecast - by Orthodontics
- 5.6.1. Fixed Braces
- 5.6.2. Removable Braces
- 5.7. Market Analysis, Insights and Forecast - by Periodontics
- 5.7.1. Dental Anesthetics
- 5.7.2. Dental Hemostats
- 5.7.3. Dental Sutures
- 5.8. Market Analysis, Insights and Forecast - by Endodontics
- 5.8.1. Endodotics Files
- 5.8.2. Obturators
- 5.8.3. Permanent Endodontic Sealers
- 5.9. Market Analysis, Insights and Forecast - by Region
- 5.9.1. North America
- 5.9.2. Europe
- 5.9.3. Asia Pacific
- 5.9.4. Middle East and Africa
- 5.9.5. South America
- 5.1. Market Analysis, Insights and Forecast - by Dental Prosthetics
- 6. North America Oral Care Products Market Analysis, Insights and Forecast, 2019-2031
- 6.1. Market Analysis, Insights and Forecast - by Dental Prosthetics
- 6.1.1. Dental Implants and Abutments
- 6.1.2. Titanium Implants
- 6.1.3. Zirconium Implants
- 6.1.4. Dentures
- 6.1.5. Crown
- 6.1.6. Other Dental Prosthetics
- 6.2. Market Analysis, Insights and Forecast - by Dental Biomaterial
- 6.2.1. Dental Bone Grafts
- 6.2.2. Tissue Regenerative Materials
- 6.2.3. Other Dental Biomaterials
- 6.3. Market Analysis, Insights and Forecast - by Oral Imaging
- 6.3.1. Oral X-ray
- 6.3.2. Dental CBCT
- 6.3.3. Dental Optical Imaging
- 6.3.4. Other Oral Imaging Types
- 6.4. Market Analysis, Insights and Forecast - by Dental Hygiene
- 6.4.1. Mouthwash/Dental Rinse
- 6.4.2. Dental Accessories
- 6.4.3. Dental Bleaching/Whitening Products
- 6.4.4. Toothbrush
- 6.4.5. Toothpaste
- 6.4.6. Other Dental Hygiene Products
- 6.5. Market Analysis, Insights and Forecast - by Lab Equipment
- 6.5.1. CAD/CAM
- 6.5.2. Other Lab Equipment
- 6.6. Market Analysis, Insights and Forecast - by Orthodontics
- 6.6.1. Fixed Braces
- 6.6.2. Removable Braces
- 6.7. Market Analysis, Insights and Forecast - by Periodontics
- 6.7.1. Dental Anesthetics
- 6.7.2. Dental Hemostats
- 6.7.3. Dental Sutures
- 6.8. Market Analysis, Insights and Forecast - by Endodontics
- 6.8.1. Endodotics Files
- 6.8.2. Obturators
- 6.8.3. Permanent Endodontic Sealers
- 6.1. Market Analysis, Insights and Forecast - by Dental Prosthetics
- 7. Europe Oral Care Products Market Analysis, Insights and Forecast, 2019-2031
- 7.1. Market Analysis, Insights and Forecast - by Dental Prosthetics
- 7.1.1. Dental Implants and Abutments
- 7.1.2. Titanium Implants
- 7.1.3. Zirconium Implants
- 7.1.4. Dentures
- 7.1.5. Crown
- 7.1.6. Other Dental Prosthetics
- 7.2. Market Analysis, Insights and Forecast - by Dental Biomaterial
- 7.2.1. Dental Bone Grafts
- 7.2.2. Tissue Regenerative Materials
- 7.2.3. Other Dental Biomaterials
- 7.3. Market Analysis, Insights and Forecast - by Oral Imaging
- 7.3.1. Oral X-ray
- 7.3.2. Dental CBCT
- 7.3.3. Dental Optical Imaging
- 7.3.4. Other Oral Imaging Types
- 7.4. Market Analysis, Insights and Forecast - by Dental Hygiene
- 7.4.1. Mouthwash/Dental Rinse
- 7.4.2. Dental Accessories
- 7.4.3. Dental Bleaching/Whitening Products
- 7.4.4. Toothbrush
- 7.4.5. Toothpaste
- 7.4.6. Other Dental Hygiene Products
- 7.5. Market Analysis, Insights and Forecast - by Lab Equipment
- 7.5.1. CAD/CAM
- 7.5.2. Other Lab Equipment
- 7.6. Market Analysis, Insights and Forecast - by Orthodontics
- 7.6.1. Fixed Braces
- 7.6.2. Removable Braces
- 7.7. Market Analysis, Insights and Forecast - by Periodontics
- 7.7.1. Dental Anesthetics
- 7.7.2. Dental Hemostats
- 7.7.3. Dental Sutures
- 7.8. Market Analysis, Insights and Forecast - by Endodontics
- 7.8.1. Endodotics Files
- 7.8.2. Obturators
- 7.8.3. Permanent Endodontic Sealers
- 7.1. Market Analysis, Insights and Forecast - by Dental Prosthetics
- 8. Asia Pacific Oral Care Products Market Analysis, Insights and Forecast, 2019-2031
- 8.1. Market Analysis, Insights and Forecast - by Dental Prosthetics
- 8.1.1. Dental Implants and Abutments
- 8.1.2. Titanium Implants
- 8.1.3. Zirconium Implants
- 8.1.4. Dentures
- 8.1.5. Crown
- 8.1.6. Other Dental Prosthetics
- 8.2. Market Analysis, Insights and Forecast - by Dental Biomaterial
- 8.2.1. Dental Bone Grafts
- 8.2.2. Tissue Regenerative Materials
- 8.2.3. Other Dental Biomaterials
- 8.3. Market Analysis, Insights and Forecast - by Oral Imaging
- 8.3.1. Oral X-ray
- 8.3.2. Dental CBCT
- 8.3.3. Dental Optical Imaging
- 8.3.4. Other Oral Imaging Types
- 8.4. Market Analysis, Insights and Forecast - by Dental Hygiene
- 8.4.1. Mouthwash/Dental Rinse
- 8.4.2. Dental Accessories
- 8.4.3. Dental Bleaching/Whitening Products
- 8.4.4. Toothbrush
- 8.4.5. Toothpaste
- 8.4.6. Other Dental Hygiene Products
- 8.5. Market Analysis, Insights and Forecast - by Lab Equipment
- 8.5.1. CAD/CAM
- 8.5.2. Other Lab Equipment
- 8.6. Market Analysis, Insights and Forecast - by Orthodontics
- 8.6.1. Fixed Braces
- 8.6.2. Removable Braces
- 8.7. Market Analysis, Insights and Forecast - by Periodontics
- 8.7.1. Dental Anesthetics
- 8.7.2. Dental Hemostats
- 8.7.3. Dental Sutures
- 8.8. Market Analysis, Insights and Forecast - by Endodontics
- 8.8.1. Endodotics Files
- 8.8.2. Obturators
- 8.8.3. Permanent Endodontic Sealers
- 8.1. Market Analysis, Insights and Forecast - by Dental Prosthetics
- 9. Middle East and Africa Oral Care Products Market Analysis, Insights and Forecast, 2019-2031
- 9.1. Market Analysis, Insights and Forecast - by Dental Prosthetics
- 9.1.1. Dental Implants and Abutments
- 9.1.2. Titanium Implants
- 9.1.3. Zirconium Implants
- 9.1.4. Dentures
- 9.1.5. Crown
- 9.1.6. Other Dental Prosthetics
- 9.2. Market Analysis, Insights and Forecast - by Dental Biomaterial
- 9.2.1. Dental Bone Grafts
- 9.2.2. Tissue Regenerative Materials
- 9.2.3. Other Dental Biomaterials
- 9.3. Market Analysis, Insights and Forecast - by Oral Imaging
- 9.3.1. Oral X-ray
- 9.3.2. Dental CBCT
- 9.3.3. Dental Optical Imaging
- 9.3.4. Other Oral Imaging Types
- 9.4. Market Analysis, Insights and Forecast - by Dental Hygiene
- 9.4.1. Mouthwash/Dental Rinse
- 9.4.2. Dental Accessories
- 9.4.3. Dental Bleaching/Whitening Products
- 9.4.4. Toothbrush
- 9.4.5. Toothpaste
- 9.4.6. Other Dental Hygiene Products
- 9.5. Market Analysis, Insights and Forecast - by Lab Equipment
- 9.5.1. CAD/CAM
- 9.5.2. Other Lab Equipment
- 9.6. Market Analysis, Insights and Forecast - by Orthodontics
- 9.6.1. Fixed Braces
- 9.6.2. Removable Braces
- 9.7. Market Analysis, Insights and Forecast - by Periodontics
- 9.7.1. Dental Anesthetics
- 9.7.2. Dental Hemostats
- 9.7.3. Dental Sutures
- 9.8. Market Analysis, Insights and Forecast - by Endodontics
- 9.8.1. Endodotics Files
- 9.8.2. Obturators
- 9.8.3. Permanent Endodontic Sealers
- 9.1. Market Analysis, Insights and Forecast - by Dental Prosthetics
- 10. South America Oral Care Products Market Analysis, Insights and Forecast, 2019-2031
- 10.1. Market Analysis, Insights and Forecast - by Dental Prosthetics
- 10.1.1. Dental Implants and Abutments
- 10.1.2. Titanium Implants
- 10.1.3. Zirconium Implants
- 10.1.4. Dentures
- 10.1.5. Crown
- 10.1.6. Other Dental Prosthetics
- 10.2. Market Analysis, Insights and Forecast - by Dental Biomaterial
- 10.2.1. Dental Bone Grafts
- 10.2.2. Tissue Regenerative Materials
- 10.2.3. Other Dental Biomaterials
- 10.3. Market Analysis, Insights and Forecast - by Oral Imaging
- 10.3.1. Oral X-ray
- 10.3.2. Dental CBCT
- 10.3.3. Dental Optical Imaging
- 10.3.4. Other Oral Imaging Types
- 10.4. Market Analysis, Insights and Forecast - by Dental Hygiene
- 10.4.1. Mouthwash/Dental Rinse
- 10.4.2. Dental Accessories
- 10.4.3. Dental Bleaching/Whitening Products
- 10.4.4. Toothbrush
- 10.4.5. Toothpaste
- 10.4.6. Other Dental Hygiene Products
- 10.5. Market Analysis, Insights and Forecast - by Lab Equipment
- 10.5.1. CAD/CAM
- 10.5.2. Other Lab Equipment
- 10.6. Market Analysis, Insights and Forecast - by Orthodontics
- 10.6.1. Fixed Braces
- 10.6.2. Removable Braces
- 10.7. Market Analysis, Insights and Forecast - by Periodontics
- 10.7.1. Dental Anesthetics
- 10.7.2. Dental Hemostats
- 10.7.3. Dental Sutures
- 10.8. Market Analysis, Insights and Forecast - by Endodontics
- 10.8.1. Endodotics Files
- 10.8.2. Obturators
- 10.8.3. Permanent Endodontic Sealers
- 10.1. Market Analysis, Insights and Forecast - by Dental Prosthetics
- 11. North America Oral Care Products Market Analysis, Insights and Forecast, 2019-2031
- 11.1. Market Analysis, Insights and Forecast - By Country/Sub-region
- 11.1.1 United States
- 11.1.2 Canada
- 11.1.3 Mexico
- 12. Europe Oral Care Products Market Analysis, Insights and Forecast, 2019-2031
- 12.1. Market Analysis, Insights and Forecast - By Country/Sub-region
- 12.1.1 Germany
- 12.1.2 United Kingdom
- 12.1.3 France
- 12.1.4 Italy
- 12.1.5 Spain
- 12.1.6 Rest of Europe
- 13. Asia Pacific Oral Care Products Market Analysis, Insights and Forecast, 2019-2031
- 13.1. Market Analysis, Insights and Forecast - By Country/Sub-region
- 13.1.1 China
- 13.1.2 Japan
- 13.1.3 India
- 13.1.4 Australia
- 13.1.5 South Korea
- 13.1.6 Rest of Asia Pacific
- 14. Middle East and Africa Oral Care Products Market Analysis, Insights and Forecast, 2019-2031
- 14.1. Market Analysis, Insights and Forecast - By Country/Sub-region
- 14.1.1 GCC
- 14.1.2 South Africa
- 14.1.3 Rest of Middle East and Africa
- 15. South America Oral Care Products Market Analysis, Insights and Forecast, 2019-2031
- 15.1. Market Analysis, Insights and Forecast - By Country/Sub-region
- 15.1.1 Brazil
- 15.1.2 Argentina
- 15.1.3 Rest of South America
- 16. Competitive Analysis
- 16.1. Global Market Share Analysis 2024
- 16.2. Company Profiles
- 16.2.1 Envista Holdings Corporation (Nobel Biocare Services AG)
- 16.2.1.1. Overview
- 16.2.1.2. Products
- 16.2.1.3. SWOT Analysis
- 16.2.1.4. Recent Developments
- 16.2.1.5. Financials (Based on Availability)
- 16.2.2 Unilever
- 16.2.2.1. Overview
- 16.2.2.2. Products
- 16.2.2.3. SWOT Analysis
- 16.2.2.4. Recent Developments
- 16.2.2.5. Financials (Based on Availability)
- 16.2.3 Straumann
- 16.2.3.1. Overview
- 16.2.3.2. Products
- 16.2.3.3. SWOT Analysis
- 16.2.3.4. Recent Developments
- 16.2.3.5. Financials (Based on Availability)
- 16.2.4 Procter & Gamble
- 16.2.4.1. Overview
- 16.2.4.2. Products
- 16.2.4.3. SWOT Analysis
- 16.2.4.4. Recent Developments
- 16.2.4.5. Financials (Based on Availability)
- 16.2.5 Biolase Inc
- 16.2.5.1. Overview
- 16.2.5.2. Products
- 16.2.5.3. SWOT Analysis
- 16.2.5.4. Recent Developments
- 16.2.5.5. Financials (Based on Availability)
- 16.2.6 3M
- 16.2.6.1. Overview
- 16.2.6.2. Products
- 16.2.6.3. SWOT Analysis
- 16.2.6.4. Recent Developments
- 16.2.6.5. Financials (Based on Availability)
- 16.2.7 Dentsply Sirona
- 16.2.7.1. Overview
- 16.2.7.2. Products
- 16.2.7.3. SWOT Analysis
- 16.2.7.4. Recent Developments
- 16.2.7.5. Financials (Based on Availability)
- 16.2.8 Colgate-Palmolive Company
- 16.2.8.1. Overview
- 16.2.8.2. Products
- 16.2.8.3. SWOT Analysis
- 16.2.8.4. Recent Developments
- 16.2.8.5. Financials (Based on Availability)
- 16.2.9 Carestream Health
- 16.2.9.1. Overview
- 16.2.9.2. Products
- 16.2.9.3. SWOT Analysis
- 16.2.9.4. Recent Developments
- 16.2.9.5. Financials (Based on Availability)
- 16.2.10 GC Corporation
- 16.2.10.1. Overview
- 16.2.10.2. Products
- 16.2.10.3. SWOT Analysis
- 16.2.10.4. Recent Developments
- 16.2.10.5. Financials (Based on Availability)
- 16.2.11 GlaxoSmithKline
- 16.2.11.1. Overview
- 16.2.11.2. Products
- 16.2.11.3. SWOT Analysis
- 16.2.11.4. Recent Developments
- 16.2.11.5. Financials (Based on Availability)
- 16.2.12 Johnson & Johnson
- 16.2.12.1. Overview
- 16.2.12.2. Products
- 16.2.12.3. SWOT Analysis
- 16.2.12.4. Recent Developments
- 16.2.12.5. Financials (Based on Availability)
- 16.2.1 Envista Holdings Corporation (Nobel Biocare Services AG)
List of Figures
- Figure 1: Global Oral Care Products Market Revenue Breakdown (Million, %) by Region 2024 & 2032
- Figure 2: Global Oral Care Products Market Volume Breakdown (K Unit, %) by Region 2024 & 2032
- Figure 3: North America Oral Care Products Market Revenue (Million), by Country 2024 & 2032
- Figure 4: North America Oral Care Products Market Volume (K Unit), by Country 2024 & 2032
- Figure 5: North America Oral Care Products Market Revenue Share (%), by Country 2024 & 2032
- Figure 6: North America Oral Care Products Market Volume Share (%), by Country 2024 & 2032
- Figure 7: Europe Oral Care Products Market Revenue (Million), by Country 2024 & 2032
- Figure 8: Europe Oral Care Products Market Volume (K Unit), by Country 2024 & 2032
- Figure 9: Europe Oral Care Products Market Revenue Share (%), by Country 2024 & 2032
- Figure 10: Europe Oral Care Products Market Volume Share (%), by Country 2024 & 2032
- Figure 11: Asia Pacific Oral Care Products Market Revenue (Million), by Country 2024 & 2032
- Figure 12: Asia Pacific Oral Care Products Market Volume (K Unit), by Country 2024 & 2032
- Figure 13: Asia Pacific Oral Care Products Market Revenue Share (%), by Country 2024 & 2032
- Figure 14: Asia Pacific Oral Care Products Market Volume Share (%), by Country 2024 & 2032
- Figure 15: Middle East and Africa Oral Care Products Market Revenue (Million), by Country 2024 & 2032
- Figure 16: Middle East and Africa Oral Care Products Market Volume (K Unit), by Country 2024 & 2032
- Figure 17: Middle East and Africa Oral Care Products Market Revenue Share (%), by Country 2024 & 2032
- Figure 18: Middle East and Africa Oral Care Products Market Volume Share (%), by Country 2024 & 2032
- Figure 19: South America Oral Care Products Market Revenue (Million), by Country 2024 & 2032
- Figure 20: South America Oral Care Products Market Volume (K Unit), by Country 2024 & 2032
- Figure 21: South America Oral Care Products Market Revenue Share (%), by Country 2024 & 2032
- Figure 22: South America Oral Care Products Market Volume Share (%), by Country 2024 & 2032
- Figure 23: North America Oral Care Products Market Revenue (Million), by Dental Prosthetics 2024 & 2032
- Figure 24: North America Oral Care Products Market Volume (K Unit), by Dental Prosthetics 2024 & 2032
- Figure 25: North America Oral Care Products Market Revenue Share (%), by Dental Prosthetics 2024 & 2032
- Figure 26: North America Oral Care Products Market Volume Share (%), by Dental Prosthetics 2024 & 2032
- Figure 27: North America Oral Care Products Market Revenue (Million), by Dental Biomaterial 2024 & 2032
- Figure 28: North America Oral Care Products Market Volume (K Unit), by Dental Biomaterial 2024 & 2032
- Figure 29: North America Oral Care Products Market Revenue Share (%), by Dental Biomaterial 2024 & 2032
- Figure 30: North America Oral Care Products Market Volume Share (%), by Dental Biomaterial 2024 & 2032
- Figure 31: North America Oral Care Products Market Revenue (Million), by Oral Imaging 2024 & 2032
- Figure 32: North America Oral Care Products Market Volume (K Unit), by Oral Imaging 2024 & 2032
- Figure 33: North America Oral Care Products Market Revenue Share (%), by Oral Imaging 2024 & 2032
- Figure 34: North America Oral Care Products Market Volume Share (%), by Oral Imaging 2024 & 2032
- Figure 35: North America Oral Care Products Market Revenue (Million), by Dental Hygiene 2024 & 2032
- Figure 36: North America Oral Care Products Market Volume (K Unit), by Dental Hygiene 2024 & 2032
- Figure 37: North America Oral Care Products Market Revenue Share (%), by Dental Hygiene 2024 & 2032
- Figure 38: North America Oral Care Products Market Volume Share (%), by Dental Hygiene 2024 & 2032
- Figure 39: North America Oral Care Products Market Revenue (Million), by Lab Equipment 2024 & 2032
- Figure 40: North America Oral Care Products Market Volume (K Unit), by Lab Equipment 2024 & 2032
- Figure 41: North America Oral Care Products Market Revenue Share (%), by Lab Equipment 2024 & 2032
- Figure 42: North America Oral Care Products Market Volume Share (%), by Lab Equipment 2024 & 2032
- Figure 43: North America Oral Care Products Market Revenue (Million), by Orthodontics 2024 & 2032
- Figure 44: North America Oral Care Products Market Volume (K Unit), by Orthodontics 2024 & 2032
- Figure 45: North America Oral Care Products Market Revenue Share (%), by Orthodontics 2024 & 2032
- Figure 46: North America Oral Care Products Market Volume Share (%), by Orthodontics 2024 & 2032
- Figure 47: North America Oral Care Products Market Revenue (Million), by Periodontics 2024 & 2032
- Figure 48: North America Oral Care Products Market Volume (K Unit), by Periodontics 2024 & 2032
- Figure 49: North America Oral Care Products Market Revenue Share (%), by Periodontics 2024 & 2032
- Figure 50: North America Oral Care Products Market Volume Share (%), by Periodontics 2024 & 2032
- Figure 51: North America Oral Care Products Market Revenue (Million), by Endodontics 2024 & 2032
- Figure 52: North America Oral Care Products Market Volume (K Unit), by Endodontics 2024 & 2032
- Figure 53: North America Oral Care Products Market Revenue Share (%), by Endodontics 2024 & 2032
- Figure 54: North America Oral Care Products Market Volume Share (%), by Endodontics 2024 & 2032
- Figure 55: North America Oral Care Products Market Revenue (Million), by Country 2024 & 2032
- Figure 56: North America Oral Care Products Market Volume (K Unit), by Country 2024 & 2032
- Figure 57: North America Oral Care Products Market Revenue Share (%), by Country 2024 & 2032
- Figure 58: North America Oral Care Products Market Volume Share (%), by Country 2024 & 2032
- Figure 59: Europe Oral Care Products Market Revenue (Million), by Dental Prosthetics 2024 & 2032
- Figure 60: Europe Oral Care Products Market Volume (K Unit), by Dental Prosthetics 2024 & 2032
- Figure 61: Europe Oral Care Products Market Revenue Share (%), by Dental Prosthetics 2024 & 2032
- Figure 62: Europe Oral Care Products Market Volume Share (%), by Dental Prosthetics 2024 & 2032
- Figure 63: Europe Oral Care Products Market Revenue (Million), by Dental Biomaterial 2024 & 2032
- Figure 64: Europe Oral Care Products Market Volume (K Unit), by Dental Biomaterial 2024 & 2032
- Figure 65: Europe Oral Care Products Market Revenue Share (%), by Dental Biomaterial 2024 & 2032
- Figure 66: Europe Oral Care Products Market Volume Share (%), by Dental Biomaterial 2024 & 2032
- Figure 67: Europe Oral Care Products Market Revenue (Million), by Oral Imaging 2024 & 2032
- Figure 68: Europe Oral Care Products Market Volume (K Unit), by Oral Imaging 2024 & 2032
- Figure 69: Europe Oral Care Products Market Revenue Share (%), by Oral Imaging 2024 & 2032
- Figure 70: Europe Oral Care Products Market Volume Share (%), by Oral Imaging 2024 & 2032
- Figure 71: Europe Oral Care Products Market Revenue (Million), by Dental Hygiene 2024 & 2032
- Figure 72: Europe Oral Care Products Market Volume (K Unit), by Dental Hygiene 2024 & 2032
- Figure 73: Europe Oral Care Products Market Revenue Share (%), by Dental Hygiene 2024 & 2032
- Figure 74: Europe Oral Care Products Market Volume Share (%), by Dental Hygiene 2024 & 2032
- Figure 75: Europe Oral Care Products Market Revenue (Million), by Lab Equipment 2024 & 2032
- Figure 76: Europe Oral Care Products Market Volume (K Unit), by Lab Equipment 2024 & 2032
- Figure 77: Europe Oral Care Products Market Revenue Share (%), by Lab Equipment 2024 & 2032
- Figure 78: Europe Oral Care Products Market Volume Share (%), by Lab Equipment 2024 & 2032
- Figure 79: Europe Oral Care Products Market Revenue (Million), by Orthodontics 2024 & 2032
- Figure 80: Europe Oral Care Products Market Volume (K Unit), by Orthodontics 2024 & 2032
- Figure 81: Europe Oral Care Products Market Revenue Share (%), by Orthodontics 2024 & 2032
- Figure 82: Europe Oral Care Products Market Volume Share (%), by Orthodontics 2024 & 2032
- Figure 83: Europe Oral Care Products Market Revenue (Million), by Periodontics 2024 & 2032
- Figure 84: Europe Oral Care Products Market Volume (K Unit), by Periodontics 2024 & 2032
- Figure 85: Europe Oral Care Products Market Revenue Share (%), by Periodontics 2024 & 2032
- Figure 86: Europe Oral Care Products Market Volume Share (%), by Periodontics 2024 & 2032
- Figure 87: Europe Oral Care Products Market Revenue (Million), by Endodontics 2024 & 2032
- Figure 88: Europe Oral Care Products Market Volume (K Unit), by Endodontics 2024 & 2032
- Figure 89: Europe Oral Care Products Market Revenue Share (%), by Endodontics 2024 & 2032
- Figure 90: Europe Oral Care Products Market Volume Share (%), by Endodontics 2024 & 2032
- Figure 91: Europe Oral Care Products Market Revenue (Million), by Country 2024 & 2032
- Figure 92: Europe Oral Care Products Market Volume (K Unit), by Country 2024 & 2032
- Figure 93: Europe Oral Care Products Market Revenue Share (%), by Country 2024 & 2032
- Figure 94: Europe Oral Care Products Market Volume Share (%), by Country 2024 & 2032
- Figure 95: Asia Pacific Oral Care Products Market Revenue (Million), by Dental Prosthetics 2024 & 2032
- Figure 96: Asia Pacific Oral Care Products Market Volume (K Unit), by Dental Prosthetics 2024 & 2032
- Figure 97: Asia Pacific Oral Care Products Market Revenue Share (%), by Dental Prosthetics 2024 & 2032
- Figure 98: Asia Pacific Oral Care Products Market Volume Share (%), by Dental Prosthetics 2024 & 2032
- Figure 99: Asia Pacific Oral Care Products Market Revenue (Million), by Dental Biomaterial 2024 & 2032
- Figure 100: Asia Pacific Oral Care Products Market Volume (K Unit), by Dental Biomaterial 2024 & 2032
- Figure 101: Asia Pacific Oral Care Products Market Revenue Share (%), by Dental Biomaterial 2024 & 2032
- Figure 102: Asia Pacific Oral Care Products Market Volume Share (%), by Dental Biomaterial 2024 & 2032
- Figure 103: Asia Pacific Oral Care Products Market Revenue (Million), by Oral Imaging 2024 & 2032
- Figure 104: Asia Pacific Oral Care Products Market Volume (K Unit), by Oral Imaging 2024 & 2032
- Figure 105: Asia Pacific Oral Care Products Market Revenue Share (%), by Oral Imaging 2024 & 2032
- Figure 106: Asia Pacific Oral Care Products Market Volume Share (%), by Oral Imaging 2024 & 2032
- Figure 107: Asia Pacific Oral Care Products Market Revenue (Million), by Dental Hygiene 2024 & 2032
- Figure 108: Asia Pacific Oral Care Products Market Volume (K Unit), by Dental Hygiene 2024 & 2032
- Figure 109: Asia Pacific Oral Care Products Market Revenue Share (%), by Dental Hygiene 2024 & 2032
- Figure 110: Asia Pacific Oral Care Products Market Volume Share (%), by Dental Hygiene 2024 & 2032
- Figure 111: Asia Pacific Oral Care Products Market Revenue (Million), by Lab Equipment 2024 & 2032
- Figure 112: Asia Pacific Oral Care Products Market Volume (K Unit), by Lab Equipment 2024 & 2032
- Figure 113: Asia Pacific Oral Care Products Market Revenue Share (%), by Lab Equipment 2024 & 2032
- Figure 114: Asia Pacific Oral Care Products Market Volume Share (%), by Lab Equipment 2024 & 2032
- Figure 115: Asia Pacific Oral Care Products Market Revenue (Million), by Orthodontics 2024 & 2032
- Figure 116: Asia Pacific Oral Care Products Market Volume (K Unit), by Orthodontics 2024 & 2032
- Figure 117: Asia Pacific Oral Care Products Market Revenue Share (%), by Orthodontics 2024 & 2032
- Figure 118: Asia Pacific Oral Care Products Market Volume Share (%), by Orthodontics 2024 & 2032
- Figure 119: Asia Pacific Oral Care Products Market Revenue (Million), by Periodontics 2024 & 2032
- Figure 120: Asia Pacific Oral Care Products Market Volume (K Unit), by Periodontics 2024 & 2032
- Figure 121: Asia Pacific Oral Care Products Market Revenue Share (%), by Periodontics 2024 & 2032
- Figure 122: Asia Pacific Oral Care Products Market Volume Share (%), by Periodontics 2024 & 2032
- Figure 123: Asia Pacific Oral Care Products Market Revenue (Million), by Endodontics 2024 & 2032
- Figure 124: Asia Pacific Oral Care Products Market Volume (K Unit), by Endodontics 2024 & 2032
- Figure 125: Asia Pacific Oral Care Products Market Revenue Share (%), by Endodontics 2024 & 2032
- Figure 126: Asia Pacific Oral Care Products Market Volume Share (%), by Endodontics 2024 & 2032
- Figure 127: Asia Pacific Oral Care Products Market Revenue (Million), by Country 2024 & 2032
- Figure 128: Asia Pacific Oral Care Products Market Volume (K Unit), by Country 2024 & 2032
- Figure 129: Asia Pacific Oral Care Products Market Revenue Share (%), by Country 2024 & 2032
- Figure 130: Asia Pacific Oral Care Products Market Volume Share (%), by Country 2024 & 2032
- Figure 131: Middle East and Africa Oral Care Products Market Revenue (Million), by Dental Prosthetics 2024 & 2032
- Figure 132: Middle East and Africa Oral Care Products Market Volume (K Unit), by Dental Prosthetics 2024 & 2032
- Figure 133: Middle East and Africa Oral Care Products Market Revenue Share (%), by Dental Prosthetics 2024 & 2032
- Figure 134: Middle East and Africa Oral Care Products Market Volume Share (%), by Dental Prosthetics 2024 & 2032
- Figure 135: Middle East and Africa Oral Care Products Market Revenue (Million), by Dental Biomaterial 2024 & 2032
- Figure 136: Middle East and Africa Oral Care Products Market Volume (K Unit), by Dental Biomaterial 2024 & 2032
- Figure 137: Middle East and Africa Oral Care Products Market Revenue Share (%), by Dental Biomaterial 2024 & 2032
- Figure 138: Middle East and Africa Oral Care Products Market Volume Share (%), by Dental Biomaterial 2024 & 2032
- Figure 139: Middle East and Africa Oral Care Products Market Revenue (Million), by Oral Imaging 2024 & 2032
- Figure 140: Middle East and Africa Oral Care Products Market Volume (K Unit), by Oral Imaging 2024 & 2032
- Figure 141: Middle East and Africa Oral Care Products Market Revenue Share (%), by Oral Imaging 2024 & 2032
- Figure 142: Middle East and Africa Oral Care Products Market Volume Share (%), by Oral Imaging 2024 & 2032
- Figure 143: Middle East and Africa Oral Care Products Market Revenue (Million), by Dental Hygiene 2024 & 2032
- Figure 144: Middle East and Africa Oral Care Products Market Volume (K Unit), by Dental Hygiene 2024 & 2032
- Figure 145: Middle East and Africa Oral Care Products Market Revenue Share (%), by Dental Hygiene 2024 & 2032
- Figure 146: Middle East and Africa Oral Care Products Market Volume Share (%), by Dental Hygiene 2024 & 2032
- Figure 147: Middle East and Africa Oral Care Products Market Revenue (Million), by Lab Equipment 2024 & 2032
- Figure 148: Middle East and Africa Oral Care Products Market Volume (K Unit), by Lab Equipment 2024 & 2032
- Figure 149: Middle East and Africa Oral Care Products Market Revenue Share (%), by Lab Equipment 2024 & 2032
- Figure 150: Middle East and Africa Oral Care Products Market Volume Share (%), by Lab Equipment 2024 & 2032
- Figure 151: Middle East and Africa Oral Care Products Market Revenue (Million), by Orthodontics 2024 & 2032
- Figure 152: Middle East and Africa Oral Care Products Market Volume (K Unit), by Orthodontics 2024 & 2032
- Figure 153: Middle East and Africa Oral Care Products Market Revenue Share (%), by Orthodontics 2024 & 2032
- Figure 154: Middle East and Africa Oral Care Products Market Volume Share (%), by Orthodontics 2024 & 2032
- Figure 155: Middle East and Africa Oral Care Products Market Revenue (Million), by Periodontics 2024 & 2032
- Figure 156: Middle East and Africa Oral Care Products Market Volume (K Unit), by Periodontics 2024 & 2032
- Figure 157: Middle East and Africa Oral Care Products Market Revenue Share (%), by Periodontics 2024 & 2032
- Figure 158: Middle East and Africa Oral Care Products Market Volume Share (%), by Periodontics 2024 & 2032
- Figure 159: Middle East and Africa Oral Care Products Market Revenue (Million), by Endodontics 2024 & 2032
- Figure 160: Middle East and Africa Oral Care Products Market Volume (K Unit), by Endodontics 2024 & 2032
- Figure 161: Middle East and Africa Oral Care Products Market Revenue Share (%), by Endodontics 2024 & 2032
- Figure 162: Middle East and Africa Oral Care Products Market Volume Share (%), by Endodontics 2024 & 2032
- Figure 163: Middle East and Africa Oral Care Products Market Revenue (Million), by Country 2024 & 2032
- Figure 164: Middle East and Africa Oral Care Products Market Volume (K Unit), by Country 2024 & 2032
- Figure 165: Middle East and Africa Oral Care Products Market Revenue Share (%), by Country 2024 & 2032
- Figure 166: Middle East and Africa Oral Care Products Market Volume Share (%), by Country 2024 & 2032
- Figure 167: South America Oral Care Products Market Revenue (Million), by Dental Prosthetics 2024 & 2032
- Figure 168: South America Oral Care Products Market Volume (K Unit), by Dental Prosthetics 2024 & 2032
- Figure 169: South America Oral Care Products Market Revenue Share (%), by Dental Prosthetics 2024 & 2032
- Figure 170: South America Oral Care Products Market Volume Share (%), by Dental Prosthetics 2024 & 2032
- Figure 171: South America Oral Care Products Market Revenue (Million), by Dental Biomaterial 2024 & 2032
- Figure 172: South America Oral Care Products Market Volume (K Unit), by Dental Biomaterial 2024 & 2032
- Figure 173: South America Oral Care Products Market Revenue Share (%), by Dental Biomaterial 2024 & 2032
- Figure 174: South America Oral Care Products Market Volume Share (%), by Dental Biomaterial 2024 & 2032
- Figure 175: South America Oral Care Products Market Revenue (Million), by Oral Imaging 2024 & 2032
- Figure 176: South America Oral Care Products Market Volume (K Unit), by Oral Imaging 2024 & 2032
- Figure 177: South America Oral Care Products Market Revenue Share (%), by Oral Imaging 2024 & 2032
- Figure 178: South America Oral Care Products Market Volume Share (%), by Oral Imaging 2024 & 2032
- Figure 179: South America Oral Care Products Market Revenue (Million), by Dental Hygiene 2024 & 2032
- Figure 180: South America Oral Care Products Market Volume (K Unit), by Dental Hygiene 2024 & 2032
- Figure 181: South America Oral Care Products Market Revenue Share (%), by Dental Hygiene 2024 & 2032
- Figure 182: South America Oral Care Products Market Volume Share (%), by Dental Hygiene 2024 & 2032
- Figure 183: South America Oral Care Products Market Revenue (Million), by Lab Equipment 2024 & 2032
- Figure 184: South America Oral Care Products Market Volume (K Unit), by Lab Equipment 2024 & 2032
- Figure 185: South America Oral Care Products Market Revenue Share (%), by Lab Equipment 2024 & 2032
- Figure 186: South America Oral Care Products Market Volume Share (%), by Lab Equipment 2024 & 2032
- Figure 187: South America Oral Care Products Market Revenue (Million), by Orthodontics 2024 & 2032
- Figure 188: South America Oral Care Products Market Volume (K Unit), by Orthodontics 2024 & 2032
- Figure 189: South America Oral Care Products Market Revenue Share (%), by Orthodontics 2024 & 2032
- Figure 190: South America Oral Care Products Market Volume Share (%), by Orthodontics 2024 & 2032
- Figure 191: South America Oral Care Products Market Revenue (Million), by Periodontics 2024 & 2032
- Figure 192: South America Oral Care Products Market Volume (K Unit), by Periodontics 2024 & 2032
- Figure 193: South America Oral Care Products Market Revenue Share (%), by Periodontics 2024 & 2032
- Figure 194: South America Oral Care Products Market Volume Share (%), by Periodontics 2024 & 2032
- Figure 195: South America Oral Care Products Market Revenue (Million), by Endodontics 2024 & 2032
- Figure 196: South America Oral Care Products Market Volume (K Unit), by Endodontics 2024 & 2032
- Figure 197: South America Oral Care Products Market Revenue Share (%), by Endodontics 2024 & 2032
- Figure 198: South America Oral Care Products Market Volume Share (%), by Endodontics 2024 & 2032
- Figure 199: South America Oral Care Products Market Revenue (Million), by Country 2024 & 2032
- Figure 200: South America Oral Care Products Market Volume (K Unit), by Country 2024 & 2032
- Figure 201: South America Oral Care Products Market Revenue Share (%), by Country 2024 & 2032
- Figure 202: South America Oral Care Products Market Volume Share (%), by Country 2024 & 2032
List of Tables
- Table 1: Global Oral Care Products Market Revenue Million Forecast, by Region 2019 & 2032
- Table 2: Global Oral Care Products Market Volume K Unit Forecast, by Region 2019 & 2032
- Table 3: Global Oral Care Products Market Revenue Million Forecast, by Dental Prosthetics 2019 & 2032
- Table 4: Global Oral Care Products Market Volume K Unit Forecast, by Dental Prosthetics 2019 & 2032
- Table 5: Global Oral Care Products Market Revenue Million Forecast, by Dental Biomaterial 2019 & 2032
- Table 6: Global Oral Care Products Market Volume K Unit Forecast, by Dental Biomaterial 2019 & 2032
- Table 7: Global Oral Care Products Market Revenue Million Forecast, by Oral Imaging 2019 & 2032
- Table 8: Global Oral Care Products Market Volume K Unit Forecast, by Oral Imaging 2019 & 2032
- Table 9: Global Oral Care Products Market Revenue Million Forecast, by Dental Hygiene 2019 & 2032
- Table 10: Global Oral Care Products Market Volume K Unit Forecast, by Dental Hygiene 2019 & 2032
- Table 11: Global Oral Care Products Market Revenue Million Forecast, by Lab Equipment 2019 & 2032
- Table 12: Global Oral Care Products Market Volume K Unit Forecast, by Lab Equipment 2019 & 2032
- Table 13: Global Oral Care Products Market Revenue Million Forecast, by Orthodontics 2019 & 2032
- Table 14: Global Oral Care Products Market Volume K Unit Forecast, by Orthodontics 2019 & 2032
- Table 15: Global Oral Care Products Market Revenue Million Forecast, by Periodontics 2019 & 2032
- Table 16: Global Oral Care Products Market Volume K Unit Forecast, by Periodontics 2019 & 2032
- Table 17: Global Oral Care Products Market Revenue Million Forecast, by Endodontics 2019 & 2032
- Table 18: Global Oral Care Products Market Volume K Unit Forecast, by Endodontics 2019 & 2032
- Table 19: Global Oral Care Products Market Revenue Million Forecast, by Region 2019 & 2032
- Table 20: Global Oral Care Products Market Volume K Unit Forecast, by Region 2019 & 2032
- Table 21: Global Oral Care Products Market Revenue Million Forecast, by Country 2019 & 2032
- Table 22: Global Oral Care Products Market Volume K Unit Forecast, by Country 2019 & 2032
- Table 23: United States Oral Care Products Market Revenue (Million) Forecast, by Application 2019 & 2032
- Table 24: United States Oral Care Products Market Volume (K Unit) Forecast, by Application 2019 & 2032
- Table 25: Canada Oral Care Products Market Revenue (Million) Forecast, by Application 2019 & 2032
- Table 26: Canada Oral Care Products Market Volume (K Unit) Forecast, by Application 2019 & 2032
- Table 27: Mexico Oral Care Products Market Revenue (Million) Forecast, by Application 2019 & 2032
- Table 28: Mexico Oral Care Products Market Volume (K Unit) Forecast, by Application 2019 & 2032
- Table 29: Global Oral Care Products Market Revenue Million Forecast, by Country 2019 & 2032
- Table 30: Global Oral Care Products Market Volume K Unit Forecast, by Country 2019 & 2032
- Table 31: Germany Oral Care Products Market Revenue (Million) Forecast, by Application 2019 & 2032
- Table 32: Germany Oral Care Products Market Volume (K Unit) Forecast, by Application 2019 & 2032
- Table 33: United Kingdom Oral Care Products Market Revenue (Million) Forecast, by Application 2019 & 2032
- Table 34: United Kingdom Oral Care Products Market Volume (K Unit) Forecast, by Application 2019 & 2032
- Table 35: France Oral Care Products Market Revenue (Million) Forecast, by Application 2019 & 2032
- Table 36: France Oral Care Products Market Volume (K Unit) Forecast, by Application 2019 & 2032
- Table 37: Italy Oral Care Products Market Revenue (Million) Forecast, by Application 2019 & 2032
- Table 38: Italy Oral Care Products Market Volume (K Unit) Forecast, by Application 2019 & 2032
- Table 39: Spain Oral Care Products Market Revenue (Million) Forecast, by Application 2019 & 2032
- Table 40: Spain Oral Care Products Market Volume (K Unit) Forecast, by Application 2019 & 2032
- Table 41: Rest of Europe Oral Care Products Market Revenue (Million) Forecast, by Application 2019 & 2032
- Table 42: Rest of Europe Oral Care Products Market Volume (K Unit) Forecast, by Application 2019 & 2032
- Table 43: Global Oral Care Products Market Revenue Million Forecast, by Country 2019 & 2032
- Table 44: Global Oral Care Products Market Volume K Unit Forecast, by Country 2019 & 2032
- Table 45: China Oral Care Products Market Revenue (Million) Forecast, by Application 2019 & 2032
- Table 46: China Oral Care Products Market Volume (K Unit) Forecast, by Application 2019 & 2032
- Table 47: Japan Oral Care Products Market Revenue (Million) Forecast, by Application 2019 & 2032
- Table 48: Japan Oral Care Products Market Volume (K Unit) Forecast, by Application 2019 & 2032
- Table 49: India Oral Care Products Market Revenue (Million) Forecast, by Application 2019 & 2032
- Table 50: India Oral Care Products Market Volume (K Unit) Forecast, by Application 2019 & 2032
- Table 51: Australia Oral Care Products Market Revenue (Million) Forecast, by Application 2019 & 2032
- Table 52: Australia Oral Care Products Market Volume (K Unit) Forecast, by Application 2019 & 2032
- Table 53: South Korea Oral Care Products Market Revenue (Million) Forecast, by Application 2019 & 2032
- Table 54: South Korea Oral Care Products Market Volume (K Unit) Forecast, by Application 2019 & 2032
- Table 55: Rest of Asia Pacific Oral Care Products Market Revenue (Million) Forecast, by Application 2019 & 2032
- Table 56: Rest of Asia Pacific Oral Care Products Market Volume (K Unit) Forecast, by Application 2019 & 2032
- Table 57: Global Oral Care Products Market Revenue Million Forecast, by Country 2019 & 2032
- Table 58: Global Oral Care Products Market Volume K Unit Forecast, by Country 2019 & 2032
- Table 59: GCC Oral Care Products Market Revenue (Million) Forecast, by Application 2019 & 2032
- Table 60: GCC Oral Care Products Market Volume (K Unit) Forecast, by Application 2019 & 2032
- Table 61: South Africa Oral Care Products Market Revenue (Million) Forecast, by Application 2019 & 2032
- Table 62: South Africa Oral Care Products Market Volume (K Unit) Forecast, by Application 2019 & 2032
- Table 63: Rest of Middle East and Africa Oral Care Products Market Revenue (Million) Forecast, by Application 2019 & 2032
- Table 64: Rest of Middle East and Africa Oral Care Products Market Volume (K Unit) Forecast, by Application 2019 & 2032
- Table 65: Global Oral Care Products Market Revenue Million Forecast, by Country 2019 & 2032
- Table 66: Global Oral Care Products Market Volume K Unit Forecast, by Country 2019 & 2032
- Table 67: Brazil Oral Care Products Market Revenue (Million) Forecast, by Application 2019 & 2032
- Table 68: Brazil Oral Care Products Market Volume (K Unit) Forecast, by Application 2019 & 2032
- Table 69: Argentina Oral Care Products Market Revenue (Million) Forecast, by Application 2019 & 2032
- Table 70: Argentina Oral Care Products Market Volume (K Unit) Forecast, by Application 2019 & 2032
- Table 71: Rest of South America Oral Care Products Market Revenue (Million) Forecast, by Application 2019 & 2032
- Table 72: Rest of South America Oral Care Products Market Volume (K Unit) Forecast, by Application 2019 & 2032
- Table 73: Global Oral Care Products Market Revenue Million Forecast, by Dental Prosthetics 2019 & 2032
- Table 74: Global Oral Care Products Market Volume K Unit Forecast, by Dental Prosthetics 2019 & 2032
- Table 75: Global Oral Care Products Market Revenue Million Forecast, by Dental Biomaterial 2019 & 2032
- Table 76: Global Oral Care Products Market Volume K Unit Forecast, by Dental Biomaterial 2019 & 2032
- Table 77: Global Oral Care Products Market Revenue Million Forecast, by Oral Imaging 2019 & 2032
- Table 78: Global Oral Care Products Market Volume K Unit Forecast, by Oral Imaging 2019 & 2032
- Table 79: Global Oral Care Products Market Revenue Million Forecast, by Dental Hygiene 2019 & 2032
- Table 80: Global Oral Care Products Market Volume K Unit Forecast, by Dental Hygiene 2019 & 2032
- Table 81: Global Oral Care Products Market Revenue Million Forecast, by Lab Equipment 2019 & 2032
- Table 82: Global Oral Care Products Market Volume K Unit Forecast, by Lab Equipment 2019 & 2032
- Table 83: Global Oral Care Products Market Revenue Million Forecast, by Orthodontics 2019 & 2032
- Table 84: Global Oral Care Products Market Volume K Unit Forecast, by Orthodontics 2019 & 2032
- Table 85: Global Oral Care Products Market Revenue Million Forecast, by Periodontics 2019 & 2032
- Table 86: Global Oral Care Products Market Volume K Unit Forecast, by Periodontics 2019 & 2032
- Table 87: Global Oral Care Products Market Revenue Million Forecast, by Endodontics 2019 & 2032
- Table 88: Global Oral Care Products Market Volume K Unit Forecast, by Endodontics 2019 & 2032
- Table 89: Global Oral Care Products Market Revenue Million Forecast, by Country 2019 & 2032
- Table 90: Global Oral Care Products Market Volume K Unit Forecast, by Country 2019 & 2032
- Table 91: United States Oral Care Products Market Revenue (Million) Forecast, by Application 2019 & 2032
- Table 92: United States Oral Care Products Market Volume (K Unit) Forecast, by Application 2019 & 2032
- Table 93: Canada Oral Care Products Market Revenue (Million) Forecast, by Application 2019 & 2032
- Table 94: Canada Oral Care Products Market Volume (K Unit) Forecast, by Application 2019 & 2032
- Table 95: Mexico Oral Care Products Market Revenue (Million) Forecast, by Application 2019 & 2032
- Table 96: Mexico Oral Care Products Market Volume (K Unit) Forecast, by Application 2019 & 2032
- Table 97: Global Oral Care Products Market Revenue Million Forecast, by Dental Prosthetics 2019 & 2032
- Table 98: Global Oral Care Products Market Volume K Unit Forecast, by Dental Prosthetics 2019 & 2032
- Table 99: Global Oral Care Products Market Revenue Million Forecast, by Dental Biomaterial 2019 & 2032
- Table 100: Global Oral Care Products Market Volume K Unit Forecast, by Dental Biomaterial 2019 & 2032
- Table 101: Global Oral Care Products Market Revenue Million Forecast, by Oral Imaging 2019 & 2032
- Table 102: Global Oral Care Products Market Volume K Unit Forecast, by Oral Imaging 2019 & 2032
- Table 103: Global Oral Care Products Market Revenue Million Forecast, by Dental Hygiene 2019 & 2032
- Table 104: Global Oral Care Products Market Volume K Unit Forecast, by Dental Hygiene 2019 & 2032
- Table 105: Global Oral Care Products Market Revenue Million Forecast, by Lab Equipment 2019 & 2032
- Table 106: Global Oral Care Products Market Volume K Unit Forecast, by Lab Equipment 2019 & 2032
- Table 107: Global Oral Care Products Market Revenue Million Forecast, by Orthodontics 2019 & 2032
- Table 108: Global Oral Care Products Market Volume K Unit Forecast, by Orthodontics 2019 & 2032
- Table 109: Global Oral Care Products Market Revenue Million Forecast, by Periodontics 2019 & 2032
- Table 110: Global Oral Care Products Market Volume K Unit Forecast, by Periodontics 2019 & 2032
- Table 111: Global Oral Care Products Market Revenue Million Forecast, by Endodontics 2019 & 2032
- Table 112: Global Oral Care Products Market Volume K Unit Forecast, by Endodontics 2019 & 2032
- Table 113: Global Oral Care Products Market Revenue Million Forecast, by Country 2019 & 2032
- Table 114: Global Oral Care Products Market Volume K Unit Forecast, by Country 2019 & 2032
- Table 115: Germany Oral Care Products Market Revenue (Million) Forecast, by Application 2019 & 2032
- Table 116: Germany Oral Care Products Market Volume (K Unit) Forecast, by Application 2019 & 2032
- Table 117: United Kingdom Oral Care Products Market Revenue (Million) Forecast, by Application 2019 & 2032
- Table 118: United Kingdom Oral Care Products Market Volume (K Unit) Forecast, by Application 2019 & 2032
- Table 119: France Oral Care Products Market Revenue (Million) Forecast, by Application 2019 & 2032
- Table 120: France Oral Care Products Market Volume (K Unit) Forecast, by Application 2019 & 2032
- Table 121: Italy Oral Care Products Market Revenue (Million) Forecast, by Application 2019 & 2032
- Table 122: Italy Oral Care Products Market Volume (K Unit) Forecast, by Application 2019 & 2032
- Table 123: Spain Oral Care Products Market Revenue (Million) Forecast, by Application 2019 & 2032
- Table 124: Spain Oral Care Products Market Volume (K Unit) Forecast, by Application 2019 & 2032
- Table 125: Rest of Europe Oral Care Products Market Revenue (Million) Forecast, by Application 2019 & 2032
- Table 126: Rest of Europe Oral Care Products Market Volume (K Unit) Forecast, by Application 2019 & 2032
- Table 127: Global Oral Care Products Market Revenue Million Forecast, by Dental Prosthetics 2019 & 2032
- Table 128: Global Oral Care Products Market Volume K Unit Forecast, by Dental Prosthetics 2019 & 2032
- Table 129: Global Oral Care Products Market Revenue Million Forecast, by Dental Biomaterial 2019 & 2032
- Table 130: Global Oral Care Products Market Volume K Unit Forecast, by Dental Biomaterial 2019 & 2032
- Table 131: Global Oral Care Products Market Revenue Million Forecast, by Oral Imaging 2019 & 2032
- Table 132: Global Oral Care Products Market Volume K Unit Forecast, by Oral Imaging 2019 & 2032
- Table 133: Global Oral Care Products Market Revenue Million Forecast, by Dental Hygiene 2019 & 2032
- Table 134: Global Oral Care Products Market Volume K Unit Forecast, by Dental Hygiene 2019 & 2032
- Table 135: Global Oral Care Products Market Revenue Million Forecast, by Lab Equipment 2019 & 2032
- Table 136: Global Oral Care Products Market Volume K Unit Forecast, by Lab Equipment 2019 & 2032
- Table 137: Global Oral Care Products Market Revenue Million Forecast, by Orthodontics 2019 & 2032
- Table 138: Global Oral Care Products Market Volume K Unit Forecast, by Orthodontics 2019 & 2032
- Table 139: Global Oral Care Products Market Revenue Million Forecast, by Periodontics 2019 & 2032
- Table 140: Global Oral Care Products Market Volume K Unit Forecast, by Periodontics 2019 & 2032
- Table 141: Global Oral Care Products Market Revenue Million Forecast, by Endodontics 2019 & 2032
- Table 142: Global Oral Care Products Market Volume K Unit Forecast, by Endodontics 2019 & 2032
- Table 143: Global Oral Care Products Market Revenue Million Forecast, by Country 2019 & 2032
- Table 144: Global Oral Care Products Market Volume K Unit Forecast, by Country 2019 & 2032
- Table 145: China Oral Care Products Market Revenue (Million) Forecast, by Application 2019 & 2032
- Table 146: China Oral Care Products Market Volume (K Unit) Forecast, by Application 2019 & 2032
- Table 147: Japan Oral Care Products Market Revenue (Million) Forecast, by Application 2019 & 2032
- Table 148: Japan Oral Care Products Market Volume (K Unit) Forecast, by Application 2019 & 2032
- Table 149: India Oral Care Products Market Revenue (Million) Forecast, by Application 2019 & 2032
- Table 150: India Oral Care Products Market Volume (K Unit) Forecast, by Application 2019 & 2032
- Table 151: Australia Oral Care Products Market Revenue (Million) Forecast, by Application 2019 & 2032
- Table 152: Australia Oral Care Products Market Volume (K Unit) Forecast, by Application 2019 & 2032
- Table 153: South Korea Oral Care Products Market Revenue (Million) Forecast, by Application 2019 & 2032
- Table 154: South Korea Oral Care Products Market Volume (K Unit) Forecast, by Application 2019 & 2032
- Table 155: Rest of Asia Pacific Oral Care Products Market Revenue (Million) Forecast, by Application 2019 & 2032
- Table 156: Rest of Asia Pacific Oral Care Products Market Volume (K Unit) Forecast, by Application 2019 & 2032
- Table 157: Global Oral Care Products Market Revenue Million Forecast, by Dental Prosthetics 2019 & 2032
- Table 158: Global Oral Care Products Market Volume K Unit Forecast, by Dental Prosthetics 2019 & 2032
- Table 159: Global Oral Care Products Market Revenue Million Forecast, by Dental Biomaterial 2019 & 2032
- Table 160: Global Oral Care Products Market Volume K Unit Forecast, by Dental Biomaterial 2019 & 2032
- Table 161: Global Oral Care Products Market Revenue Million Forecast, by Oral Imaging 2019 & 2032
- Table 162: Global Oral Care Products Market Volume K Unit Forecast, by Oral Imaging 2019 & 2032
- Table 163: Global Oral Care Products Market Revenue Million Forecast, by Dental Hygiene 2019 & 2032
- Table 164: Global Oral Care Products Market Volume K Unit Forecast, by Dental Hygiene 2019 & 2032
- Table 165: Global Oral Care Products Market Revenue Million Forecast, by Lab Equipment 2019 & 2032
- Table 166: Global Oral Care Products Market Volume K Unit Forecast, by Lab Equipment 2019 & 2032
- Table 167: Global Oral Care Products Market Revenue Million Forecast, by Orthodontics 2019 & 2032
- Table 168: Global Oral Care Products Market Volume K Unit Forecast, by Orthodontics 2019 & 2032
- Table 169: Global Oral Care Products Market Revenue Million Forecast, by Periodontics 2019 & 2032
- Table 170: Global Oral Care Products Market Volume K Unit Forecast, by Periodontics 2019 & 2032
- Table 171: Global Oral Care Products Market Revenue Million Forecast, by Endodontics 2019 & 2032
- Table 172: Global Oral Care Products Market Volume K Unit Forecast, by Endodontics 2019 & 2032
- Table 173: Global Oral Care Products Market Revenue Million Forecast, by Country 2019 & 2032
- Table 174: Global Oral Care Products Market Volume K Unit Forecast, by Country 2019 & 2032
- Table 175: GCC Oral Care Products Market Revenue (Million) Forecast, by Application 2019 & 2032
- Table 176: GCC Oral Care Products Market Volume (K Unit) Forecast, by Application 2019 & 2032
- Table 177: South Africa Oral Care Products Market Revenue (Million) Forecast, by Application 2019 & 2032
- Table 178: South Africa Oral Care Products Market Volume (K Unit) Forecast, by Application 2019 & 2032
- Table 179: Rest of Middle East and Africa Oral Care Products Market Revenue (Million) Forecast, by Application 2019 & 2032
- Table 180: Rest of Middle East and Africa Oral Care Products Market Volume (K Unit) Forecast, by Application 2019 & 2032
- Table 181: Global Oral Care Products Market Revenue Million Forecast, by Dental Prosthetics 2019 & 2032
- Table 182: Global Oral Care Products Market Volume K Unit Forecast, by Dental Prosthetics 2019 & 2032
- Table 183: Global Oral Care Products Market Revenue Million Forecast, by Dental Biomaterial 2019 & 2032
- Table 184: Global Oral Care Products Market Volume K Unit Forecast, by Dental Biomaterial 2019 & 2032
- Table 185: Global Oral Care Products Market Revenue Million Forecast, by Oral Imaging 2019 & 2032
- Table 186: Global Oral Care Products Market Volume K Unit Forecast, by Oral Imaging 2019 & 2032
- Table 187: Global Oral Care Products Market Revenue Million Forecast, by Dental Hygiene 2019 & 2032
- Table 188: Global Oral Care Products Market Volume K Unit Forecast, by Dental Hygiene 2019 & 2032
- Table 189: Global Oral Care Products Market Revenue Million Forecast, by Lab Equipment 2019 & 2032
- Table 190: Global Oral Care Products Market Volume K Unit Forecast, by Lab Equipment 2019 & 2032
- Table 191: Global Oral Care Products Market Revenue Million Forecast, by Orthodontics 2019 & 2032
- Table 192: Global Oral Care Products Market Volume K Unit Forecast, by Orthodontics 2019 & 2032
- Table 193: Global Oral Care Products Market Revenue Million Forecast, by Periodontics 2019 & 2032
- Table 194: Global Oral Care Products Market Volume K Unit Forecast, by Periodontics 2019 & 2032
- Table 195: Global Oral Care Products Market Revenue Million Forecast, by Endodontics 2019 & 2032
- Table 196: Global Oral Care Products Market Volume K Unit Forecast, by Endodontics 2019 & 2032
- Table 197: Global Oral Care Products Market Revenue Million Forecast, by Country 2019 & 2032
- Table 198: Global Oral Care Products Market Volume K Unit Forecast, by Country 2019 & 2032
- Table 199: Brazil Oral Care Products Market Revenue (Million) Forecast, by Application 2019 & 2032
- Table 200: Brazil Oral Care Products Market Volume (K Unit) Forecast, by Application 2019 & 2032
- Table 201: Argentina Oral Care Products Market Revenue (Million) Forecast, by Application 2019 & 2032
- Table 202: Argentina Oral Care Products Market Volume (K Unit) Forecast, by Application 2019 & 2032
- Table 203: Rest of South America Oral Care Products Market Revenue (Million) Forecast, by Application 2019 & 2032
- Table 204: Rest of South America Oral Care Products Market Volume (K Unit) Forecast, by Application 2019 & 2032
Frequently Asked Questions
1. What is the projected Compound Annual Growth Rate (CAGR) of the Oral Care Products Market?
The projected CAGR is approximately 4.70%.
2. Which companies are prominent players in the Oral Care Products Market?
Key companies in the market include Envista Holdings Corporation (Nobel Biocare Services AG), Unilever, Straumann, Procter & Gamble, Biolase Inc, 3M, Dentsply Sirona, Colgate-Palmolive Company, Carestream Health, GC Corporation, GlaxoSmithKline, Johnson & Johnson.
3. What are the main segments of the Oral Care Products Market?
The market segments include Dental Prosthetics, Dental Biomaterial, Oral Imaging, Dental Hygiene, Lab Equipment, Orthodontics, Periodontics, Endodontics.
4. Can you provide details about the market size?
The market size is estimated to be USD XX Million as of 2022.
5. What are some drivers contributing to market growth?
Rising Geriatric Population and Burden of Dental Diseases; Innovation in Technology Introducing Improved Product Varieties; Rising Oral Care Problems Among Children Due to Poor Eating Habits.
6. What are the notable trends driving market growth?
Titanium Implants Segment is Expected to Witness Considerable Growth Over the Forecast Period.
7. Are there any restraints impacting market growth?
Economic Slowdown Affecting Consumer Purchasing Behavior.
8. Can you provide examples of recent developments in the market?
August 2022: Frimline launched India's first oral care range for pregnant women. Firmline introduced toothpaste and mouthwash designed specifically to protect and improve the oral health of pregnant women.
9. What pricing options are available for accessing the report?
Pricing options include single-user, multi-user, and enterprise licenses priced at USD 4750, USD 5250, and USD 8750 respectively.
10. Is the market size provided in terms of value or volume?
The market size is provided in terms of value, measured in Million and volume, measured in K Unit.
11. Are there any specific market keywords associated with the report?
Yes, the market keyword associated with the report is "Oral Care Products Market," which aids in identifying and referencing the specific market segment covered.
12. How do I determine which pricing option suits my needs best?
The pricing options vary based on user requirements and access needs. Individual users may opt for single-user licenses, while businesses requiring broader access may choose multi-user or enterprise licenses for cost-effective access to the report.
13. Are there any additional resources or data provided in the Oral Care Products Market report?
While the report offers comprehensive insights, it's advisable to review the specific contents or supplementary materials provided to ascertain if additional resources or data are available.
14. How can I stay updated on further developments or reports in the Oral Care Products Market?
To stay informed about further developments, trends, and reports in the Oral Care Products Market, consider subscribing to industry newsletters, following relevant companies and organizations, or regularly checking reputable industry news sources and publications.
Methodology
Step 1 - Identification of Relevant Samples Size from Population Database


Step 2 - Approaches for Defining Global Market Size (Value, Volume* & Price*)

Note*: In applicable scenarios
Step 3 - Data Sources
Primary Research
- Web Analytics
- Survey Reports
- Research Institute
- Latest Research Reports
- Opinion Leaders
Secondary Research
- Annual Reports
- White Paper
- Latest Press Release
- Industry Association
- Paid Database
- Investor Presentations

Step 4 - Data Triangulation
Involves using different sources of information in order to increase the validity of a study
These sources are likely to be stakeholders in a program - participants, other researchers, program staff, other community members, and so on.
Then we put all data in single framework & apply various statistical tools to find out the dynamic on the market.
During the analysis stage, feedback from the stakeholder groups would be compared to determine areas of agreement as well as areas of divergence


