
Key Insights
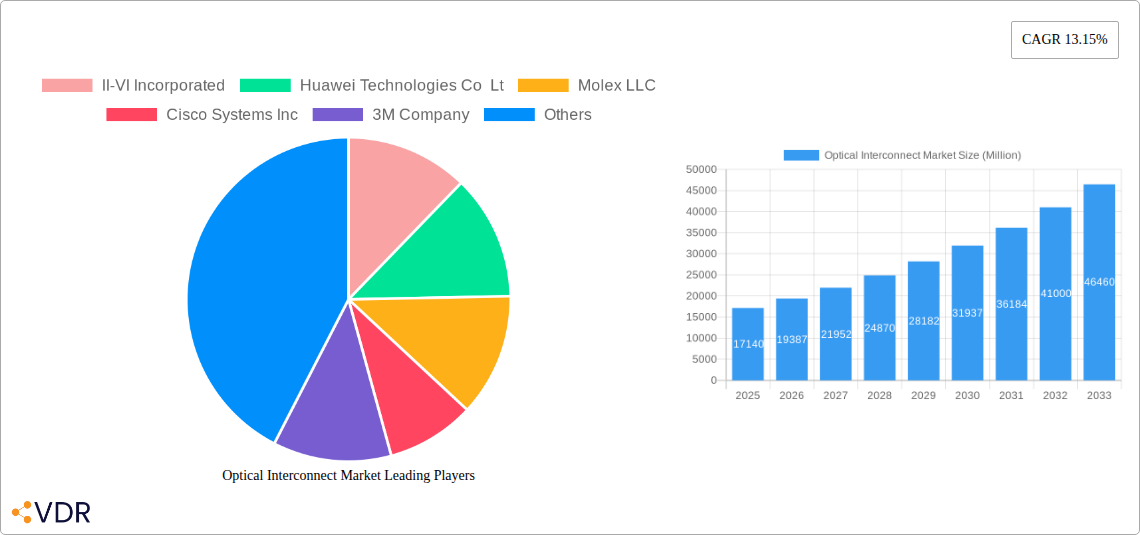
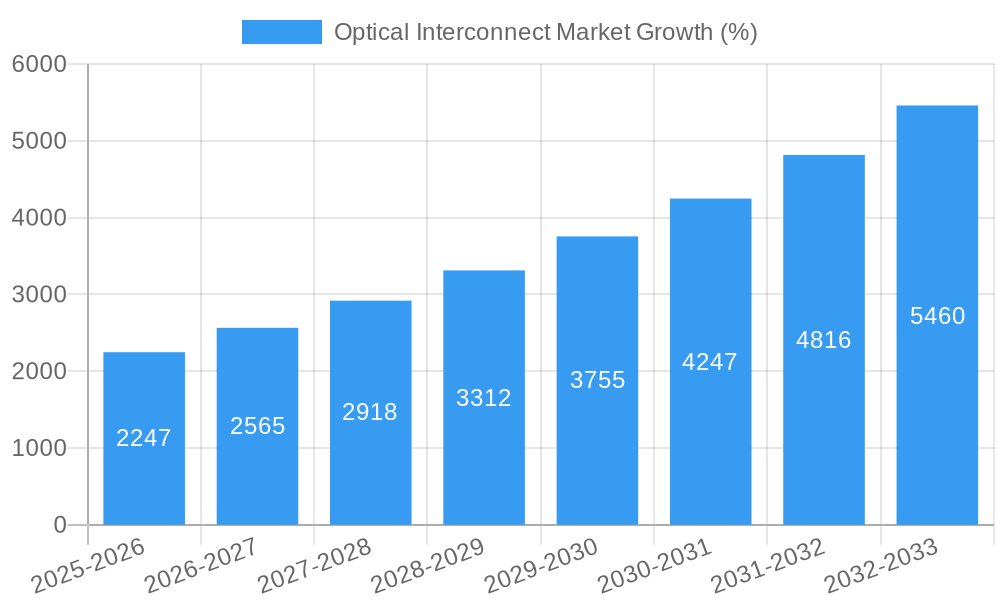
The optical interconnect market, valued at $17.14 billion in 2025, is experiencing robust growth, projected to expand at a compound annual growth rate (CAGR) of 13.15% from 2025 to 2033. This expansion is driven by the increasing demand for high-speed data transmission in various sectors, including telecommunications and data centers. The proliferation of 5G networks, cloud computing, and the Internet of Things (IoT) fuels the need for faster and more efficient data transfer solutions, which optical interconnects uniquely provide. Key market segments include optical transceivers, active optical cables (AOCs), and embedded optical modules (EOMs), each contributing significantly to overall market growth. The telecommunication and data communication application segments are the major revenue generators, further driven by ongoing infrastructure upgrades and expansions globally. While technological advancements and increasing adoption drive market growth, potential restraints include the high initial investment cost associated with optical interconnect infrastructure and the emergence of competing technologies. However, these challenges are likely to be outweighed by the long-term advantages of higher bandwidth and lower latency offered by optical interconnects.
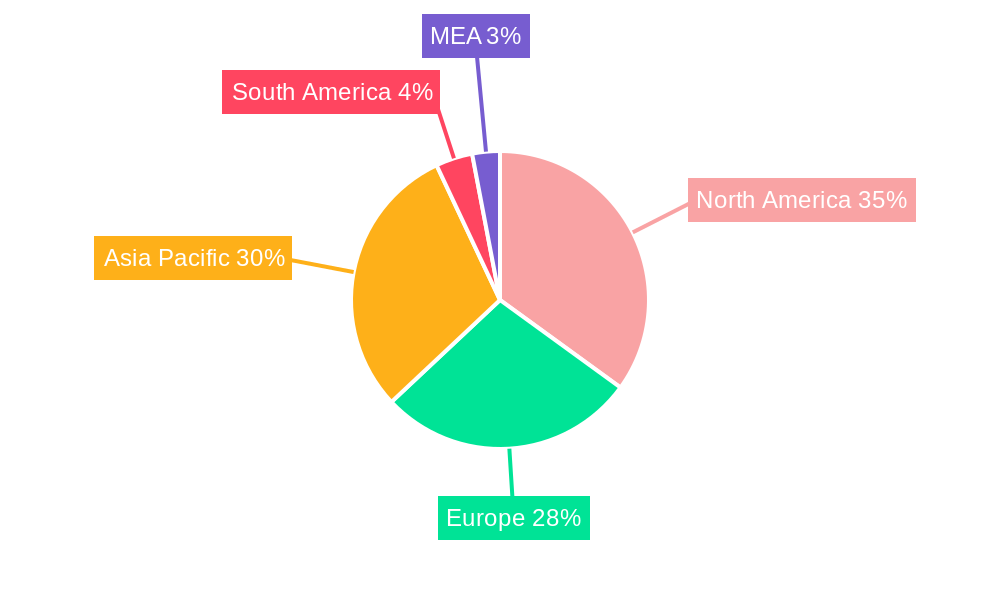
The market's geographical distribution shows a strong presence in North America, Europe, and the Asia-Pacific region, with China, the US, and other major economies leading the adoption. The robust growth is expected to continue across all regions, albeit at varying rates, driven by regional technological advancements, economic development, and increasing digitalization. Companies like II-VI Incorporated, Huawei Technologies, Molex, Cisco Systems, and others are key players driving innovation and competition within the market. Future growth will be influenced by advancements in technologies like silicon photonics, coherent optical communication, and the development of cost-effective and high-performance optical interconnect solutions, further shaping the competitive landscape.
Optical Interconnect Market: A Comprehensive Report (2019-2033)
This in-depth report provides a comprehensive analysis of the Optical Interconnect Market, encompassing market dynamics, growth trends, regional dominance, product landscape, key players, and future outlook. The study period covers 2019-2033, with 2025 as the base and estimated year. The report is crucial for industry professionals, investors, and strategic decision-makers seeking to understand this rapidly evolving market. Market values are presented in million units.
Optical Interconnect Market Dynamics & Structure
The Optical Interconnect Market is characterized by a moderately concentrated structure, with key players like II-VI Incorporated, Huawei Technologies Co Ltd, Molex LLC, Cisco Systems Inc, and 3M Company holding significant market share. The market is driven by technological advancements, particularly in high-speed data transmission, increasing demand for faster internet speeds, and growing adoption of cloud computing and data centers. Stringent regulatory frameworks regarding data security and network reliability influence market growth. Competitive product substitutes, such as copper cabling, exist but are increasingly challenged by the superior bandwidth and longer reach of optical interconnects. The end-user demographic spans telecommunication companies, data centers, and various industries utilizing high-speed data transmission. Mergers and acquisitions (M&A) activity in the sector has been moderate, with strategic partnerships increasingly common, aiming for technological synergy and expansion into new markets.
- Market Concentration: Moderately concentrated, with top 5 players holding approximately xx% market share in 2024.
- Technological Innovation: Focus on higher bandwidth, lower latency, and improved energy efficiency drives innovation.
- Regulatory Frameworks: Compliance with industry standards and data security regulations influences adoption.
- Competitive Substitutes: Copper cabling presents a substitute but with limitations in bandwidth and distance.
- End-User Demographics: Telecommunication, data centers, industrial automation, and healthcare are major end-users.
- M&A Trends: Moderate M&A activity, with strategic partnerships becoming increasingly prevalent.
Optical Interconnect Market Growth Trends & Insights
The Optical Interconnect Market exhibited robust growth during the historical period (2019-2024), driven by the expansion of 5G networks, increasing adoption of cloud services, and the rise of high-performance computing. The market is expected to continue its expansion at a Compound Annual Growth Rate (CAGR) of xx% during the forecast period (2025-2033). This growth is fueled by the continued demand for higher bandwidth and lower latency in data transmission, as well as the growing need for reliable and efficient optical connectivity in diverse applications. Technological disruptions, such as the development of silicon photonics and coherent optical transmission technologies, are accelerating market expansion. Shifting consumer behavior towards increased digital consumption and the proliferation of smart devices are further driving demand. Market penetration of optical interconnects continues to increase, particularly in the telecommunication and data center segments.
Dominant Regions, Countries, or Segments in Optical Interconnect Market
North America and Asia-Pacific are the leading regions in the Optical Interconnect Market, driven by strong investments in infrastructure development, rapid growth in data centers, and rising demand for high-speed connectivity. Within these regions, countries such as the United States, China, Japan, and South Korea exhibit the highest growth potential.
Type Segments:
- Optical Transceivers: This segment holds the largest market share, driven by the widespread adoption of high-speed data transmission technologies in telecommunication networks and data centers.
- Active Optical Cables (AOCs): The AOCs segment is experiencing significant growth owing to its advantages in terms of cost-effectiveness and ease of installation.
- Embedded Optical Modules (EOMs): This segment is showing promising growth, driven by the increasing demand for miniaturized and integrated optical solutions in various applications.
Application Segments:
- Telecommunication: The telecommunication sector is the largest application segment, driven by the deployment of 5G and other advanced communication technologies.
- Data Communication: The data communication segment is experiencing rapid growth, driven by the proliferation of cloud computing, big data, and high-performance computing.
Key Drivers:
- Substantial investments in 5G infrastructure.
- Rising demand for cloud computing and big data solutions.
- Growing adoption of high-speed data transmission technologies.
- Increasing need for efficient and reliable optical connectivity.
Optical Interconnect Market Product Landscape
The Optical Interconnect Market offers a diverse range of products, including optical transceivers with varying data rates (ranging from 100 Gbps to 800 Gbps and beyond), active optical cables (AOCs) with different lengths and connector types, and embedded optical modules (EOMs) designed for specific applications. These products incorporate advancements such as silicon photonics, coherent detection, and advanced packaging technologies, enabling higher bandwidth, lower power consumption, and improved performance. Unique selling propositions focus on factors like enhanced data rates, reduced latency, improved reliability, and simplified installation.
Key Drivers, Barriers & Challenges in Optical Interconnect Market
Key Drivers:
The market is primarily driven by the increasing demand for higher bandwidth and lower latency in data transmission, fueled by the growth of cloud computing, 5G networks, and the Internet of Things (IoT). Government initiatives promoting digital infrastructure development also contribute to market growth.
Key Challenges & Restraints:
High initial investment costs for optical interconnect infrastructure and the complexity of installation can pose barriers to entry for some market segments. Competition from alternative technologies, such as copper cabling, though diminishing, remains a challenge. Supply chain disruptions and fluctuations in raw material prices can impact production costs and market stability.
Emerging Opportunities in Optical Interconnect Market
Emerging opportunities lie in the development and adoption of next-generation optical interconnect technologies, such as silicon photonics and free-space optics, for applications in high-performance computing, data centers, and advanced telecommunication systems. The increasing demand for miniaturized and integrated optical solutions opens opportunities for EOMs in various applications, including consumer electronics, automotive, and industrial automation. Untapped markets in developing countries present significant growth potential.
Growth Accelerators in the Optical Interconnect Market Industry
Technological breakthroughs, particularly in silicon photonics and coherent optical transmission, are major growth catalysts. Strategic partnerships and collaborations between technology providers and network operators accelerate market expansion. Furthermore, market expansion strategies focusing on emerging markets and new applications contribute to long-term growth.
Key Players Shaping the Optical Interconnect Market Market
- II-VI Incorporated
- Huawei Technologies Co Ltd
- Molex LLC
- Cisco Systems Inc
- 3M Company
- Amphenol Corporation
- TE Connectivity Ltd
- Go!Foton Inc
- Corning Incorporated
- Sumitomo Electric Industries Ltd
Notable Milestones in Optical Interconnect Market Sector
- March 2021: Reflex Photonics secures a multimillion-dollar contract to supply SpaceABLE 28 optical modules for high-throughput communication satellites.
- 2019: Reflex Photonics launches LightCONEX active optical blind mate, compatible with the VITA 66.5 standard and SOSA consortium.
- July 2020: Vodafone New Zealand collaborates with Ciena Corporation to deploy an 800-Gbps data center interconnect, leveraging Ciena's WaveLogic 5 Extreme technology.
In-Depth Optical Interconnect Market Market Outlook
The Optical Interconnect Market is poised for continued strong growth, driven by technological advancements, increasing demand for high-bandwidth connectivity, and expansion into new applications. Strategic partnerships and investments in research and development will play a crucial role in shaping the future of the market. Opportunities exist in developing next-generation technologies and expanding into untapped markets, creating significant potential for long-term growth and profitability.
Optical Interconnect Market Segmentation
-
1. Type
- 1.1. Optical Transceivers
- 1.2. Active Optical Cables (AOCs)
- 1.3. Embedded Optical Modules (EOMs)
-
2. Application
- 2.1. Telecommunication
- 2.2. Data Communication
Optical Interconnect Market Segmentation By Geography
-
1. North America
- 1.1. United States
- 1.2. Canada
-
2. Europe
- 2.1. Germany
- 2.2. United Kingdom
- 2.3. France
- 2.4. Rest of Europe
-
3. Asia Pacific
- 3.1. India
- 3.2. China
- 3.3. Japan
- 3.4. Rest of Asia Pacific
- 4. Latin America
- 5. Middle East and Africa
Optical Interconnect Market REPORT HIGHLIGHTS
| Aspects | Details |
|---|---|
| Study Period | 2019-2033 |
| Base Year | 2024 |
| Estimated Year | 2025 |
| Forecast Period | 2025-2033 |
| Historical Period | 2019-2024 |
| Growth Rate | CAGR of 13.15% from 2019-2033 |
| Segmentation |
|
Table of Contents
- 1. Introduction
- 1.1. Research Scope
- 1.2. Market Segmentation
- 1.3. Research Methodology
- 1.4. Definitions and Assumptions
- 2. Executive Summary
- 2.1. Introduction
- 3. Market Dynamics
- 3.1. Introduction
- 3.2. Market Drivers
- 3.2.1 Increasing Demand for Communication Bandwidth Owing to Demand for Cloud Computing
- 3.2.2 AI
- 3.2.3 and HPC; Increasing Investment in Data Centers Interconnect and Fiber Optic Communication
- 3.3. Market Restrains
- 3.3.1. Slow Commercialization of Optical Interconnection Related Technologies
- 3.4. Market Trends
- 3.4.1. Data Communication is Expected to Spur the Demand for Optical Interconnects
- 4. Market Factor Analysis
- 4.1. Porters Five Forces
- 4.2. Supply/Value Chain
- 4.3. PESTEL analysis
- 4.4. Market Entropy
- 4.5. Patent/Trademark Analysis
- 5. Global Optical Interconnect Market Analysis, Insights and Forecast, 2019-2031
- 5.1. Market Analysis, Insights and Forecast - by Type
- 5.1.1. Optical Transceivers
- 5.1.2. Active Optical Cables (AOCs)
- 5.1.3. Embedded Optical Modules (EOMs)
- 5.2. Market Analysis, Insights and Forecast - by Application
- 5.2.1. Telecommunication
- 5.2.2. Data Communication
- 5.3. Market Analysis, Insights and Forecast - by Region
- 5.3.1. North America
- 5.3.2. Europe
- 5.3.3. Asia Pacific
- 5.3.4. Latin America
- 5.3.5. Middle East and Africa
- 5.1. Market Analysis, Insights and Forecast - by Type
- 6. North America Optical Interconnect Market Analysis, Insights and Forecast, 2019-2031
- 6.1. Market Analysis, Insights and Forecast - by Type
- 6.1.1. Optical Transceivers
- 6.1.2. Active Optical Cables (AOCs)
- 6.1.3. Embedded Optical Modules (EOMs)
- 6.2. Market Analysis, Insights and Forecast - by Application
- 6.2.1. Telecommunication
- 6.2.2. Data Communication
- 6.1. Market Analysis, Insights and Forecast - by Type
- 7. Europe Optical Interconnect Market Analysis, Insights and Forecast, 2019-2031
- 7.1. Market Analysis, Insights and Forecast - by Type
- 7.1.1. Optical Transceivers
- 7.1.2. Active Optical Cables (AOCs)
- 7.1.3. Embedded Optical Modules (EOMs)
- 7.2. Market Analysis, Insights and Forecast - by Application
- 7.2.1. Telecommunication
- 7.2.2. Data Communication
- 7.1. Market Analysis, Insights and Forecast - by Type
- 8. Asia Pacific Optical Interconnect Market Analysis, Insights and Forecast, 2019-2031
- 8.1. Market Analysis, Insights and Forecast - by Type
- 8.1.1. Optical Transceivers
- 8.1.2. Active Optical Cables (AOCs)
- 8.1.3. Embedded Optical Modules (EOMs)
- 8.2. Market Analysis, Insights and Forecast - by Application
- 8.2.1. Telecommunication
- 8.2.2. Data Communication
- 8.1. Market Analysis, Insights and Forecast - by Type
- 9. Latin America Optical Interconnect Market Analysis, Insights and Forecast, 2019-2031
- 9.1. Market Analysis, Insights and Forecast - by Type
- 9.1.1. Optical Transceivers
- 9.1.2. Active Optical Cables (AOCs)
- 9.1.3. Embedded Optical Modules (EOMs)
- 9.2. Market Analysis, Insights and Forecast - by Application
- 9.2.1. Telecommunication
- 9.2.2. Data Communication
- 9.1. Market Analysis, Insights and Forecast - by Type
- 10. Middle East and Africa Optical Interconnect Market Analysis, Insights and Forecast, 2019-2031
- 10.1. Market Analysis, Insights and Forecast - by Type
- 10.1.1. Optical Transceivers
- 10.1.2. Active Optical Cables (AOCs)
- 10.1.3. Embedded Optical Modules (EOMs)
- 10.2. Market Analysis, Insights and Forecast - by Application
- 10.2.1. Telecommunication
- 10.2.2. Data Communication
- 10.1. Market Analysis, Insights and Forecast - by Type
- 11. North America Optical Interconnect Market Analysis, Insights and Forecast, 2019-2031
- 11.1. Market Analysis, Insights and Forecast - By Country/Sub-region
- 11.1.1 United States
- 11.1.2 Canada
- 11.1.3 Mexico
- 12. Europe Optical Interconnect Market Analysis, Insights and Forecast, 2019-2031
- 12.1. Market Analysis, Insights and Forecast - By Country/Sub-region
- 12.1.1 Germany
- 12.1.2 United Kingdom
- 12.1.3 France
- 12.1.4 Spain
- 12.1.5 Italy
- 12.1.6 Spain
- 12.1.7 Belgium
- 12.1.8 Netherland
- 12.1.9 Nordics
- 12.1.10 Rest of Europe
- 13. Asia Pacific Optical Interconnect Market Analysis, Insights and Forecast, 2019-2031
- 13.1. Market Analysis, Insights and Forecast - By Country/Sub-region
- 13.1.1 China
- 13.1.2 Japan
- 13.1.3 India
- 13.1.4 South Korea
- 13.1.5 Southeast Asia
- 13.1.6 Australia
- 13.1.7 Indonesia
- 13.1.8 Phillipes
- 13.1.9 Singapore
- 13.1.10 Thailandc
- 13.1.11 Rest of Asia Pacific
- 14. South America Optical Interconnect Market Analysis, Insights and Forecast, 2019-2031
- 14.1. Market Analysis, Insights and Forecast - By Country/Sub-region
- 14.1.1 Brazil
- 14.1.2 Argentina
- 14.1.3 Peru
- 14.1.4 Chile
- 14.1.5 Colombia
- 14.1.6 Ecuador
- 14.1.7 Venezuela
- 14.1.8 Rest of South America
- 15. North America Optical Interconnect Market Analysis, Insights and Forecast, 2019-2031
- 15.1. Market Analysis, Insights and Forecast - By Country/Sub-region
- 15.1.1 United States
- 15.1.2 Canada
- 15.1.3 Mexico
- 16. MEA Optical Interconnect Market Analysis, Insights and Forecast, 2019-2031
- 16.1. Market Analysis, Insights and Forecast - By Country/Sub-region
- 16.1.1 United Arab Emirates
- 16.1.2 Saudi Arabia
- 16.1.3 South Africa
- 16.1.4 Rest of Middle East and Africa
- 17. Competitive Analysis
- 17.1. Global Market Share Analysis 2024
- 17.2. Company Profiles
- 17.2.1 II-VI Incorporated
- 17.2.1.1. Overview
- 17.2.1.2. Products
- 17.2.1.3. SWOT Analysis
- 17.2.1.4. Recent Developments
- 17.2.1.5. Financials (Based on Availability)
- 17.2.2 Huawei Technologies Co Lt
- 17.2.2.1. Overview
- 17.2.2.2. Products
- 17.2.2.3. SWOT Analysis
- 17.2.2.4. Recent Developments
- 17.2.2.5. Financials (Based on Availability)
- 17.2.3 Molex LLC
- 17.2.3.1. Overview
- 17.2.3.2. Products
- 17.2.3.3. SWOT Analysis
- 17.2.3.4. Recent Developments
- 17.2.3.5. Financials (Based on Availability)
- 17.2.4 Cisco Systems Inc
- 17.2.4.1. Overview
- 17.2.4.2. Products
- 17.2.4.3. SWOT Analysis
- 17.2.4.4. Recent Developments
- 17.2.4.5. Financials (Based on Availability)
- 17.2.5 3M Company
- 17.2.5.1. Overview
- 17.2.5.2. Products
- 17.2.5.3. SWOT Analysis
- 17.2.5.4. Recent Developments
- 17.2.5.5. Financials (Based on Availability)
- 17.2.6 Amphenol Corporation
- 17.2.6.1. Overview
- 17.2.6.2. Products
- 17.2.6.3. SWOT Analysis
- 17.2.6.4. Recent Developments
- 17.2.6.5. Financials (Based on Availability)
- 17.2.7 TE Connectivity Ltd
- 17.2.7.1. Overview
- 17.2.7.2. Products
- 17.2.7.3. SWOT Analysis
- 17.2.7.4. Recent Developments
- 17.2.7.5. Financials (Based on Availability)
- 17.2.8 Go!Foton Inc
- 17.2.8.1. Overview
- 17.2.8.2. Products
- 17.2.8.3. SWOT Analysis
- 17.2.8.4. Recent Developments
- 17.2.8.5. Financials (Based on Availability)
- 17.2.9 Corning Incorporated
- 17.2.9.1. Overview
- 17.2.9.2. Products
- 17.2.9.3. SWOT Analysis
- 17.2.9.4. Recent Developments
- 17.2.9.5. Financials (Based on Availability)
- 17.2.10 Sumitomo Electric Industries Ltd
- 17.2.10.1. Overview
- 17.2.10.2. Products
- 17.2.10.3. SWOT Analysis
- 17.2.10.4. Recent Developments
- 17.2.10.5. Financials (Based on Availability)
- 17.2.1 II-VI Incorporated
List of Figures
- Figure 1: Global Optical Interconnect Market Revenue Breakdown (Million, %) by Region 2024 & 2032
- Figure 2: North America Optical Interconnect Market Revenue (Million), by Country 2024 & 2032
- Figure 3: North America Optical Interconnect Market Revenue Share (%), by Country 2024 & 2032
- Figure 4: Europe Optical Interconnect Market Revenue (Million), by Country 2024 & 2032
- Figure 5: Europe Optical Interconnect Market Revenue Share (%), by Country 2024 & 2032
- Figure 6: Asia Pacific Optical Interconnect Market Revenue (Million), by Country 2024 & 2032
- Figure 7: Asia Pacific Optical Interconnect Market Revenue Share (%), by Country 2024 & 2032
- Figure 8: South America Optical Interconnect Market Revenue (Million), by Country 2024 & 2032
- Figure 9: South America Optical Interconnect Market Revenue Share (%), by Country 2024 & 2032
- Figure 10: North America Optical Interconnect Market Revenue (Million), by Country 2024 & 2032
- Figure 11: North America Optical Interconnect Market Revenue Share (%), by Country 2024 & 2032
- Figure 12: MEA Optical Interconnect Market Revenue (Million), by Country 2024 & 2032
- Figure 13: MEA Optical Interconnect Market Revenue Share (%), by Country 2024 & 2032
- Figure 14: North America Optical Interconnect Market Revenue (Million), by Type 2024 & 2032
- Figure 15: North America Optical Interconnect Market Revenue Share (%), by Type 2024 & 2032
- Figure 16: North America Optical Interconnect Market Revenue (Million), by Application 2024 & 2032
- Figure 17: North America Optical Interconnect Market Revenue Share (%), by Application 2024 & 2032
- Figure 18: North America Optical Interconnect Market Revenue (Million), by Country 2024 & 2032
- Figure 19: North America Optical Interconnect Market Revenue Share (%), by Country 2024 & 2032
- Figure 20: Europe Optical Interconnect Market Revenue (Million), by Type 2024 & 2032
- Figure 21: Europe Optical Interconnect Market Revenue Share (%), by Type 2024 & 2032
- Figure 22: Europe Optical Interconnect Market Revenue (Million), by Application 2024 & 2032
- Figure 23: Europe Optical Interconnect Market Revenue Share (%), by Application 2024 & 2032
- Figure 24: Europe Optical Interconnect Market Revenue (Million), by Country 2024 & 2032
- Figure 25: Europe Optical Interconnect Market Revenue Share (%), by Country 2024 & 2032
- Figure 26: Asia Pacific Optical Interconnect Market Revenue (Million), by Type 2024 & 2032
- Figure 27: Asia Pacific Optical Interconnect Market Revenue Share (%), by Type 2024 & 2032
- Figure 28: Asia Pacific Optical Interconnect Market Revenue (Million), by Application 2024 & 2032
- Figure 29: Asia Pacific Optical Interconnect Market Revenue Share (%), by Application 2024 & 2032
- Figure 30: Asia Pacific Optical Interconnect Market Revenue (Million), by Country 2024 & 2032
- Figure 31: Asia Pacific Optical Interconnect Market Revenue Share (%), by Country 2024 & 2032
- Figure 32: Latin America Optical Interconnect Market Revenue (Million), by Type 2024 & 2032
- Figure 33: Latin America Optical Interconnect Market Revenue Share (%), by Type 2024 & 2032
- Figure 34: Latin America Optical Interconnect Market Revenue (Million), by Application 2024 & 2032
- Figure 35: Latin America Optical Interconnect Market Revenue Share (%), by Application 2024 & 2032
- Figure 36: Latin America Optical Interconnect Market Revenue (Million), by Country 2024 & 2032
- Figure 37: Latin America Optical Interconnect Market Revenue Share (%), by Country 2024 & 2032
- Figure 38: Middle East and Africa Optical Interconnect Market Revenue (Million), by Type 2024 & 2032
- Figure 39: Middle East and Africa Optical Interconnect Market Revenue Share (%), by Type 2024 & 2032
- Figure 40: Middle East and Africa Optical Interconnect Market Revenue (Million), by Application 2024 & 2032
- Figure 41: Middle East and Africa Optical Interconnect Market Revenue Share (%), by Application 2024 & 2032
- Figure 42: Middle East and Africa Optical Interconnect Market Revenue (Million), by Country 2024 & 2032
- Figure 43: Middle East and Africa Optical Interconnect Market Revenue Share (%), by Country 2024 & 2032
List of Tables
- Table 1: Global Optical Interconnect Market Revenue Million Forecast, by Region 2019 & 2032
- Table 2: Global Optical Interconnect Market Revenue Million Forecast, by Type 2019 & 2032
- Table 3: Global Optical Interconnect Market Revenue Million Forecast, by Application 2019 & 2032
- Table 4: Global Optical Interconnect Market Revenue Million Forecast, by Region 2019 & 2032
- Table 5: Global Optical Interconnect Market Revenue Million Forecast, by Country 2019 & 2032
- Table 6: United States Optical Interconnect Market Revenue (Million) Forecast, by Application 2019 & 2032
- Table 7: Canada Optical Interconnect Market Revenue (Million) Forecast, by Application 2019 & 2032
- Table 8: Mexico Optical Interconnect Market Revenue (Million) Forecast, by Application 2019 & 2032
- Table 9: Global Optical Interconnect Market Revenue Million Forecast, by Country 2019 & 2032
- Table 10: Germany Optical Interconnect Market Revenue (Million) Forecast, by Application 2019 & 2032
- Table 11: United Kingdom Optical Interconnect Market Revenue (Million) Forecast, by Application 2019 & 2032
- Table 12: France Optical Interconnect Market Revenue (Million) Forecast, by Application 2019 & 2032
- Table 13: Spain Optical Interconnect Market Revenue (Million) Forecast, by Application 2019 & 2032
- Table 14: Italy Optical Interconnect Market Revenue (Million) Forecast, by Application 2019 & 2032
- Table 15: Spain Optical Interconnect Market Revenue (Million) Forecast, by Application 2019 & 2032
- Table 16: Belgium Optical Interconnect Market Revenue (Million) Forecast, by Application 2019 & 2032
- Table 17: Netherland Optical Interconnect Market Revenue (Million) Forecast, by Application 2019 & 2032
- Table 18: Nordics Optical Interconnect Market Revenue (Million) Forecast, by Application 2019 & 2032
- Table 19: Rest of Europe Optical Interconnect Market Revenue (Million) Forecast, by Application 2019 & 2032
- Table 20: Global Optical Interconnect Market Revenue Million Forecast, by Country 2019 & 2032
- Table 21: China Optical Interconnect Market Revenue (Million) Forecast, by Application 2019 & 2032
- Table 22: Japan Optical Interconnect Market Revenue (Million) Forecast, by Application 2019 & 2032
- Table 23: India Optical Interconnect Market Revenue (Million) Forecast, by Application 2019 & 2032
- Table 24: South Korea Optical Interconnect Market Revenue (Million) Forecast, by Application 2019 & 2032
- Table 25: Southeast Asia Optical Interconnect Market Revenue (Million) Forecast, by Application 2019 & 2032
- Table 26: Australia Optical Interconnect Market Revenue (Million) Forecast, by Application 2019 & 2032
- Table 27: Indonesia Optical Interconnect Market Revenue (Million) Forecast, by Application 2019 & 2032
- Table 28: Phillipes Optical Interconnect Market Revenue (Million) Forecast, by Application 2019 & 2032
- Table 29: Singapore Optical Interconnect Market Revenue (Million) Forecast, by Application 2019 & 2032
- Table 30: Thailandc Optical Interconnect Market Revenue (Million) Forecast, by Application 2019 & 2032
- Table 31: Rest of Asia Pacific Optical Interconnect Market Revenue (Million) Forecast, by Application 2019 & 2032
- Table 32: Global Optical Interconnect Market Revenue Million Forecast, by Country 2019 & 2032
- Table 33: Brazil Optical Interconnect Market Revenue (Million) Forecast, by Application 2019 & 2032
- Table 34: Argentina Optical Interconnect Market Revenue (Million) Forecast, by Application 2019 & 2032
- Table 35: Peru Optical Interconnect Market Revenue (Million) Forecast, by Application 2019 & 2032
- Table 36: Chile Optical Interconnect Market Revenue (Million) Forecast, by Application 2019 & 2032
- Table 37: Colombia Optical Interconnect Market Revenue (Million) Forecast, by Application 2019 & 2032
- Table 38: Ecuador Optical Interconnect Market Revenue (Million) Forecast, by Application 2019 & 2032
- Table 39: Venezuela Optical Interconnect Market Revenue (Million) Forecast, by Application 2019 & 2032
- Table 40: Rest of South America Optical Interconnect Market Revenue (Million) Forecast, by Application 2019 & 2032
- Table 41: Global Optical Interconnect Market Revenue Million Forecast, by Country 2019 & 2032
- Table 42: United States Optical Interconnect Market Revenue (Million) Forecast, by Application 2019 & 2032
- Table 43: Canada Optical Interconnect Market Revenue (Million) Forecast, by Application 2019 & 2032
- Table 44: Mexico Optical Interconnect Market Revenue (Million) Forecast, by Application 2019 & 2032
- Table 45: Global Optical Interconnect Market Revenue Million Forecast, by Country 2019 & 2032
- Table 46: United Arab Emirates Optical Interconnect Market Revenue (Million) Forecast, by Application 2019 & 2032
- Table 47: Saudi Arabia Optical Interconnect Market Revenue (Million) Forecast, by Application 2019 & 2032
- Table 48: South Africa Optical Interconnect Market Revenue (Million) Forecast, by Application 2019 & 2032
- Table 49: Rest of Middle East and Africa Optical Interconnect Market Revenue (Million) Forecast, by Application 2019 & 2032
- Table 50: Global Optical Interconnect Market Revenue Million Forecast, by Type 2019 & 2032
- Table 51: Global Optical Interconnect Market Revenue Million Forecast, by Application 2019 & 2032
- Table 52: Global Optical Interconnect Market Revenue Million Forecast, by Country 2019 & 2032
- Table 53: United States Optical Interconnect Market Revenue (Million) Forecast, by Application 2019 & 2032
- Table 54: Canada Optical Interconnect Market Revenue (Million) Forecast, by Application 2019 & 2032
- Table 55: Global Optical Interconnect Market Revenue Million Forecast, by Type 2019 & 2032
- Table 56: Global Optical Interconnect Market Revenue Million Forecast, by Application 2019 & 2032
- Table 57: Global Optical Interconnect Market Revenue Million Forecast, by Country 2019 & 2032
- Table 58: Germany Optical Interconnect Market Revenue (Million) Forecast, by Application 2019 & 2032
- Table 59: United Kingdom Optical Interconnect Market Revenue (Million) Forecast, by Application 2019 & 2032
- Table 60: France Optical Interconnect Market Revenue (Million) Forecast, by Application 2019 & 2032
- Table 61: Rest of Europe Optical Interconnect Market Revenue (Million) Forecast, by Application 2019 & 2032
- Table 62: Global Optical Interconnect Market Revenue Million Forecast, by Type 2019 & 2032
- Table 63: Global Optical Interconnect Market Revenue Million Forecast, by Application 2019 & 2032
- Table 64: Global Optical Interconnect Market Revenue Million Forecast, by Country 2019 & 2032
- Table 65: India Optical Interconnect Market Revenue (Million) Forecast, by Application 2019 & 2032
- Table 66: China Optical Interconnect Market Revenue (Million) Forecast, by Application 2019 & 2032
- Table 67: Japan Optical Interconnect Market Revenue (Million) Forecast, by Application 2019 & 2032
- Table 68: Rest of Asia Pacific Optical Interconnect Market Revenue (Million) Forecast, by Application 2019 & 2032
- Table 69: Global Optical Interconnect Market Revenue Million Forecast, by Type 2019 & 2032
- Table 70: Global Optical Interconnect Market Revenue Million Forecast, by Application 2019 & 2032
- Table 71: Global Optical Interconnect Market Revenue Million Forecast, by Country 2019 & 2032
- Table 72: Global Optical Interconnect Market Revenue Million Forecast, by Type 2019 & 2032
- Table 73: Global Optical Interconnect Market Revenue Million Forecast, by Application 2019 & 2032
- Table 74: Global Optical Interconnect Market Revenue Million Forecast, by Country 2019 & 2032
Frequently Asked Questions
1. What is the projected Compound Annual Growth Rate (CAGR) of the Optical Interconnect Market?
The projected CAGR is approximately 13.15%.
2. Which companies are prominent players in the Optical Interconnect Market?
Key companies in the market include II-VI Incorporated, Huawei Technologies Co Lt, Molex LLC, Cisco Systems Inc, 3M Company, Amphenol Corporation, TE Connectivity Ltd, Go!Foton Inc, Corning Incorporated, Sumitomo Electric Industries Ltd.
3. What are the main segments of the Optical Interconnect Market?
The market segments include Type, Application.
4. Can you provide details about the market size?
The market size is estimated to be USD 17.14 Million as of 2022.
5. What are some drivers contributing to market growth?
Increasing Demand for Communication Bandwidth Owing to Demand for Cloud Computing. AI. and HPC; Increasing Investment in Data Centers Interconnect and Fiber Optic Communication.
6. What are the notable trends driving market growth?
Data Communication is Expected to Spur the Demand for Optical Interconnects.
7. Are there any restraints impacting market growth?
Slow Commercialization of Optical Interconnection Related Technologies.
8. Can you provide examples of recent developments in the market?
March 2021 - Canada-based Reflex Photonics was awarded a multimillion-dollar contract to deliver thousands of SpaceABLE 28 optical module devices to be used in high-throughput communication satellites (HTCS) that may be deployed in geostationary orbit. Building on the recognized robustness inherent in the design of Reflex Photonics' optical modules, the SpaceABLE28 line may provide radiation-resistant optical interconnect modules tested and qualified for use in harsh space environment. In 2019, the company launched new LightCONEX active optical blind mate that interconnects compatible with the upcoming VITA 66.5 standard and supported by the Sensor Open System Architecture (SOSA) consortium.
9. What pricing options are available for accessing the report?
Pricing options include single-user, multi-user, and enterprise licenses priced at USD 4750, USD 5250, and USD 8750 respectively.
10. Is the market size provided in terms of value or volume?
The market size is provided in terms of value, measured in Million.
11. Are there any specific market keywords associated with the report?
Yes, the market keyword associated with the report is "Optical Interconnect Market," which aids in identifying and referencing the specific market segment covered.
12. How do I determine which pricing option suits my needs best?
The pricing options vary based on user requirements and access needs. Individual users may opt for single-user licenses, while businesses requiring broader access may choose multi-user or enterprise licenses for cost-effective access to the report.
13. Are there any additional resources or data provided in the Optical Interconnect Market report?
While the report offers comprehensive insights, it's advisable to review the specific contents or supplementary materials provided to ascertain if additional resources or data are available.
14. How can I stay updated on further developments or reports in the Optical Interconnect Market?
To stay informed about further developments, trends, and reports in the Optical Interconnect Market, consider subscribing to industry newsletters, following relevant companies and organizations, or regularly checking reputable industry news sources and publications.
Methodology
Step 1 - Identification of Relevant Samples Size from Population Database


Step 2 - Approaches for Defining Global Market Size (Value, Volume* & Price*)

Note*: In applicable scenarios
Step 3 - Data Sources
Primary Research
- Web Analytics
- Survey Reports
- Research Institute
- Latest Research Reports
- Opinion Leaders
Secondary Research
- Annual Reports
- White Paper
- Latest Press Release
- Industry Association
- Paid Database
- Investor Presentations

Step 4 - Data Triangulation
Involves using different sources of information in order to increase the validity of a study
These sources are likely to be stakeholders in a program - participants, other researchers, program staff, other community members, and so on.
Then we put all data in single framework & apply various statistical tools to find out the dynamic on the market.
During the analysis stage, feedback from the stakeholder groups would be compared to determine areas of agreement as well as areas of divergence


