
Key Insights
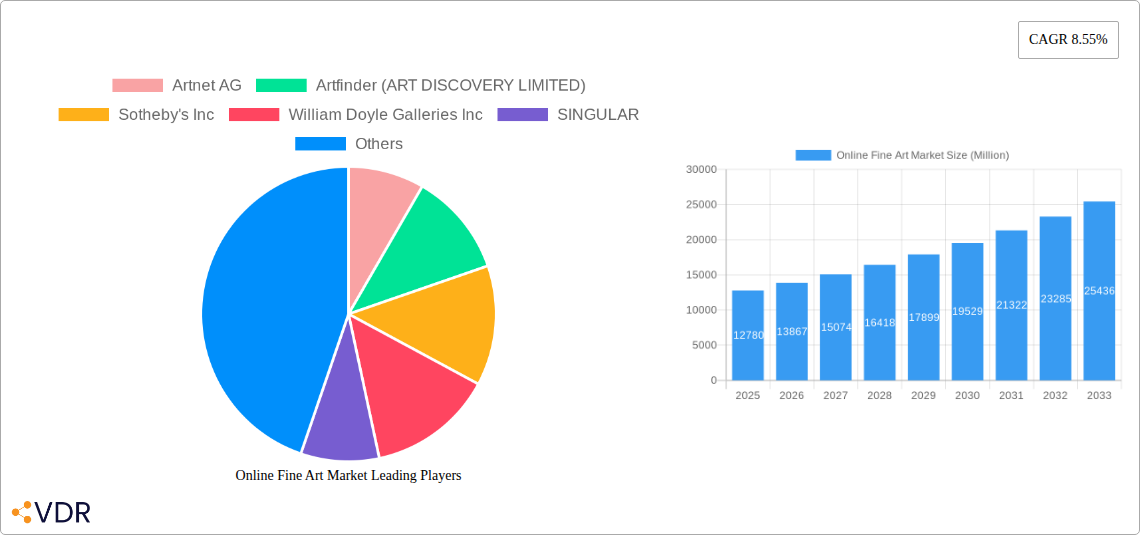
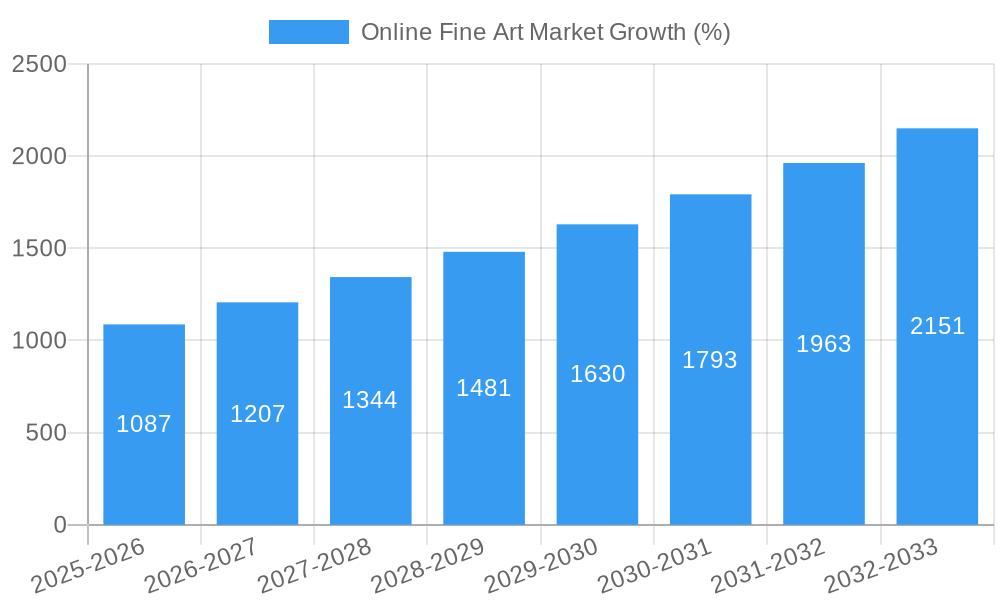
The online fine art market, currently valued at $12.78 billion in 2025, is experiencing robust growth, projected to expand at a compound annual growth rate (CAGR) of 8.55% from 2025 to 2033. This growth is driven by several key factors. Increased internet penetration and the growing comfort level of art collectors with online platforms are significantly boosting market expansion. The convenience of accessing a global inventory of artworks, coupled with the transparency offered by online auction houses and galleries, attracts both seasoned collectors and new entrants to the market. Furthermore, innovative technologies, such as virtual reality (VR) and augmented reality (AR), are enhancing the online viewing experience, enabling potential buyers to examine artworks in detail before purchase, reducing the risk associated with online transactions. The market is segmented by price range, sales channel (dealers vs. auctions), art medium (painting, sculpture, etc.), and art sector (Post-War & Contemporary, Modern, Impressionist, etc.), offering diverse avenues for growth. The presence of established players like Sotheby's and Christie's alongside emerging online-only platforms like Artfinder and Saatchi Online reflects the market's dynamic and competitive landscape. Geographic expansion, particularly in Asia-Pacific regions with burgeoning wealth and an increasing appreciation for art, represents a significant future growth opportunity. However, challenges remain, including concerns about authenticity verification, the need for robust security measures to prevent fraud, and regulatory uncertainties in certain regions.
Despite these challenges, the online fine art market's future remains bright. The ongoing technological advancements, coupled with the changing preferences of art collectors towards digital platforms, suggest that the market will continue its upward trajectory. The expansion into new geographic regions, the development of more sophisticated authentication and security protocols, and the increasing acceptance of digital art forms will all contribute to future growth. Competition among established and emerging players will likely intensify, leading to further innovation and potentially lower transaction costs for buyers. This ultimately benefits the market's accessibility and long-term sustainability. The successful navigation of these opportunities and challenges will determine the pace of future growth within this dynamic sector.
Online Fine Art Market Report: 2019-2033
This comprehensive report provides a detailed analysis of the online fine art market, encompassing market dynamics, growth trends, key players, and future outlook. With a study period spanning 2019-2033, a base year of 2025, and a forecast period of 2025-2033, this report is an invaluable resource for industry professionals, investors, and anyone seeking to understand this dynamic market. The report segments the market by price range, channel, medium, and sector, offering granular insights into various aspects of the online art world. The total market size is predicted to reach xx Million by 2033.
Online Fine Art Market Dynamics & Structure
The online fine art market is experiencing significant growth, driven by technological advancements, changing consumer preferences, and increasing accessibility. Market concentration is moderate, with several key players vying for dominance. However, the market is also characterized by a large number of smaller players, particularly in the online gallery space. Technological innovation, including blockchain for provenance verification and AI-powered art recommendation systems, is a key driver. Regulatory frameworks surrounding authenticity, taxation, and cross-border transactions remain a key challenge, impacting market growth. The competitive landscape includes both online-only platforms and traditional auction houses expanding their online presence.
- Market Concentration: Moderate, with a few dominant players and numerous smaller participants. Top 5 players hold an estimated xx% market share in 2025.
- Technological Innovation: Blockchain for provenance, AI for recommendations, VR/AR for virtual viewing experiences are key drivers.
- Regulatory Frameworks: Vary widely across regions, creating barriers to cross-border transactions and impacting market standardization.
- Competitive Product Substitutes: Limited direct substitutes, but alternative investment options and physical art markets remain competitive forces.
- End-User Demographics: Primarily affluent individuals and institutions, with a growing younger demographic entering the market.
- M&A Trends: Consolidation is expected to continue, with larger players acquiring smaller platforms to expand their reach and offerings. An estimated xx M&A deals were recorded between 2019 and 2024.
Online Fine Art Market Growth Trends & Insights
The online fine art market has exhibited robust growth throughout the historical period (2019-2024), driven by increasing internet penetration, the rise of e-commerce, and a shift in consumer behavior towards digital channels. The market size expanded from xx Million in 2019 to xx Million in 2024, showcasing a significant Compound Annual Growth Rate (CAGR) of xx%. This growth is anticipated to continue in the forecast period (2025-2033), with the market expected to reach xx Million by 2033. Technological disruptions, particularly advancements in digital art and NFTs, have further fueled market expansion. The adoption rate of online art platforms is increasing steadily, with a larger segment of collectors and art enthusiasts embracing online purchasing and viewing experiences. Consumer behavior shifts are apparent, with a growing preference for convenience, transparency, and broader access to art.
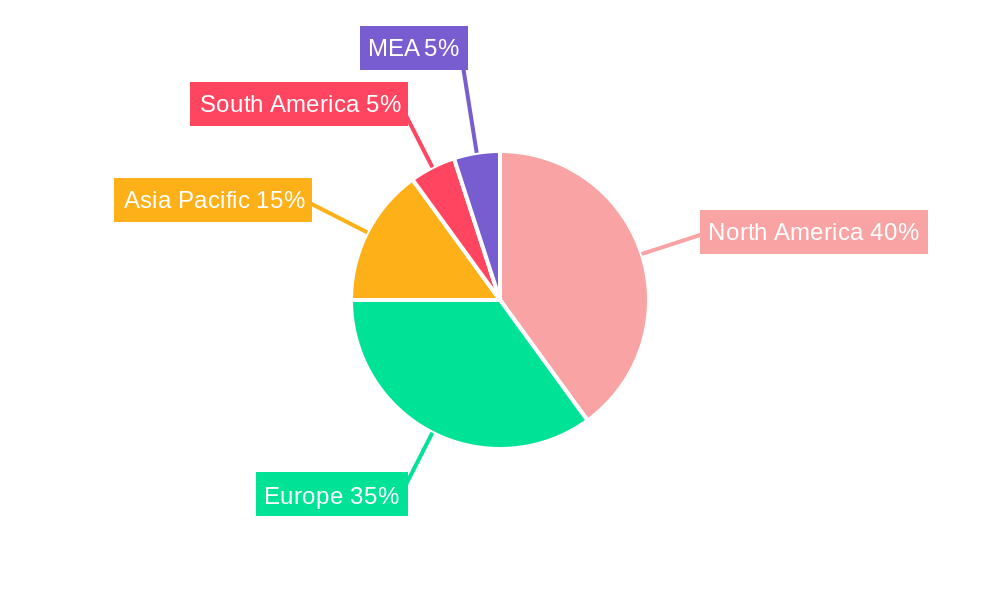
Dominant Regions, Countries, or Segments in Online Fine Art Market
The United States and Europe continue to dominate the online fine art market, accounting for the largest market share in 2025. However, Asia-Pacific is demonstrating significant growth potential, fueled by a rising affluent population and increased internet penetration.
By Price Range: The USD 5k - USD 50k segment is currently the largest, accounting for xx% of total market value, followed by the segment USD 50K - USD 250K. However, the segment above USD 1 Million exhibits the highest growth potential.
By Channel: Auctions currently hold a larger share of the market than dealers. However, online galleries and dealer platforms are expanding rapidly.
By Medium: Painting remains the most popular medium, followed by sculptures and other mediums such as photography and digital art.
By Sector: Post-War and Contemporary art dominates the market, with Modern and Impressionist/Post-Impressionist art also holding significant market shares.
- Key Drivers: Economic growth in key regions, increased internet penetration, rising disposable incomes, and technological advancements.
- Dominance Factors: Established market presence, strong brand recognition, wide range of offerings, and sophisticated marketing strategies.
Online Fine Art Market Product Landscape
The online fine art market offers a diverse range of products and services, including online auctions, curated online galleries, art marketplaces, and digital art platforms. These platforms provide various features, such as high-resolution images, detailed art descriptions, secure payment gateways, and provenance verification tools. Recent innovations include virtual reality (VR) and augmented reality (AR) technologies, allowing for immersive viewing experiences. The key differentiators between platforms include curated collections, ease of use, secure transaction processes, and sophisticated search functionalities.
Key Drivers, Barriers & Challenges in Online Fine Art Market
Key Drivers: Technological advancements such as AI-powered search, blockchain for provenance, and improved digital image quality, coupled with increased internet penetration and growing demand for convenient art acquisition.
Challenges: Concerns regarding authenticity and forgery, logistical complexities of shipping and handling artworks, regulatory uncertainties related to cross-border transactions, and the need for establishing trust and transparency within the online environment. These factors may reduce market growth by an estimated xx% annually if not properly addressed.
Emerging Opportunities in Online Fine Art Market
Emerging opportunities include the expansion of the digital art market, particularly NFTs, the growing demand for art financing solutions, the increasing adoption of virtual reality (VR) and augmented reality (AR) technologies for immersive viewing experiences, and the penetration of online art into emerging markets. The integration of AI-powered tools for art appraisal and authentication will create more transparency and efficiency.
Growth Accelerators in the Online Fine Art Market Industry
Strategic partnerships between online platforms and traditional auction houses, coupled with technological advancements in areas like AI-powered art authentication and blockchain-based provenance tracking, are expected to drive significant growth. Market expansion into emerging markets and the continued evolution of digital art formats, particularly NFTs, present significant long-term growth opportunities.
Key Players Shaping the Online Fine Art Market Market
- Artnet AG
- Artfinder (ART DISCOVERY LIMITED)
- Sotheby's Inc
- William Doyle Galleries Inc
- SINGULAR
- Kooness
- Saatchi Online Inc
- Artellite Limited
- Artsy
- Christie's
- Catawiki B V
- The Artling Pte Ltd
- Invaluable LLC
- Auction Technology Group PLC (thesaleroom.com)
Notable Milestones in Online Fine Art Market Sector
- August 2023: Phillips launches Dropshop, an e-commerce platform for selling fine art online, expanding its reach and diversifying its portfolio.
- May 2023: Artnet partners with Luxury Asset Capital to offer financial services to its clients, leveraging art as loan collateral.
In-Depth Online Fine Art Market Market Outlook
The online fine art market is poised for significant growth in the coming years, driven by continued technological innovation, increased market penetration in emerging economies, and the expanding acceptance of digital art formats. Strategic partnerships and the development of robust, trustworthy platforms will be crucial factors in shaping the future of the market. The potential for market expansion is vast, with untapped opportunities in various segments and regions.
Online Fine Art Market Segmentation
-
1. Channel
- 1.1. Dealers
- 1.2. Auctions
-
2. Medium
- 2.1. Painting
- 2.2. Sculptures
- 2.3. Others
-
3. Sector
- 3.1. Post-War and Contemporary
- 3.2. Modern
- 3.3. Impressionist and Post Impressionist
- 3.4. Others
Online Fine Art Market Segmentation By Geography
- 1. North America
- 2. Europe
- 3. Asia
- 4. Latin America
- 5. Middle East and Africa
Online Fine Art Market REPORT HIGHLIGHTS
| Aspects | Details |
|---|---|
| Study Period | 2019-2033 |
| Base Year | 2024 |
| Estimated Year | 2025 |
| Forecast Period | 2025-2033 |
| Historical Period | 2019-2024 |
| Growth Rate | CAGR of 8.55% from 2019-2033 |
| Segmentation |
|
Table of Contents
- 1. Introduction
- 1.1. Research Scope
- 1.2. Market Segmentation
- 1.3. Research Methodology
- 1.4. Definitions and Assumptions
- 2. Executive Summary
- 2.1. Introduction
- 3. Market Dynamics
- 3.1. Introduction
- 3.2. Market Drivers
- 3.2.1. Ease of Convenience of Shoppers Elevated Through No Traveling and Simpler Access Across Global Borders; Higher Return on Investment
- 3.3. Market Restrains
- 3.3.1 Incidents of Fraudulent Transactions and Cyber Crime; Opening of Physical Spaces
- 3.3.2 Galleries
- 3.3.3 and Auctions Impacting Online Sales
- 3.4. Market Trends
- 3.4.1. Dealers to Hold Major Share in the Channel Segment
- 4. Market Factor Analysis
- 4.1. Porters Five Forces
- 4.2. Supply/Value Chain
- 4.3. PESTEL analysis
- 4.4. Market Entropy
- 4.5. Patent/Trademark Analysis
- 5. Global Online Fine Art Market Analysis, Insights and Forecast, 2019-2031
- 5.1. Market Analysis, Insights and Forecast - by Channel
- 5.1.1. Dealers
- 5.1.2. Auctions
- 5.2. Market Analysis, Insights and Forecast - by Medium
- 5.2.1. Painting
- 5.2.2. Sculptures
- 5.2.3. Others
- 5.3. Market Analysis, Insights and Forecast - by Sector
- 5.3.1. Post-War and Contemporary
- 5.3.2. Modern
- 5.3.3. Impressionist and Post Impressionist
- 5.3.4. Others
- 5.4. Market Analysis, Insights and Forecast - by Region
- 5.4.1. North America
- 5.4.2. Europe
- 5.4.3. Asia
- 5.4.4. Latin America
- 5.4.5. Middle East and Africa
- 5.1. Market Analysis, Insights and Forecast - by Channel
- 6. North America Online Fine Art Market Analysis, Insights and Forecast, 2019-2031
- 6.1. Market Analysis, Insights and Forecast - by Channel
- 6.1.1. Dealers
- 6.1.2. Auctions
- 6.2. Market Analysis, Insights and Forecast - by Medium
- 6.2.1. Painting
- 6.2.2. Sculptures
- 6.2.3. Others
- 6.3. Market Analysis, Insights and Forecast - by Sector
- 6.3.1. Post-War and Contemporary
- 6.3.2. Modern
- 6.3.3. Impressionist and Post Impressionist
- 6.3.4. Others
- 6.1. Market Analysis, Insights and Forecast - by Channel
- 7. Europe Online Fine Art Market Analysis, Insights and Forecast, 2019-2031
- 7.1. Market Analysis, Insights and Forecast - by Channel
- 7.1.1. Dealers
- 7.1.2. Auctions
- 7.2. Market Analysis, Insights and Forecast - by Medium
- 7.2.1. Painting
- 7.2.2. Sculptures
- 7.2.3. Others
- 7.3. Market Analysis, Insights and Forecast - by Sector
- 7.3.1. Post-War and Contemporary
- 7.3.2. Modern
- 7.3.3. Impressionist and Post Impressionist
- 7.3.4. Others
- 7.1. Market Analysis, Insights and Forecast - by Channel
- 8. Asia Online Fine Art Market Analysis, Insights and Forecast, 2019-2031
- 8.1. Market Analysis, Insights and Forecast - by Channel
- 8.1.1. Dealers
- 8.1.2. Auctions
- 8.2. Market Analysis, Insights and Forecast - by Medium
- 8.2.1. Painting
- 8.2.2. Sculptures
- 8.2.3. Others
- 8.3. Market Analysis, Insights and Forecast - by Sector
- 8.3.1. Post-War and Contemporary
- 8.3.2. Modern
- 8.3.3. Impressionist and Post Impressionist
- 8.3.4. Others
- 8.1. Market Analysis, Insights and Forecast - by Channel
- 9. Latin America Online Fine Art Market Analysis, Insights and Forecast, 2019-2031
- 9.1. Market Analysis, Insights and Forecast - by Channel
- 9.1.1. Dealers
- 9.1.2. Auctions
- 9.2. Market Analysis, Insights and Forecast - by Medium
- 9.2.1. Painting
- 9.2.2. Sculptures
- 9.2.3. Others
- 9.3. Market Analysis, Insights and Forecast - by Sector
- 9.3.1. Post-War and Contemporary
- 9.3.2. Modern
- 9.3.3. Impressionist and Post Impressionist
- 9.3.4. Others
- 9.1. Market Analysis, Insights and Forecast - by Channel
- 10. Middle East and Africa Online Fine Art Market Analysis, Insights and Forecast, 2019-2031
- 10.1. Market Analysis, Insights and Forecast - by Channel
- 10.1.1. Dealers
- 10.1.2. Auctions
- 10.2. Market Analysis, Insights and Forecast - by Medium
- 10.2.1. Painting
- 10.2.2. Sculptures
- 10.2.3. Others
- 10.3. Market Analysis, Insights and Forecast - by Sector
- 10.3.1. Post-War and Contemporary
- 10.3.2. Modern
- 10.3.3. Impressionist and Post Impressionist
- 10.3.4. Others
- 10.1. Market Analysis, Insights and Forecast - by Channel
- 11. North America Online Fine Art Market Analysis, Insights and Forecast, 2019-2031
- 11.1. Market Analysis, Insights and Forecast - By Country/Sub-region
- 11.1.1 United States
- 11.1.2 Canada
- 11.1.3 Mexico
- 12. Europe Online Fine Art Market Analysis, Insights and Forecast, 2019-2031
- 12.1. Market Analysis, Insights and Forecast - By Country/Sub-region
- 12.1.1 Germany
- 12.1.2 United Kingdom
- 12.1.3 France
- 12.1.4 Spain
- 12.1.5 Italy
- 12.1.6 Spain
- 12.1.7 Belgium
- 12.1.8 Netherland
- 12.1.9 Nordics
- 12.1.10 Rest of Europe
- 13. Asia Pacific Online Fine Art Market Analysis, Insights and Forecast, 2019-2031
- 13.1. Market Analysis, Insights and Forecast - By Country/Sub-region
- 13.1.1 China
- 13.1.2 Japan
- 13.1.3 India
- 13.1.4 South Korea
- 13.1.5 Southeast Asia
- 13.1.6 Australia
- 13.1.7 Indonesia
- 13.1.8 Phillipes
- 13.1.9 Singapore
- 13.1.10 Thailandc
- 13.1.11 Rest of Asia Pacific
- 14. South America Online Fine Art Market Analysis, Insights and Forecast, 2019-2031
- 14.1. Market Analysis, Insights and Forecast - By Country/Sub-region
- 14.1.1 Brazil
- 14.1.2 Argentina
- 14.1.3 Peru
- 14.1.4 Chile
- 14.1.5 Colombia
- 14.1.6 Ecuador
- 14.1.7 Venezuela
- 14.1.8 Rest of South America
- 15. North America Online Fine Art Market Analysis, Insights and Forecast, 2019-2031
- 15.1. Market Analysis, Insights and Forecast - By Country/Sub-region
- 15.1.1 United States
- 15.1.2 Canada
- 15.1.3 Mexico
- 16. MEA Online Fine Art Market Analysis, Insights and Forecast, 2019-2031
- 16.1. Market Analysis, Insights and Forecast - By Country/Sub-region
- 16.1.1 United Arab Emirates
- 16.1.2 Saudi Arabia
- 16.1.3 South Africa
- 16.1.4 Rest of Middle East and Africa
- 17. Competitive Analysis
- 17.1. Global Market Share Analysis 2024
- 17.2. Company Profiles
- 17.2.1 Artnet AG
- 17.2.1.1. Overview
- 17.2.1.2. Products
- 17.2.1.3. SWOT Analysis
- 17.2.1.4. Recent Developments
- 17.2.1.5. Financials (Based on Availability)
- 17.2.2 Artfinder (ART DISCOVERY LIMITED)
- 17.2.2.1. Overview
- 17.2.2.2. Products
- 17.2.2.3. SWOT Analysis
- 17.2.2.4. Recent Developments
- 17.2.2.5. Financials (Based on Availability)
- 17.2.3 Sotheby's Inc
- 17.2.3.1. Overview
- 17.2.3.2. Products
- 17.2.3.3. SWOT Analysis
- 17.2.3.4. Recent Developments
- 17.2.3.5. Financials (Based on Availability)
- 17.2.4 William Doyle Galleries Inc
- 17.2.4.1. Overview
- 17.2.4.2. Products
- 17.2.4.3. SWOT Analysis
- 17.2.4.4. Recent Developments
- 17.2.4.5. Financials (Based on Availability)
- 17.2.5 SINGULAR
- 17.2.5.1. Overview
- 17.2.5.2. Products
- 17.2.5.3. SWOT Analysis
- 17.2.5.4. Recent Developments
- 17.2.5.5. Financials (Based on Availability)
- 17.2.6 Kooness
- 17.2.6.1. Overview
- 17.2.6.2. Products
- 17.2.6.3. SWOT Analysis
- 17.2.6.4. Recent Developments
- 17.2.6.5. Financials (Based on Availability)
- 17.2.7 Saatchi Online Inc
- 17.2.7.1. Overview
- 17.2.7.2. Products
- 17.2.7.3. SWOT Analysis
- 17.2.7.4. Recent Developments
- 17.2.7.5. Financials (Based on Availability)
- 17.2.8 Artellite Limited
- 17.2.8.1. Overview
- 17.2.8.2. Products
- 17.2.8.3. SWOT Analysis
- 17.2.8.4. Recent Developments
- 17.2.8.5. Financials (Based on Availability)
- 17.2.9 Artsy
- 17.2.9.1. Overview
- 17.2.9.2. Products
- 17.2.9.3. SWOT Analysis
- 17.2.9.4. Recent Developments
- 17.2.9.5. Financials (Based on Availability)
- 17.2.10 Christie's
- 17.2.10.1. Overview
- 17.2.10.2. Products
- 17.2.10.3. SWOT Analysis
- 17.2.10.4. Recent Developments
- 17.2.10.5. Financials (Based on Availability)
- 17.2.11 Catawiki B V
- 17.2.11.1. Overview
- 17.2.11.2. Products
- 17.2.11.3. SWOT Analysis
- 17.2.11.4. Recent Developments
- 17.2.11.5. Financials (Based on Availability)
- 17.2.12 The Artling Pte Ltd
- 17.2.12.1. Overview
- 17.2.12.2. Products
- 17.2.12.3. SWOT Analysis
- 17.2.12.4. Recent Developments
- 17.2.12.5. Financials (Based on Availability)
- 17.2.13 Invaluable LLC
- 17.2.13.1. Overview
- 17.2.13.2. Products
- 17.2.13.3. SWOT Analysis
- 17.2.13.4. Recent Developments
- 17.2.13.5. Financials (Based on Availability)
- 17.2.14 Auction Technology Group PLC (thesaleroom com)
- 17.2.14.1. Overview
- 17.2.14.2. Products
- 17.2.14.3. SWOT Analysis
- 17.2.14.4. Recent Developments
- 17.2.14.5. Financials (Based on Availability)
- 17.2.1 Artnet AG
List of Figures
- Figure 1: Global Online Fine Art Market Revenue Breakdown (Million, %) by Region 2024 & 2032
- Figure 2: Global Online Fine Art Market Volume Breakdown (K Unit, %) by Region 2024 & 2032
- Figure 3: North America Online Fine Art Market Revenue (Million), by Country 2024 & 2032
- Figure 4: North America Online Fine Art Market Volume (K Unit), by Country 2024 & 2032
- Figure 5: North America Online Fine Art Market Revenue Share (%), by Country 2024 & 2032
- Figure 6: North America Online Fine Art Market Volume Share (%), by Country 2024 & 2032
- Figure 7: Europe Online Fine Art Market Revenue (Million), by Country 2024 & 2032
- Figure 8: Europe Online Fine Art Market Volume (K Unit), by Country 2024 & 2032
- Figure 9: Europe Online Fine Art Market Revenue Share (%), by Country 2024 & 2032
- Figure 10: Europe Online Fine Art Market Volume Share (%), by Country 2024 & 2032
- Figure 11: Asia Pacific Online Fine Art Market Revenue (Million), by Country 2024 & 2032
- Figure 12: Asia Pacific Online Fine Art Market Volume (K Unit), by Country 2024 & 2032
- Figure 13: Asia Pacific Online Fine Art Market Revenue Share (%), by Country 2024 & 2032
- Figure 14: Asia Pacific Online Fine Art Market Volume Share (%), by Country 2024 & 2032
- Figure 15: South America Online Fine Art Market Revenue (Million), by Country 2024 & 2032
- Figure 16: South America Online Fine Art Market Volume (K Unit), by Country 2024 & 2032
- Figure 17: South America Online Fine Art Market Revenue Share (%), by Country 2024 & 2032
- Figure 18: South America Online Fine Art Market Volume Share (%), by Country 2024 & 2032
- Figure 19: North America Online Fine Art Market Revenue (Million), by Country 2024 & 2032
- Figure 20: North America Online Fine Art Market Volume (K Unit), by Country 2024 & 2032
- Figure 21: North America Online Fine Art Market Revenue Share (%), by Country 2024 & 2032
- Figure 22: North America Online Fine Art Market Volume Share (%), by Country 2024 & 2032
- Figure 23: MEA Online Fine Art Market Revenue (Million), by Country 2024 & 2032
- Figure 24: MEA Online Fine Art Market Volume (K Unit), by Country 2024 & 2032
- Figure 25: MEA Online Fine Art Market Revenue Share (%), by Country 2024 & 2032
- Figure 26: MEA Online Fine Art Market Volume Share (%), by Country 2024 & 2032
- Figure 27: North America Online Fine Art Market Revenue (Million), by Channel 2024 & 2032
- Figure 28: North America Online Fine Art Market Volume (K Unit), by Channel 2024 & 2032
- Figure 29: North America Online Fine Art Market Revenue Share (%), by Channel 2024 & 2032
- Figure 30: North America Online Fine Art Market Volume Share (%), by Channel 2024 & 2032
- Figure 31: North America Online Fine Art Market Revenue (Million), by Medium 2024 & 2032
- Figure 32: North America Online Fine Art Market Volume (K Unit), by Medium 2024 & 2032
- Figure 33: North America Online Fine Art Market Revenue Share (%), by Medium 2024 & 2032
- Figure 34: North America Online Fine Art Market Volume Share (%), by Medium 2024 & 2032
- Figure 35: North America Online Fine Art Market Revenue (Million), by Sector 2024 & 2032
- Figure 36: North America Online Fine Art Market Volume (K Unit), by Sector 2024 & 2032
- Figure 37: North America Online Fine Art Market Revenue Share (%), by Sector 2024 & 2032
- Figure 38: North America Online Fine Art Market Volume Share (%), by Sector 2024 & 2032
- Figure 39: North America Online Fine Art Market Revenue (Million), by Country 2024 & 2032
- Figure 40: North America Online Fine Art Market Volume (K Unit), by Country 2024 & 2032
- Figure 41: North America Online Fine Art Market Revenue Share (%), by Country 2024 & 2032
- Figure 42: North America Online Fine Art Market Volume Share (%), by Country 2024 & 2032
- Figure 43: Europe Online Fine Art Market Revenue (Million), by Channel 2024 & 2032
- Figure 44: Europe Online Fine Art Market Volume (K Unit), by Channel 2024 & 2032
- Figure 45: Europe Online Fine Art Market Revenue Share (%), by Channel 2024 & 2032
- Figure 46: Europe Online Fine Art Market Volume Share (%), by Channel 2024 & 2032
- Figure 47: Europe Online Fine Art Market Revenue (Million), by Medium 2024 & 2032
- Figure 48: Europe Online Fine Art Market Volume (K Unit), by Medium 2024 & 2032
- Figure 49: Europe Online Fine Art Market Revenue Share (%), by Medium 2024 & 2032
- Figure 50: Europe Online Fine Art Market Volume Share (%), by Medium 2024 & 2032
- Figure 51: Europe Online Fine Art Market Revenue (Million), by Sector 2024 & 2032
- Figure 52: Europe Online Fine Art Market Volume (K Unit), by Sector 2024 & 2032
- Figure 53: Europe Online Fine Art Market Revenue Share (%), by Sector 2024 & 2032
- Figure 54: Europe Online Fine Art Market Volume Share (%), by Sector 2024 & 2032
- Figure 55: Europe Online Fine Art Market Revenue (Million), by Country 2024 & 2032
- Figure 56: Europe Online Fine Art Market Volume (K Unit), by Country 2024 & 2032
- Figure 57: Europe Online Fine Art Market Revenue Share (%), by Country 2024 & 2032
- Figure 58: Europe Online Fine Art Market Volume Share (%), by Country 2024 & 2032
- Figure 59: Asia Online Fine Art Market Revenue (Million), by Channel 2024 & 2032
- Figure 60: Asia Online Fine Art Market Volume (K Unit), by Channel 2024 & 2032
- Figure 61: Asia Online Fine Art Market Revenue Share (%), by Channel 2024 & 2032
- Figure 62: Asia Online Fine Art Market Volume Share (%), by Channel 2024 & 2032
- Figure 63: Asia Online Fine Art Market Revenue (Million), by Medium 2024 & 2032
- Figure 64: Asia Online Fine Art Market Volume (K Unit), by Medium 2024 & 2032
- Figure 65: Asia Online Fine Art Market Revenue Share (%), by Medium 2024 & 2032
- Figure 66: Asia Online Fine Art Market Volume Share (%), by Medium 2024 & 2032
- Figure 67: Asia Online Fine Art Market Revenue (Million), by Sector 2024 & 2032
- Figure 68: Asia Online Fine Art Market Volume (K Unit), by Sector 2024 & 2032
- Figure 69: Asia Online Fine Art Market Revenue Share (%), by Sector 2024 & 2032
- Figure 70: Asia Online Fine Art Market Volume Share (%), by Sector 2024 & 2032
- Figure 71: Asia Online Fine Art Market Revenue (Million), by Country 2024 & 2032
- Figure 72: Asia Online Fine Art Market Volume (K Unit), by Country 2024 & 2032
- Figure 73: Asia Online Fine Art Market Revenue Share (%), by Country 2024 & 2032
- Figure 74: Asia Online Fine Art Market Volume Share (%), by Country 2024 & 2032
- Figure 75: Latin America Online Fine Art Market Revenue (Million), by Channel 2024 & 2032
- Figure 76: Latin America Online Fine Art Market Volume (K Unit), by Channel 2024 & 2032
- Figure 77: Latin America Online Fine Art Market Revenue Share (%), by Channel 2024 & 2032
- Figure 78: Latin America Online Fine Art Market Volume Share (%), by Channel 2024 & 2032
- Figure 79: Latin America Online Fine Art Market Revenue (Million), by Medium 2024 & 2032
- Figure 80: Latin America Online Fine Art Market Volume (K Unit), by Medium 2024 & 2032
- Figure 81: Latin America Online Fine Art Market Revenue Share (%), by Medium 2024 & 2032
- Figure 82: Latin America Online Fine Art Market Volume Share (%), by Medium 2024 & 2032
- Figure 83: Latin America Online Fine Art Market Revenue (Million), by Sector 2024 & 2032
- Figure 84: Latin America Online Fine Art Market Volume (K Unit), by Sector 2024 & 2032
- Figure 85: Latin America Online Fine Art Market Revenue Share (%), by Sector 2024 & 2032
- Figure 86: Latin America Online Fine Art Market Volume Share (%), by Sector 2024 & 2032
- Figure 87: Latin America Online Fine Art Market Revenue (Million), by Country 2024 & 2032
- Figure 88: Latin America Online Fine Art Market Volume (K Unit), by Country 2024 & 2032
- Figure 89: Latin America Online Fine Art Market Revenue Share (%), by Country 2024 & 2032
- Figure 90: Latin America Online Fine Art Market Volume Share (%), by Country 2024 & 2032
- Figure 91: Middle East and Africa Online Fine Art Market Revenue (Million), by Channel 2024 & 2032
- Figure 92: Middle East and Africa Online Fine Art Market Volume (K Unit), by Channel 2024 & 2032
- Figure 93: Middle East and Africa Online Fine Art Market Revenue Share (%), by Channel 2024 & 2032
- Figure 94: Middle East and Africa Online Fine Art Market Volume Share (%), by Channel 2024 & 2032
- Figure 95: Middle East and Africa Online Fine Art Market Revenue (Million), by Medium 2024 & 2032
- Figure 96: Middle East and Africa Online Fine Art Market Volume (K Unit), by Medium 2024 & 2032
- Figure 97: Middle East and Africa Online Fine Art Market Revenue Share (%), by Medium 2024 & 2032
- Figure 98: Middle East and Africa Online Fine Art Market Volume Share (%), by Medium 2024 & 2032
- Figure 99: Middle East and Africa Online Fine Art Market Revenue (Million), by Sector 2024 & 2032
- Figure 100: Middle East and Africa Online Fine Art Market Volume (K Unit), by Sector 2024 & 2032
- Figure 101: Middle East and Africa Online Fine Art Market Revenue Share (%), by Sector 2024 & 2032
- Figure 102: Middle East and Africa Online Fine Art Market Volume Share (%), by Sector 2024 & 2032
- Figure 103: Middle East and Africa Online Fine Art Market Revenue (Million), by Country 2024 & 2032
- Figure 104: Middle East and Africa Online Fine Art Market Volume (K Unit), by Country 2024 & 2032
- Figure 105: Middle East and Africa Online Fine Art Market Revenue Share (%), by Country 2024 & 2032
- Figure 106: Middle East and Africa Online Fine Art Market Volume Share (%), by Country 2024 & 2032
List of Tables
- Table 1: Global Online Fine Art Market Revenue Million Forecast, by Region 2019 & 2032
- Table 2: Global Online Fine Art Market Volume K Unit Forecast, by Region 2019 & 2032
- Table 3: Global Online Fine Art Market Revenue Million Forecast, by Channel 2019 & 2032
- Table 4: Global Online Fine Art Market Volume K Unit Forecast, by Channel 2019 & 2032
- Table 5: Global Online Fine Art Market Revenue Million Forecast, by Medium 2019 & 2032
- Table 6: Global Online Fine Art Market Volume K Unit Forecast, by Medium 2019 & 2032
- Table 7: Global Online Fine Art Market Revenue Million Forecast, by Sector 2019 & 2032
- Table 8: Global Online Fine Art Market Volume K Unit Forecast, by Sector 2019 & 2032
- Table 9: Global Online Fine Art Market Revenue Million Forecast, by Region 2019 & 2032
- Table 10: Global Online Fine Art Market Volume K Unit Forecast, by Region 2019 & 2032
- Table 11: Global Online Fine Art Market Revenue Million Forecast, by Country 2019 & 2032
- Table 12: Global Online Fine Art Market Volume K Unit Forecast, by Country 2019 & 2032
- Table 13: United States Online Fine Art Market Revenue (Million) Forecast, by Application 2019 & 2032
- Table 14: United States Online Fine Art Market Volume (K Unit) Forecast, by Application 2019 & 2032
- Table 15: Canada Online Fine Art Market Revenue (Million) Forecast, by Application 2019 & 2032
- Table 16: Canada Online Fine Art Market Volume (K Unit) Forecast, by Application 2019 & 2032
- Table 17: Mexico Online Fine Art Market Revenue (Million) Forecast, by Application 2019 & 2032
- Table 18: Mexico Online Fine Art Market Volume (K Unit) Forecast, by Application 2019 & 2032
- Table 19: Global Online Fine Art Market Revenue Million Forecast, by Country 2019 & 2032
- Table 20: Global Online Fine Art Market Volume K Unit Forecast, by Country 2019 & 2032
- Table 21: Germany Online Fine Art Market Revenue (Million) Forecast, by Application 2019 & 2032
- Table 22: Germany Online Fine Art Market Volume (K Unit) Forecast, by Application 2019 & 2032
- Table 23: United Kingdom Online Fine Art Market Revenue (Million) Forecast, by Application 2019 & 2032
- Table 24: United Kingdom Online Fine Art Market Volume (K Unit) Forecast, by Application 2019 & 2032
- Table 25: France Online Fine Art Market Revenue (Million) Forecast, by Application 2019 & 2032
- Table 26: France Online Fine Art Market Volume (K Unit) Forecast, by Application 2019 & 2032
- Table 27: Spain Online Fine Art Market Revenue (Million) Forecast, by Application 2019 & 2032
- Table 28: Spain Online Fine Art Market Volume (K Unit) Forecast, by Application 2019 & 2032
- Table 29: Italy Online Fine Art Market Revenue (Million) Forecast, by Application 2019 & 2032
- Table 30: Italy Online Fine Art Market Volume (K Unit) Forecast, by Application 2019 & 2032
- Table 31: Spain Online Fine Art Market Revenue (Million) Forecast, by Application 2019 & 2032
- Table 32: Spain Online Fine Art Market Volume (K Unit) Forecast, by Application 2019 & 2032
- Table 33: Belgium Online Fine Art Market Revenue (Million) Forecast, by Application 2019 & 2032
- Table 34: Belgium Online Fine Art Market Volume (K Unit) Forecast, by Application 2019 & 2032
- Table 35: Netherland Online Fine Art Market Revenue (Million) Forecast, by Application 2019 & 2032
- Table 36: Netherland Online Fine Art Market Volume (K Unit) Forecast, by Application 2019 & 2032
- Table 37: Nordics Online Fine Art Market Revenue (Million) Forecast, by Application 2019 & 2032
- Table 38: Nordics Online Fine Art Market Volume (K Unit) Forecast, by Application 2019 & 2032
- Table 39: Rest of Europe Online Fine Art Market Revenue (Million) Forecast, by Application 2019 & 2032
- Table 40: Rest of Europe Online Fine Art Market Volume (K Unit) Forecast, by Application 2019 & 2032
- Table 41: Global Online Fine Art Market Revenue Million Forecast, by Country 2019 & 2032
- Table 42: Global Online Fine Art Market Volume K Unit Forecast, by Country 2019 & 2032
- Table 43: China Online Fine Art Market Revenue (Million) Forecast, by Application 2019 & 2032
- Table 44: China Online Fine Art Market Volume (K Unit) Forecast, by Application 2019 & 2032
- Table 45: Japan Online Fine Art Market Revenue (Million) Forecast, by Application 2019 & 2032
- Table 46: Japan Online Fine Art Market Volume (K Unit) Forecast, by Application 2019 & 2032
- Table 47: India Online Fine Art Market Revenue (Million) Forecast, by Application 2019 & 2032
- Table 48: India Online Fine Art Market Volume (K Unit) Forecast, by Application 2019 & 2032
- Table 49: South Korea Online Fine Art Market Revenue (Million) Forecast, by Application 2019 & 2032
- Table 50: South Korea Online Fine Art Market Volume (K Unit) Forecast, by Application 2019 & 2032
- Table 51: Southeast Asia Online Fine Art Market Revenue (Million) Forecast, by Application 2019 & 2032
- Table 52: Southeast Asia Online Fine Art Market Volume (K Unit) Forecast, by Application 2019 & 2032
- Table 53: Australia Online Fine Art Market Revenue (Million) Forecast, by Application 2019 & 2032
- Table 54: Australia Online Fine Art Market Volume (K Unit) Forecast, by Application 2019 & 2032
- Table 55: Indonesia Online Fine Art Market Revenue (Million) Forecast, by Application 2019 & 2032
- Table 56: Indonesia Online Fine Art Market Volume (K Unit) Forecast, by Application 2019 & 2032
- Table 57: Phillipes Online Fine Art Market Revenue (Million) Forecast, by Application 2019 & 2032
- Table 58: Phillipes Online Fine Art Market Volume (K Unit) Forecast, by Application 2019 & 2032
- Table 59: Singapore Online Fine Art Market Revenue (Million) Forecast, by Application 2019 & 2032
- Table 60: Singapore Online Fine Art Market Volume (K Unit) Forecast, by Application 2019 & 2032
- Table 61: Thailandc Online Fine Art Market Revenue (Million) Forecast, by Application 2019 & 2032
- Table 62: Thailandc Online Fine Art Market Volume (K Unit) Forecast, by Application 2019 & 2032
- Table 63: Rest of Asia Pacific Online Fine Art Market Revenue (Million) Forecast, by Application 2019 & 2032
- Table 64: Rest of Asia Pacific Online Fine Art Market Volume (K Unit) Forecast, by Application 2019 & 2032
- Table 65: Global Online Fine Art Market Revenue Million Forecast, by Country 2019 & 2032
- Table 66: Global Online Fine Art Market Volume K Unit Forecast, by Country 2019 & 2032
- Table 67: Brazil Online Fine Art Market Revenue (Million) Forecast, by Application 2019 & 2032
- Table 68: Brazil Online Fine Art Market Volume (K Unit) Forecast, by Application 2019 & 2032
- Table 69: Argentina Online Fine Art Market Revenue (Million) Forecast, by Application 2019 & 2032
- Table 70: Argentina Online Fine Art Market Volume (K Unit) Forecast, by Application 2019 & 2032
- Table 71: Peru Online Fine Art Market Revenue (Million) Forecast, by Application 2019 & 2032
- Table 72: Peru Online Fine Art Market Volume (K Unit) Forecast, by Application 2019 & 2032
- Table 73: Chile Online Fine Art Market Revenue (Million) Forecast, by Application 2019 & 2032
- Table 74: Chile Online Fine Art Market Volume (K Unit) Forecast, by Application 2019 & 2032
- Table 75: Colombia Online Fine Art Market Revenue (Million) Forecast, by Application 2019 & 2032
- Table 76: Colombia Online Fine Art Market Volume (K Unit) Forecast, by Application 2019 & 2032
- Table 77: Ecuador Online Fine Art Market Revenue (Million) Forecast, by Application 2019 & 2032
- Table 78: Ecuador Online Fine Art Market Volume (K Unit) Forecast, by Application 2019 & 2032
- Table 79: Venezuela Online Fine Art Market Revenue (Million) Forecast, by Application 2019 & 2032
- Table 80: Venezuela Online Fine Art Market Volume (K Unit) Forecast, by Application 2019 & 2032
- Table 81: Rest of South America Online Fine Art Market Revenue (Million) Forecast, by Application 2019 & 2032
- Table 82: Rest of South America Online Fine Art Market Volume (K Unit) Forecast, by Application 2019 & 2032
- Table 83: Global Online Fine Art Market Revenue Million Forecast, by Country 2019 & 2032
- Table 84: Global Online Fine Art Market Volume K Unit Forecast, by Country 2019 & 2032
- Table 85: United States Online Fine Art Market Revenue (Million) Forecast, by Application 2019 & 2032
- Table 86: United States Online Fine Art Market Volume (K Unit) Forecast, by Application 2019 & 2032
- Table 87: Canada Online Fine Art Market Revenue (Million) Forecast, by Application 2019 & 2032
- Table 88: Canada Online Fine Art Market Volume (K Unit) Forecast, by Application 2019 & 2032
- Table 89: Mexico Online Fine Art Market Revenue (Million) Forecast, by Application 2019 & 2032
- Table 90: Mexico Online Fine Art Market Volume (K Unit) Forecast, by Application 2019 & 2032
- Table 91: Global Online Fine Art Market Revenue Million Forecast, by Country 2019 & 2032
- Table 92: Global Online Fine Art Market Volume K Unit Forecast, by Country 2019 & 2032
- Table 93: United Arab Emirates Online Fine Art Market Revenue (Million) Forecast, by Application 2019 & 2032
- Table 94: United Arab Emirates Online Fine Art Market Volume (K Unit) Forecast, by Application 2019 & 2032
- Table 95: Saudi Arabia Online Fine Art Market Revenue (Million) Forecast, by Application 2019 & 2032
- Table 96: Saudi Arabia Online Fine Art Market Volume (K Unit) Forecast, by Application 2019 & 2032
- Table 97: South Africa Online Fine Art Market Revenue (Million) Forecast, by Application 2019 & 2032
- Table 98: South Africa Online Fine Art Market Volume (K Unit) Forecast, by Application 2019 & 2032
- Table 99: Rest of Middle East and Africa Online Fine Art Market Revenue (Million) Forecast, by Application 2019 & 2032
- Table 100: Rest of Middle East and Africa Online Fine Art Market Volume (K Unit) Forecast, by Application 2019 & 2032
- Table 101: Global Online Fine Art Market Revenue Million Forecast, by Channel 2019 & 2032
- Table 102: Global Online Fine Art Market Volume K Unit Forecast, by Channel 2019 & 2032
- Table 103: Global Online Fine Art Market Revenue Million Forecast, by Medium 2019 & 2032
- Table 104: Global Online Fine Art Market Volume K Unit Forecast, by Medium 2019 & 2032
- Table 105: Global Online Fine Art Market Revenue Million Forecast, by Sector 2019 & 2032
- Table 106: Global Online Fine Art Market Volume K Unit Forecast, by Sector 2019 & 2032
- Table 107: Global Online Fine Art Market Revenue Million Forecast, by Country 2019 & 2032
- Table 108: Global Online Fine Art Market Volume K Unit Forecast, by Country 2019 & 2032
- Table 109: Global Online Fine Art Market Revenue Million Forecast, by Channel 2019 & 2032
- Table 110: Global Online Fine Art Market Volume K Unit Forecast, by Channel 2019 & 2032
- Table 111: Global Online Fine Art Market Revenue Million Forecast, by Medium 2019 & 2032
- Table 112: Global Online Fine Art Market Volume K Unit Forecast, by Medium 2019 & 2032
- Table 113: Global Online Fine Art Market Revenue Million Forecast, by Sector 2019 & 2032
- Table 114: Global Online Fine Art Market Volume K Unit Forecast, by Sector 2019 & 2032
- Table 115: Global Online Fine Art Market Revenue Million Forecast, by Country 2019 & 2032
- Table 116: Global Online Fine Art Market Volume K Unit Forecast, by Country 2019 & 2032
- Table 117: Global Online Fine Art Market Revenue Million Forecast, by Channel 2019 & 2032
- Table 118: Global Online Fine Art Market Volume K Unit Forecast, by Channel 2019 & 2032
- Table 119: Global Online Fine Art Market Revenue Million Forecast, by Medium 2019 & 2032
- Table 120: Global Online Fine Art Market Volume K Unit Forecast, by Medium 2019 & 2032
- Table 121: Global Online Fine Art Market Revenue Million Forecast, by Sector 2019 & 2032
- Table 122: Global Online Fine Art Market Volume K Unit Forecast, by Sector 2019 & 2032
- Table 123: Global Online Fine Art Market Revenue Million Forecast, by Country 2019 & 2032
- Table 124: Global Online Fine Art Market Volume K Unit Forecast, by Country 2019 & 2032
- Table 125: Global Online Fine Art Market Revenue Million Forecast, by Channel 2019 & 2032
- Table 126: Global Online Fine Art Market Volume K Unit Forecast, by Channel 2019 & 2032
- Table 127: Global Online Fine Art Market Revenue Million Forecast, by Medium 2019 & 2032
- Table 128: Global Online Fine Art Market Volume K Unit Forecast, by Medium 2019 & 2032
- Table 129: Global Online Fine Art Market Revenue Million Forecast, by Sector 2019 & 2032
- Table 130: Global Online Fine Art Market Volume K Unit Forecast, by Sector 2019 & 2032
- Table 131: Global Online Fine Art Market Revenue Million Forecast, by Country 2019 & 2032
- Table 132: Global Online Fine Art Market Volume K Unit Forecast, by Country 2019 & 2032
- Table 133: Global Online Fine Art Market Revenue Million Forecast, by Channel 2019 & 2032
- Table 134: Global Online Fine Art Market Volume K Unit Forecast, by Channel 2019 & 2032
- Table 135: Global Online Fine Art Market Revenue Million Forecast, by Medium 2019 & 2032
- Table 136: Global Online Fine Art Market Volume K Unit Forecast, by Medium 2019 & 2032
- Table 137: Global Online Fine Art Market Revenue Million Forecast, by Sector 2019 & 2032
- Table 138: Global Online Fine Art Market Volume K Unit Forecast, by Sector 2019 & 2032
- Table 139: Global Online Fine Art Market Revenue Million Forecast, by Country 2019 & 2032
- Table 140: Global Online Fine Art Market Volume K Unit Forecast, by Country 2019 & 2032
Frequently Asked Questions
1. What is the projected Compound Annual Growth Rate (CAGR) of the Online Fine Art Market?
The projected CAGR is approximately 8.55%.
2. Which companies are prominent players in the Online Fine Art Market?
Key companies in the market include Artnet AG, Artfinder (ART DISCOVERY LIMITED), Sotheby's Inc, William Doyle Galleries Inc, SINGULAR, Kooness, Saatchi Online Inc, Artellite Limited, Artsy, Christie's, Catawiki B V, The Artling Pte Ltd, Invaluable LLC, Auction Technology Group PLC (thesaleroom com).
3. What are the main segments of the Online Fine Art Market?
The market segments include Channel, Medium, Sector.
4. Can you provide details about the market size?
The market size is estimated to be USD 12.78 Million as of 2022.
5. What are some drivers contributing to market growth?
Ease of Convenience of Shoppers Elevated Through No Traveling and Simpler Access Across Global Borders; Higher Return on Investment.
6. What are the notable trends driving market growth?
Dealers to Hold Major Share in the Channel Segment.
7. Are there any restraints impacting market growth?
Incidents of Fraudulent Transactions and Cyber Crime; Opening of Physical Spaces. Galleries. and Auctions Impacting Online Sales.
8. Can you provide examples of recent developments in the market?
August 2023 - Phillips, an auction house known for handling the work of up-and-coming artists, is reportedly entering the world of eCommerce. The house will begin selling fine art directly to collectors through its new online platform, Dropshop. The launch is part of Phillips' commitment to diversifying its portfolio and helping artists get their work to a wider audience. Phillips will collect a fee for every sale and will offer a 3% commission back to artists if a piece purchased from the platform is resold through Phillips in the future. Prices on the Dropshop platform will range from USD 5,000 to USD 50,000 but may increase in some instances. As for art galleries or curators wishing to use Phillips' service, Lo Iacono hinted that may be a possibility in the future.
9. What pricing options are available for accessing the report?
Pricing options include single-user, multi-user, and enterprise licenses priced at USD 4750, USD 5250, and USD 8750 respectively.
10. Is the market size provided in terms of value or volume?
The market size is provided in terms of value, measured in Million and volume, measured in K Unit.
11. Are there any specific market keywords associated with the report?
Yes, the market keyword associated with the report is "Online Fine Art Market," which aids in identifying and referencing the specific market segment covered.
12. How do I determine which pricing option suits my needs best?
The pricing options vary based on user requirements and access needs. Individual users may opt for single-user licenses, while businesses requiring broader access may choose multi-user or enterprise licenses for cost-effective access to the report.
13. Are there any additional resources or data provided in the Online Fine Art Market report?
While the report offers comprehensive insights, it's advisable to review the specific contents or supplementary materials provided to ascertain if additional resources or data are available.
14. How can I stay updated on further developments or reports in the Online Fine Art Market?
To stay informed about further developments, trends, and reports in the Online Fine Art Market, consider subscribing to industry newsletters, following relevant companies and organizations, or regularly checking reputable industry news sources and publications.
Methodology
Step 1 - Identification of Relevant Samples Size from Population Database


Step 2 - Approaches for Defining Global Market Size (Value, Volume* & Price*)

Note*: In applicable scenarios
Step 3 - Data Sources
Primary Research
- Web Analytics
- Survey Reports
- Research Institute
- Latest Research Reports
- Opinion Leaders
Secondary Research
- Annual Reports
- White Paper
- Latest Press Release
- Industry Association
- Paid Database
- Investor Presentations

Step 4 - Data Triangulation
Involves using different sources of information in order to increase the validity of a study
These sources are likely to be stakeholders in a program - participants, other researchers, program staff, other community members, and so on.
Then we put all data in single framework & apply various statistical tools to find out the dynamic on the market.
During the analysis stage, feedback from the stakeholder groups would be compared to determine areas of agreement as well as areas of divergence


