

Key Insights
The European cable management market is projected to reach $6.59 billion by 2025, with an anticipated Compound Annual Growth Rate (CAGR) of 6.48% from 2025 to 2033. This significant expansion is primarily attributed to the rapid growth in the IT and telecommunications sectors, coupled with the continuous development of data centers across the continent. Large-scale infrastructure projects within construction and energy, including renewable energy initiatives, are also driving demand for advanced cable management systems to ensure safety and operational efficiency. Increased industrial automation and the adoption of smart building technologies further contribute to market acceleration. Germany, the UK, and France lead the European market due to their robust industrial sectors and substantial digital infrastructure investments. The market is segmented by product type, end-user industry, application, and material, offering a diverse landscape for specialized manufacturers.
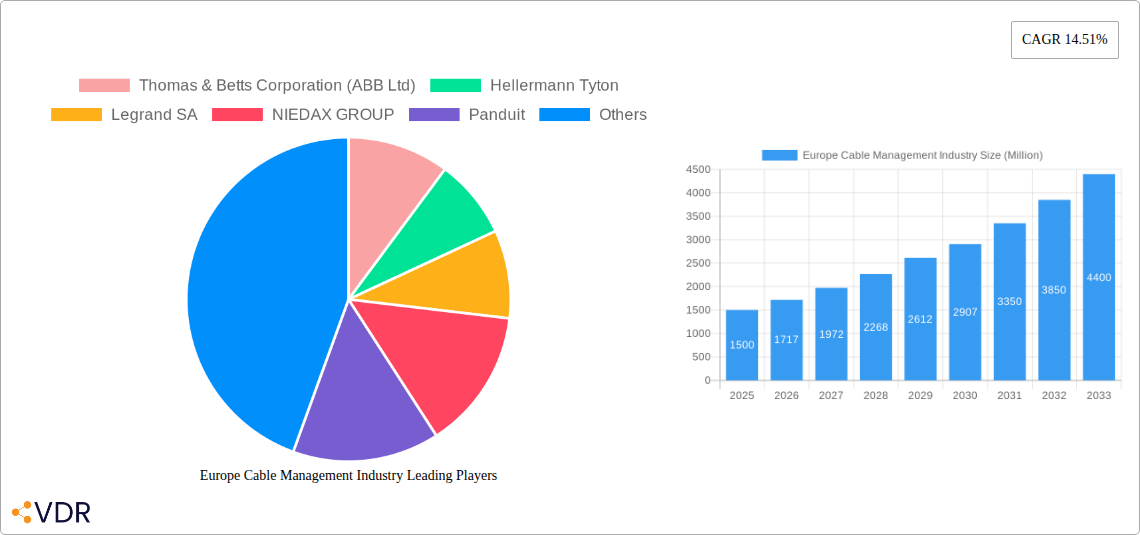
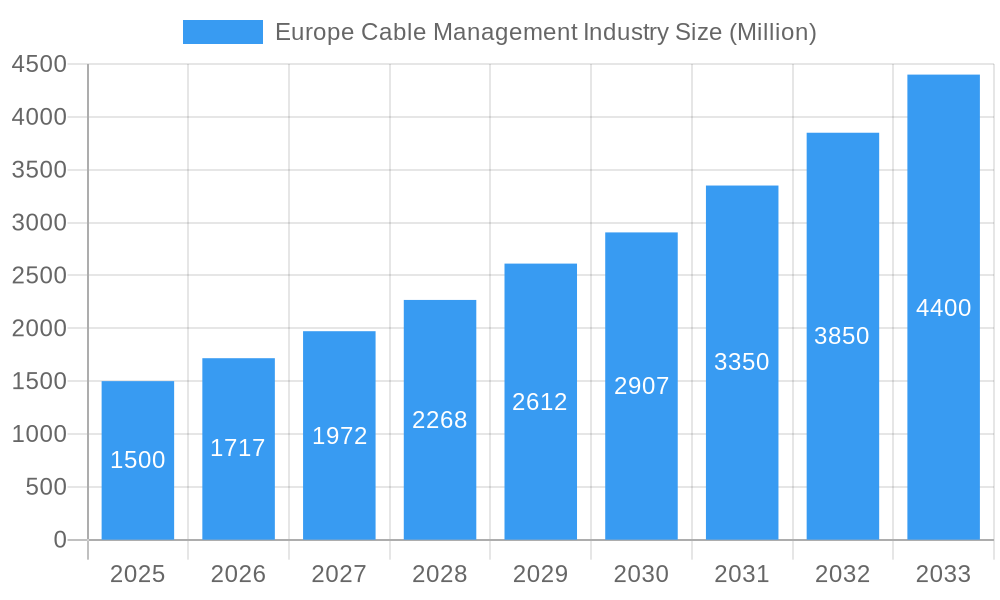
Europe Cable Management Industry Market Size (In Billion)
Despite a positive growth outlook, the European cable management market faces challenges, including supply chain volatility and fluctuating raw material costs. The competitive environment, featuring established players and numerous regional manufacturers, demands continuous innovation and strategic pricing. However, the ongoing digital transformation, urbanization, and the growing need for reliable infrastructure provide a strong foundation for sustained market growth. The increasing demand for sustainable and eco-friendly cable management solutions, utilizing recycled materials and energy-efficient designs, presents emerging opportunities. Regional growth will be influenced by government policies supporting digital infrastructure and construction activity.
Europe Cable Management Industry Company Market Share
Europe Cable Management Industry Market Report: 2019-2033
This comprehensive report provides a detailed analysis of the Europe cable management industry, offering invaluable insights for industry professionals, investors, and strategic decision-makers. Covering the period from 2019 to 2033, with 2025 as the base year, this report meticulously examines market dynamics, growth trends, key players, and future outlook. The market is segmented by country, product type, end-user industry, application, and material, providing a granular understanding of this vital sector. The total market size is projected to reach xx Million by 2033.
Europe Cable Management Industry Market Dynamics & Structure
The European cable management market is characterized by a moderately consolidated structure, with several major players holding significant market share. Market concentration is influenced by factors including technological innovation, regulatory compliance, and the presence of substitute products. The industry witnesses ongoing mergers and acquisitions (M&A) activity, driving consolidation and shaping the competitive landscape.
- Market Concentration: The top 5 players account for approximately xx% of the market share in 2025.
- Technological Innovation: Advancements in materials science (e.g., lighter, more durable materials) and smart cable management systems are key drivers of growth. However, high R&D costs pose a barrier to entry for smaller companies.
- Regulatory Frameworks: EU directives on energy efficiency and environmental sustainability influence product design and manufacturing processes. Compliance costs can impact profitability.
- Competitive Product Substitutes: Wireless technologies and alternative data transmission methods present competitive pressure on traditional cable management systems.
- End-User Demographics: The increasing adoption of data centers, smart buildings, and renewable energy infrastructure fuels demand for sophisticated cable management solutions.
- M&A Trends: The past five years have seen xx M&A deals in the European cable management sector, primarily driven by consolidation and expansion into new markets.
Europe Cable Management Industry Growth Trends & Insights
The European cable management market experienced steady growth from 2019 to 2024, with a Compound Annual Growth Rate (CAGR) of xx%. This growth is projected to continue during the forecast period (2025-2033), albeit at a slightly moderated pace, driven by factors such as increasing urbanization, infrastructure development, and the expanding IT and telecommunication sectors. Technological disruptions, such as the increasing adoption of fiber optics and 5G technologies, are shaping market dynamics, while consumer behavior shifts towards sustainability are influencing product demand. The market penetration rate for smart cable management systems is estimated at xx% in 2025, expected to reach xx% by 2033.
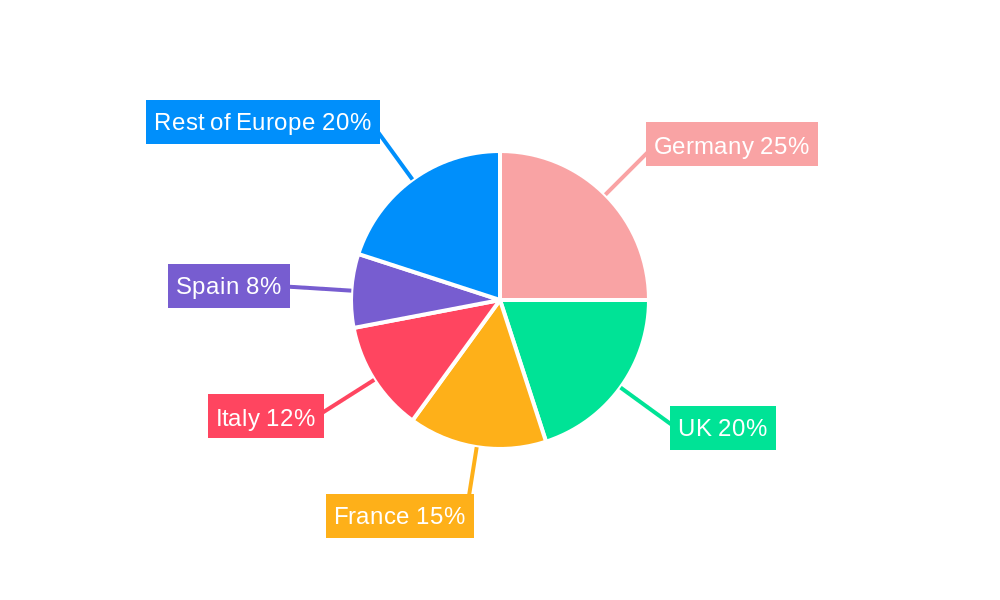
Dominant Regions, Countries, or Segments in Europe Cable Management Industry
The United Kingdom, Germany, and France are the leading national markets within Europe, collectively accounting for xx% of the total market value in 2025. Strong economic growth, robust infrastructure development, and a thriving industrial sector contribute to this dominance. Within product types, Cable Trays and Cable Conduits represent the largest segments, driven by their widespread application across various industries. The IT and Telecommunication end-user industry exhibits the highest growth potential, fueled by the rapid expansion of data centers and 5G infrastructure.
Key Drivers:
- Government investments in infrastructure projects.
- Growing demand for data centers and 5G networks.
- Increased adoption of renewable energy technologies.
- Stringent regulations promoting energy efficiency.
Dominance Factors:
- United Kingdom: High concentration of data centers and telecommunication companies.
- Germany: Strong manufacturing sector and robust industrial infrastructure.
- France: Significant investments in renewable energy projects.
- Cable Trays & Conduits: Versatility, cost-effectiveness, and ease of installation.
- IT & Telecommunications: High growth driven by digital transformation.
Europe Cable Management Industry Product Landscape
The market offers a diverse range of products, including cable trays, raceways, conduits, connectors, and accessories. Recent innovations focus on improving durability, fire resistance, and ease of installation. Smart cable management systems, incorporating sensors and data analytics, are gaining traction, offering improved efficiency and operational insights. Key selling propositions include enhanced safety features, improved cable organization, and reduced installation time. Technological advancements are driving the development of lightweight, flexible, and modular cable management solutions.
Key Drivers, Barriers & Challenges in Europe Cable Management Industry
Key Drivers:
The European cable management market is propelled by strong demand from the IT and telecom sectors, infrastructure development, and the growing adoption of renewable energy. Government regulations promoting energy efficiency and safety also contribute to growth.
Key Challenges:
Fluctuations in raw material prices and supply chain disruptions pose significant challenges. Intense competition from established players and the emergence of substitute technologies also constrain market growth. Strict environmental regulations add to manufacturing costs. The impact of these factors on profit margins is estimated at approximately xx%.
Emerging Opportunities in Europe Cable Management Industry
Emerging trends include the increasing adoption of modular cable management systems, the growth of the smart building sector, and rising demand for data center solutions. Untapped markets in Eastern Europe present significant growth potential. The development of sustainable and environmentally friendly materials offers opportunities for innovation.
Growth Accelerators in the Europe Cable Management Industry
Technological breakthroughs in materials science and the development of innovative cable management solutions are key catalysts for long-term growth. Strategic partnerships between manufacturers and system integrators are enhancing market reach and expanding product offerings. Market expansion into emerging economies in Eastern Europe presents significant growth opportunities.
Key Players Shaping the Europe Cable Management Industry Market
- Thomas & Betts Corporation (ABB Ltd)
- HellermannTyton
- Legrand SA
- NIEDAX GROUP
- Panduit
- Vantrunk International
- Marco Cable Management
- TE Connectivity
- Schneider Electric SE
- Eaton Corporation PLC
- Leviton Manufacturing UK Limited
- Hubbell
Notable Milestones in Europe Cable Management Industry Sector
- August 2022: HellermannTyton launches Hela DoubleGuardSruglit Conduit, a two-piece solution offering flexible corrugated protection for cable bundles.
- May 2022: Nexans secures a USD 100 million contract with Enedis in France for medium-voltage power distribution services and cables, strengthening its position in sustainable electrification.
In-Depth Europe Cable Management Industry Market Outlook
The future of the European cable management market is bright, driven by ongoing technological advancements, infrastructure development, and the expanding digital economy. Strategic investments in R&D, strategic partnerships, and expansion into new markets will be crucial for sustained growth. The market is poised for robust expansion, driven by increasing demand for efficient and reliable cable management solutions across diverse industries.
Europe Cable Management Industry Segmentation
-
1. Product Type
- 1.1. Cable Trays
- 1.2. Cable Raceways
- 1.3. Cable Conduits
- 1.4. Connectors and Glands
- 1.5. Cable Carriers
- 1.6. Cable Lugs
- 1.7. Junction/Distribution Boxes
- 1.8. Other Pr
-
2. End-User Industry
- 2.1. IT and Telecommunication
- 2.2. Construction
- 2.3. Energy and Utility
- 2.4. Manufacturing
- 2.5. Commercial
- 2.6. Other End-User Industries
-
3. Application
- 3.1. Residential
- 3.2. Commercial
- 3.3. Industrial
-
4. Material
- 4.1. Metallic
-
4.2. Non-metallic
- 4.2.1. PVC
- 4.2.2. PP
- 4.2.3. PE
- 4.2.4. Other Materials
Europe Cable Management Industry Segmentation By Geography
-
1. Europe
- 1.1. United Kingdom
- 1.2. Germany
- 1.3. France
- 1.4. Italy
- 1.5. Spain
- 1.6. Netherlands
- 1.7. Belgium
- 1.8. Sweden
- 1.9. Norway
- 1.10. Poland
- 1.11. Denmark
Europe Cable Management Industry Regional Market Share
Geographic Coverage of Europe Cable Management Industry
Europe Cable Management Industry REPORT HIGHLIGHTS
| Aspects | Details |
|---|---|
| Study Period | 2020-2034 |
| Base Year | 2025 |
| Estimated Year | 2026 |
| Forecast Period | 2026-2034 |
| Historical Period | 2020-2025 |
| Growth Rate | CAGR of 6.48% from 2020-2034 |
| Segmentation |
|
Table of Contents
- 1. Introduction
- 1.1. Research Scope
- 1.2. Market Segmentation
- 1.3. Research Objective
- 1.4. Definitions and Assumptions
- 2. Executive Summary
- 2.1. Market Snapshot
- 3. Market Dynamics
- 3.1. Market Drivers
- 3.2. Market Restrains
- 3.3. Market Trends
- 3.4. Market Opportunities
- 4. Market Factor Analysis
- 4.1. Porters Five Forces
- 4.1.1. Bargaining Power of Suppliers
- 4.1.2. Bargaining Power of Buyers
- 4.1.3. Threat of New Entrants
- 4.1.4. Threat of Substitutes
- 4.1.5. Competitive Rivalry
- 4.2. PESTEL analysis
- 4.3. BCG Analysis
- 4.3.1. Stars (High Growth, High Market Share)
- 4.3.2. Cash Cows (Low Growth, High Market Share)
- 4.3.3. Question Mark (High Growth, Low Market Share)
- 4.3.4. Dogs (Low Growth, Low Market Share)
- 4.4. Ansoff Matrix Analysis
- 4.5. Supply Chain Analysis
- 4.6. Regulatory Landscape
- 4.7. Current Market Potential and Opportunity Assessment (TAM–SAM–SOM Framework)
- 4.8. VDR Analyst Note
- 4.1. Porters Five Forces
- 5. Market Analysis, Insights and Forecast 2021-2033
- 5.1. Market Analysis, Insights and Forecast - by Product Type
- 5.1.1. Cable Trays
- 5.1.2. Cable Raceways
- 5.1.3. Cable Conduits
- 5.1.4. Connectors and Glands
- 5.1.5. Cable Carriers
- 5.1.6. Cable Lugs
- 5.1.7. Junction/Distribution Boxes
- 5.1.8. Other Pr
- 5.2. Market Analysis, Insights and Forecast - by End-User Industry
- 5.2.1. IT and Telecommunication
- 5.2.2. Construction
- 5.2.3. Energy and Utility
- 5.2.4. Manufacturing
- 5.2.5. Commercial
- 5.2.6. Other End-User Industries
- 5.3. Market Analysis, Insights and Forecast - by Application
- 5.3.1. Residential
- 5.3.2. Commercial
- 5.3.3. Industrial
- 5.4. Market Analysis, Insights and Forecast - by Material
- 5.4.1. Metallic
- 5.4.2. Non-metallic
- 5.4.2.1. PVC
- 5.4.2.2. PP
- 5.4.2.3. PE
- 5.4.2.4. Other Materials
- 5.5. Market Analysis, Insights and Forecast - by Region
- 5.5.1. Europe
- 5.1. Market Analysis, Insights and Forecast - by Product Type
- 6. Europe Cable Management Industry Analysis, Insights and Forecast, 2021-2033
- 6.1. Market Analysis, Insights and Forecast - by Product Type
- 6.1.1. Cable Trays
- 6.1.2. Cable Raceways
- 6.1.3. Cable Conduits
- 6.1.4. Connectors and Glands
- 6.1.5. Cable Carriers
- 6.1.6. Cable Lugs
- 6.1.7. Junction/Distribution Boxes
- 6.1.8. Other Pr
- 6.2. Market Analysis, Insights and Forecast - by End-User Industry
- 6.2.1. IT and Telecommunication
- 6.2.2. Construction
- 6.2.3. Energy and Utility
- 6.2.4. Manufacturing
- 6.2.5. Commercial
- 6.2.6. Other End-User Industries
- 6.3. Market Analysis, Insights and Forecast - by Application
- 6.3.1. Residential
- 6.3.2. Commercial
- 6.3.3. Industrial
- 6.4. Market Analysis, Insights and Forecast - by Material
- 6.4.1. Metallic
- 6.4.2. Non-metallic
- 6.4.2.1. PVC
- 6.4.2.2. PP
- 6.4.2.3. PE
- 6.4.2.4. Other Materials
- 6.1. Market Analysis, Insights and Forecast - by Product Type
- 7. Competitive Analysis
- 7.1. Company Profiles
- 7.1.1 Thomas & Betts Corporation (ABB Ltd)
- 7.1.1.1. Company Overview
- 7.1.1.2. Products
- 7.1.1.3. Company Financials
- 7.1.1.4. SWOT Analysis
- 7.1.2 Hellermann Tyton
- 7.1.2.1. Company Overview
- 7.1.2.2. Products
- 7.1.2.3. Company Financials
- 7.1.2.4. SWOT Analysis
- 7.1.3 Legrand SA
- 7.1.3.1. Company Overview
- 7.1.3.2. Products
- 7.1.3.3. Company Financials
- 7.1.3.4. SWOT Analysis
- 7.1.4 NIEDAX GROUP
- 7.1.4.1. Company Overview
- 7.1.4.2. Products
- 7.1.4.3. Company Financials
- 7.1.4.4. SWOT Analysis
- 7.1.5 Panduit
- 7.1.5.1. Company Overview
- 7.1.5.2. Products
- 7.1.5.3. Company Financials
- 7.1.5.4. SWOT Analysis
- 7.1.6 Vantrunk International
- 7.1.6.1. Company Overview
- 7.1.6.2. Products
- 7.1.6.3. Company Financials
- 7.1.6.4. SWOT Analysis
- 7.1.7 Marco Cable Management
- 7.1.7.1. Company Overview
- 7.1.7.2. Products
- 7.1.7.3. Company Financials
- 7.1.7.4. SWOT Analysis
- 7.1.8 TE Connectivity
- 7.1.8.1. Company Overview
- 7.1.8.2. Products
- 7.1.8.3. Company Financials
- 7.1.8.4. SWOT Analysis
- 7.1.9 Schneider Electric SE
- 7.1.9.1. Company Overview
- 7.1.9.2. Products
- 7.1.9.3. Company Financials
- 7.1.9.4. SWOT Analysis
- 7.1.10 Eaton Corporation PLC
- 7.1.10.1. Company Overview
- 7.1.10.2. Products
- 7.1.10.3. Company Financials
- 7.1.10.4. SWOT Analysis
- 7.1.11 Leviton Manufacturing UK Limited
- 7.1.11.1. Company Overview
- 7.1.11.2. Products
- 7.1.11.3. Company Financials
- 7.1.11.4. SWOT Analysis
- 7.1.12 Hubbell*List Not Exhaustive
- 7.1.12.1. Company Overview
- 7.1.12.2. Products
- 7.1.12.3. Company Financials
- 7.1.12.4. SWOT Analysis
- 7.1.1 Thomas & Betts Corporation (ABB Ltd)
- 7.2. Market Entropy
- 7.2.1 Company's Key Areas Served
- 7.2.2 Recent Developments
- 7.3. Company Market Share Analysis 2025
- 7.3.1 Top 5 Companies Market Share Analysis
- 7.3.2 Top 3 Companies Market Share Analysis
- 7.4. List of Potential Customers
- 8. Research Methodology
List of Figures
- Figure 1: Europe Cable Management Industry Revenue Breakdown (billion, %) by Product 2025 & 2033
- Figure 2: Europe Cable Management Industry Share (%) by Company 2025
List of Tables
- Table 1: Europe Cable Management Industry Revenue billion Forecast, by Product Type 2020 & 2033
- Table 2: Europe Cable Management Industry Revenue billion Forecast, by End-User Industry 2020 & 2033
- Table 3: Europe Cable Management Industry Revenue billion Forecast, by Application 2020 & 2033
- Table 4: Europe Cable Management Industry Revenue billion Forecast, by Material 2020 & 2033
- Table 5: Europe Cable Management Industry Revenue billion Forecast, by Region 2020 & 2033
- Table 6: Europe Cable Management Industry Revenue billion Forecast, by Product Type 2020 & 2033
- Table 7: Europe Cable Management Industry Revenue billion Forecast, by End-User Industry 2020 & 2033
- Table 8: Europe Cable Management Industry Revenue billion Forecast, by Application 2020 & 2033
- Table 9: Europe Cable Management Industry Revenue billion Forecast, by Material 2020 & 2033
- Table 10: Europe Cable Management Industry Revenue billion Forecast, by Country 2020 & 2033
- Table 11: United Kingdom Europe Cable Management Industry Revenue (billion) Forecast, by Application 2020 & 2033
- Table 12: Germany Europe Cable Management Industry Revenue (billion) Forecast, by Application 2020 & 2033
- Table 13: France Europe Cable Management Industry Revenue (billion) Forecast, by Application 2020 & 2033
- Table 14: Italy Europe Cable Management Industry Revenue (billion) Forecast, by Application 2020 & 2033
- Table 15: Spain Europe Cable Management Industry Revenue (billion) Forecast, by Application 2020 & 2033
- Table 16: Netherlands Europe Cable Management Industry Revenue (billion) Forecast, by Application 2020 & 2033
- Table 17: Belgium Europe Cable Management Industry Revenue (billion) Forecast, by Application 2020 & 2033
- Table 18: Sweden Europe Cable Management Industry Revenue (billion) Forecast, by Application 2020 & 2033
- Table 19: Norway Europe Cable Management Industry Revenue (billion) Forecast, by Application 2020 & 2033
- Table 20: Poland Europe Cable Management Industry Revenue (billion) Forecast, by Application 2020 & 2033
- Table 21: Denmark Europe Cable Management Industry Revenue (billion) Forecast, by Application 2020 & 2033
Frequently Asked Questions
1. What is the projected Compound Annual Growth Rate (CAGR) of the Europe Cable Management Industry?
The projected CAGR is approximately 6.48%.
2. Which companies are prominent players in the Europe Cable Management Industry?
Key companies in the market include Thomas & Betts Corporation (ABB Ltd), Hellermann Tyton, Legrand SA, NIEDAX GROUP, Panduit, Vantrunk International, Marco Cable Management, TE Connectivity, Schneider Electric SE, Eaton Corporation PLC, Leviton Manufacturing UK Limited, Hubbell*List Not Exhaustive.
3. What are the main segments of the Europe Cable Management Industry?
The market segments include Product Type, End-User Industry, Application, Material.
4. Can you provide details about the market size?
The market size is estimated to be USD 6.59 billion as of 2022.
5. What are some drivers contributing to market growth?
Innovation and Development in the Cable Management Market; Upgrade and Renewal of Existing Networks in the Developed Economies.
6. What are the notable trends driving market growth?
IT and Telecom Industry to drive the market.
7. Are there any restraints impacting market growth?
Fluctuating Market Demands and Customization Issues.
8. Can you provide examples of recent developments in the market?
August 2022 - HellermannTytonh has announced the launch of Hela DoubleGuardSruglit Conduit. The twopiece solution is composed of one rigid tube that attaches to the other and wraps itself in a bundle of cables or wires. This means that, in addition to the wires which are already connected at one end, flexible corrugated protection can be added.
9. What pricing options are available for accessing the report?
Pricing options include single-user, multi-user, and enterprise licenses priced at USD 4750, USD 4950, and USD 6800 respectively.
10. Is the market size provided in terms of value or volume?
The market size is provided in terms of value, measured in billion.
11. Are there any specific market keywords associated with the report?
Yes, the market keyword associated with the report is "Europe Cable Management Industry," which aids in identifying and referencing the specific market segment covered.
12. How do I determine which pricing option suits my needs best?
The pricing options vary based on user requirements and access needs. Individual users may opt for single-user licenses, while businesses requiring broader access may choose multi-user or enterprise licenses for cost-effective access to the report.
13. Are there any additional resources or data provided in the Europe Cable Management Industry report?
While the report offers comprehensive insights, it's advisable to review the specific contents or supplementary materials provided to ascertain if additional resources or data are available.
14. How can I stay updated on further developments or reports in the Europe Cable Management Industry?
To stay informed about further developments, trends, and reports in the Europe Cable Management Industry, consider subscribing to industry newsletters, following relevant companies and organizations, or regularly checking reputable industry news sources and publications.
Methodology
Step 1 - Identification of Relevant Samples Size from Population Database


Step 2 - Approaches for Defining Global Market Size (Value, Volume* & Price*)

Note*: In applicable scenarios
Step 3 - Data Sources
Primary Research
- Web Analytics
- Survey Reports
- Research Institute
- Latest Research Reports
- Opinion Leaders
Secondary Research
- Annual Reports
- White Paper
- Latest Press Release
- Industry Association
- Paid Database
- Investor Presentations

Step 4 - Data Triangulation
Involves using different sources of information in order to increase the validity of a study
These sources are likely to be stakeholders in a program - participants, other researchers, program staff, other community members, and so on.
Then we put all data in single framework & apply various statistical tools to find out the dynamic on the market.
During the analysis stage, feedback from the stakeholder groups would be compared to determine areas of agreement as well as areas of divergence