
Key Insights
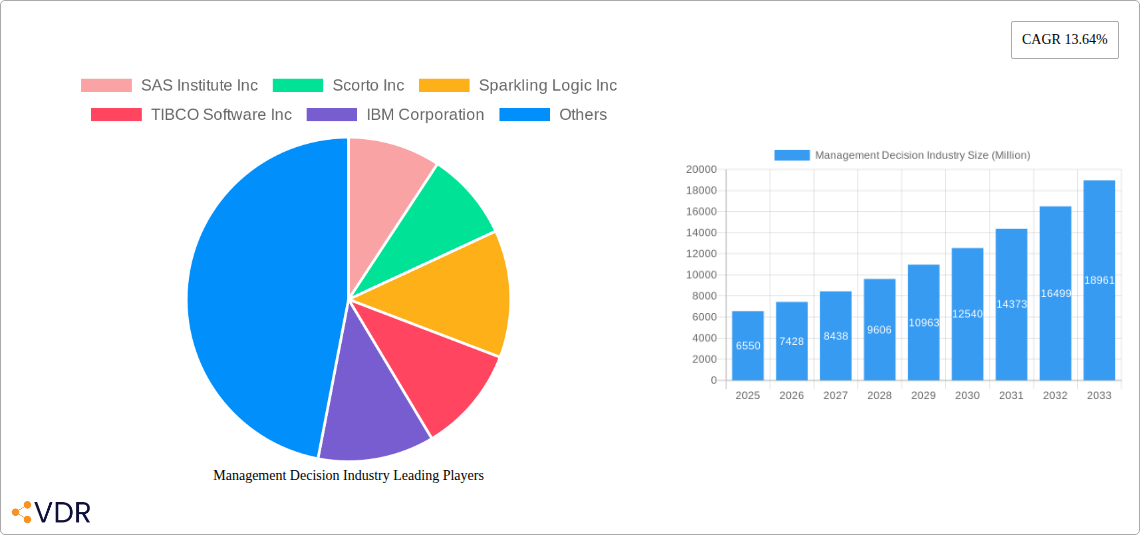
The Management Decision industry, currently valued at $6.55 billion in 2025, is experiencing robust growth, projected to expand at a Compound Annual Growth Rate (CAGR) of 13.64% from 2025 to 2033. This expansion is driven by several key factors. Firstly, the increasing complexity of business operations necessitates sophisticated decision-making tools and processes. Organizations across various sectors, including BFSI (Banking, Financial Services, and Insurance), IT and Telecom, Healthcare, and Retail, are adopting advanced analytics and decision management solutions to optimize performance, enhance customer experiences, and mitigate risks. Secondly, the rise of cloud computing offers scalable and cost-effective deployment options, further fueling market growth. Cloud-based solutions provide easier access, enhanced collaboration, and reduced infrastructure costs, making decision management accessible to a broader range of organizations. Finally, the growing adoption of AI and machine learning within decision management platforms enables more accurate predictions and insights, improving the quality of decision-making. However, factors such as the high initial investment cost of implementation and the need for skilled professionals to manage these systems pose challenges to market expansion.
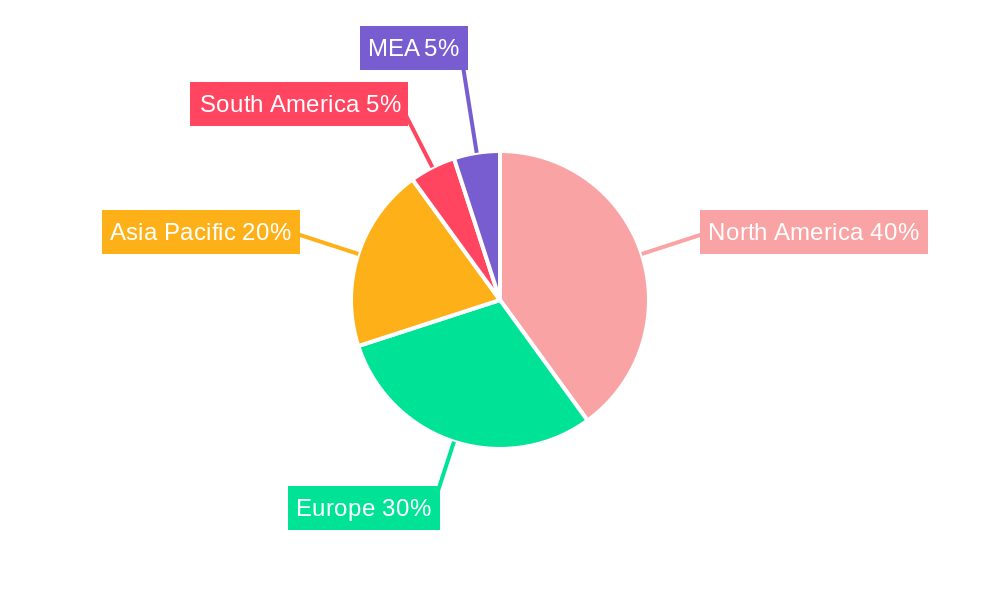
The market segmentation reveals significant opportunities. The software segment is expected to dominate due to increasing demand for advanced analytics and decision-making capabilities. The cloud deployment type is experiencing faster growth compared to on-premises due to its scalability and accessibility advantages. Among end-user industries, BFSI displays significant growth potential owing to its increasing reliance on risk management and regulatory compliance. The geographical distribution shows strong performance in North America and Europe, driven by early adoption and mature technological infrastructure. However, the Asia-Pacific region is poised for substantial growth, fueled by increasing digitalization and economic development. Key players like SAS Institute, IBM, and FICO are leading the market innovation, shaping the future of decision management through strategic partnerships and continuous product development. The competitive landscape is characterized by both established players and emerging technology providers, creating a dynamic and evolving market.
Management Decision Industry Market Report: 2019-2033
This comprehensive report provides an in-depth analysis of the Management Decision Industry, encompassing market dynamics, growth trends, regional segmentation, product landscape, key players, and future outlook. With a focus on the parent market of Business Intelligence and the child market of Decision Management Software, this report is an essential resource for industry professionals, investors, and strategic decision-makers. The report covers the period 2019-2033, with a base year of 2025 and a forecast period of 2025-2033. Market values are presented in millions of units.
Management Decision Industry Market Dynamics & Structure
The Management Decision Industry is characterized by a moderately concentrated market structure, with key players like FICO, IBM, and SAS Institute Inc. holding significant market share. However, the market exhibits considerable dynamism driven by rapid technological innovation, particularly in areas like AI and machine learning. Regulatory frameworks, such as GDPR and CCPA, are impacting data privacy and security, shaping industry practices. The emergence of cloud-based solutions is creating competitive pressure for on-premise offerings. The industry is witnessing increasing mergers and acquisitions (M&A) activity, with approximately xx M&A deals recorded between 2019 and 2024, consolidating market power and driving innovation.
- Market Concentration: Highly concentrated, with top 5 players holding approximately xx% market share in 2024.
- Technological Innovation: AI, machine learning, and big data analytics are major drivers.
- Regulatory Landscape: GDPR, CCPA, and other data privacy regulations are key influencers.
- Competitive Substitutes: Traditional business intelligence tools and spreadsheets pose competition.
- End-User Demographics: Growth is fueled by increasing data volumes and demand for data-driven decision-making across diverse industries.
- M&A Activity: Significant consolidation observed, with xx million USD worth of deals in 2024.
Management Decision Industry Growth Trends & Insights
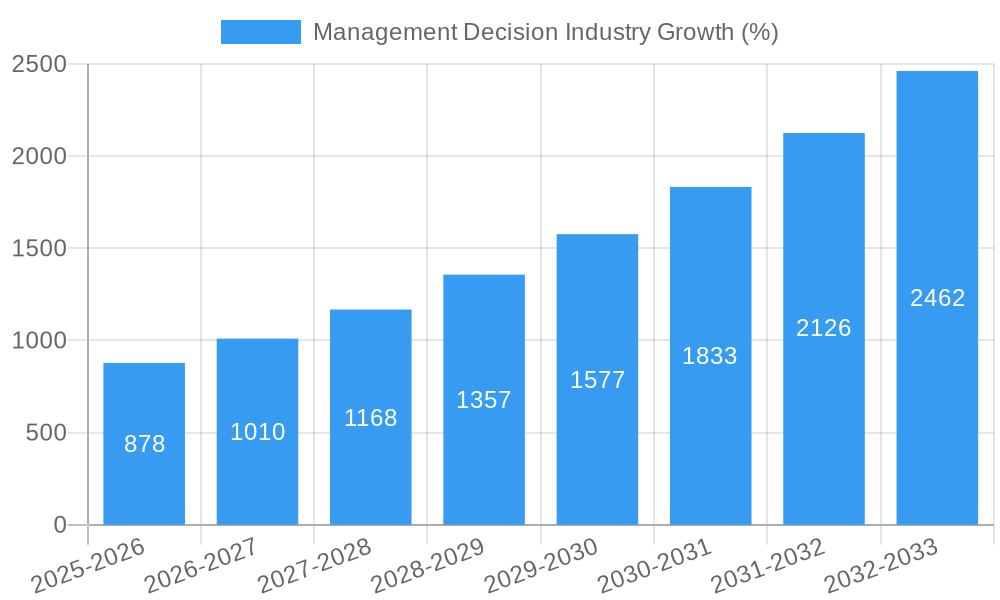
The Management Decision Industry experienced robust growth during the historical period (2019-2024), with a Compound Annual Growth Rate (CAGR) of xx%. This growth is projected to continue during the forecast period (2025-2033), driven by increasing adoption of cloud-based solutions, growing demand for real-time analytics, and the rise of AI-powered decision support systems. Market penetration is expected to increase from xx% in 2024 to xx% by 2033. Technological disruptions, such as the integration of blockchain and IoT data, are creating new opportunities for innovation and market expansion. Shifts in consumer behavior, particularly the increased reliance on digital platforms and mobile devices, are impacting the demand for user-friendly and accessible decision-making tools. The market size is estimated at xx million in 2025 and projected to reach xx million by 2033.
Dominant Regions, Countries, or Segments in Management Decision Industry
North America currently dominates the Management Decision Industry, holding approximately xx% of the global market share in 2024, followed by Europe and Asia-Pacific. Within segments, the Software component holds the largest market share (xx%), driven by the increasing demand for advanced analytical capabilities. The Cloud deployment type is experiencing faster growth than on-premises, reflecting the advantages of scalability, flexibility, and cost-effectiveness. The BFSI (Banking, Financial Services, and Insurance) sector is a significant end-user industry, with xx% market share in 2024.
- Key Drivers:
- North America: Strong technological infrastructure, high adoption rates, and significant investments in data analytics.
- Europe: Growing emphasis on regulatory compliance and data privacy, driving demand for advanced decision-making tools.
- Asia-Pacific: Rapid economic growth, increasing digitalization, and a rising middle class.
- Software Component: Enhanced analytical capabilities and functionalities.
- Cloud Deployment: Scalability, flexibility, and cost-effectiveness.
- BFSI: High demand for risk management, fraud detection, and customer relationship management solutions.
Management Decision Industry Product Landscape
The Management Decision Industry offers a wide range of products, from basic reporting and analytics tools to sophisticated AI-powered decision support systems. These products cater to diverse needs and are characterized by varying levels of functionality, customization, and integration capabilities. Key innovations include enhanced visualization tools, advanced machine learning algorithms, and seamless integration with existing business systems. The unique selling propositions often include ease of use, high accuracy, and real-time decision-making capabilities.
Key Drivers, Barriers & Challenges in Management Decision Industry
Key Drivers: The primary drivers include the increasing availability of big data, growing demand for data-driven decision-making, advancements in AI and machine learning, and the increasing adoption of cloud-based solutions. Government initiatives promoting digital transformation and data analytics also contribute to market growth.
Key Challenges: The major challenges include data security and privacy concerns, the need for skilled professionals, and the high cost of implementation. Competition from established players and the emergence of new technologies also pose challenges. Supply chain disruptions can impact the availability of hardware and software components.
Emerging Opportunities in Management Decision Industry
Emerging opportunities lie in untapped markets, particularly in developing economies, and the application of advanced analytics to new sectors, such as the Internet of Things (IoT) and the Metaverse. There is growing demand for personalized decision-making tools tailored to specific business needs, and the integration of decision management systems with other enterprise applications presents significant potential.
Growth Accelerators in the Management Decision Industry Industry
Long-term growth will be driven by continued technological innovation, strategic partnerships between technology providers and industry experts, and the expansion into new geographical markets. The increasing adoption of cloud computing and AI-powered solutions will also propel market growth.
Key Players Shaping the Management Decision Industry Market
- SAS Institute Inc
- Scorto Inc
- Sparkling Logic Inc
- TIBCO Software Inc
- IBM Corporation
- InRule Technology Inc
- DMC Dubai (Decision Management Consultants)
- FICO (Fair Isaac Corporation)
- Experian Information Solutions Inc
- Pegasystems Inc
- Actico GmbH
- Sapiens International Corporation
- Oracle Corporation
- Equifax Inc
- SAP SE
Notable Milestones in Management Decision Industry Sector
- January 2022: LambdaTest introduced Test Analytics, enhancing decision-making in DevOps.
- November 2022: IBM launched Business Analytics Enterprise, providing comprehensive data insights for business planning.
- XX XX XXXX: Frontline Education launched HR Capital Analytics Tool, improving decision-making in education HR.
In-Depth Management Decision Industry Market Outlook
The Management Decision Industry is poised for continued growth, driven by technological advancements, expanding data volumes, and the increasing demand for data-driven decision-making across all industries. Strategic partnerships, new product innovations, and expansion into emerging markets will further fuel market expansion. The long-term outlook remains positive, with significant opportunities for established players and new entrants alike.
Management Decision Industry Segmentation
-
1. Component
- 1.1. Software
- 1.2. Services
-
2. Deployment Type
- 2.1. On-premises
- 2.2. Cloud
-
3. End-User Industry
- 3.1. BFSI
- 3.2. IT and Telecom
- 3.3. Healthcare
- 3.4. Retail
- 3.5. Manufacturing
- 3.6. Other End-User Industries
Management Decision Industry Segmentation By Geography
-
1. North America
- 1.1. United States
- 1.2. Canada
- 1.3. Rest of North America
-
2. Europe
- 2.1. Germany
- 2.2. United Kingdom
- 2.3. France
- 2.4. Spain
- 2.5. Rest of Europe
-
3. Asia Pacific
- 3.1. China
- 3.2. Japan
- 3.3. India
- 3.4. Rest of Asia Pacific
-
4. Latin America
- 4.1. Brazil
- 4.2. Argentina
- 4.3. Rest of Latin America
-
5. Middle East and Africa
- 5.1. UAE
- 5.2. Saudi Arabia
- 5.3. South Africa
- 5.4. Rest of Middle East and Africa
Management Decision Industry REPORT HIGHLIGHTS
| Aspects | Details |
|---|---|
| Study Period | 2019-2033 |
| Base Year | 2024 |
| Estimated Year | 2025 |
| Forecast Period | 2025-2033 |
| Historical Period | 2019-2024 |
| Growth Rate | CAGR of 13.64% from 2019-2033 |
| Segmentation |
|
Table of Contents
- 1. Introduction
- 1.1. Research Scope
- 1.2. Market Segmentation
- 1.3. Research Methodology
- 1.4. Definitions and Assumptions
- 2. Executive Summary
- 2.1. Introduction
- 3. Market Dynamics
- 3.1. Introduction
- 3.2. Market Drivers
- 3.2.1. Increasing need for business agility which requires faster and efficient decision making; Increasing demand for Decision Analytics in BFSI sector to drive the market
- 3.3. Market Restrains
- 3.3.1. High monetary cost involved for the implementation
- 3.4. Market Trends
- 3.4.1. BSFI Sector is Expected to Hold Significant Share
- 4. Market Factor Analysis
- 4.1. Porters Five Forces
- 4.2. Supply/Value Chain
- 4.3. PESTEL analysis
- 4.4. Market Entropy
- 4.5. Patent/Trademark Analysis
- 5. Global Management Decision Industry Analysis, Insights and Forecast, 2019-2031
- 5.1. Market Analysis, Insights and Forecast - by Component
- 5.1.1. Software
- 5.1.2. Services
- 5.2. Market Analysis, Insights and Forecast - by Deployment Type
- 5.2.1. On-premises
- 5.2.2. Cloud
- 5.3. Market Analysis, Insights and Forecast - by End-User Industry
- 5.3.1. BFSI
- 5.3.2. IT and Telecom
- 5.3.3. Healthcare
- 5.3.4. Retail
- 5.3.5. Manufacturing
- 5.3.6. Other End-User Industries
- 5.4. Market Analysis, Insights and Forecast - by Region
- 5.4.1. North America
- 5.4.2. Europe
- 5.4.3. Asia Pacific
- 5.4.4. Latin America
- 5.4.5. Middle East and Africa
- 5.1. Market Analysis, Insights and Forecast - by Component
- 6. North America Management Decision Industry Analysis, Insights and Forecast, 2019-2031
- 6.1. Market Analysis, Insights and Forecast - by Component
- 6.1.1. Software
- 6.1.2. Services
- 6.2. Market Analysis, Insights and Forecast - by Deployment Type
- 6.2.1. On-premises
- 6.2.2. Cloud
- 6.3. Market Analysis, Insights and Forecast - by End-User Industry
- 6.3.1. BFSI
- 6.3.2. IT and Telecom
- 6.3.3. Healthcare
- 6.3.4. Retail
- 6.3.5. Manufacturing
- 6.3.6. Other End-User Industries
- 6.1. Market Analysis, Insights and Forecast - by Component
- 7. Europe Management Decision Industry Analysis, Insights and Forecast, 2019-2031
- 7.1. Market Analysis, Insights and Forecast - by Component
- 7.1.1. Software
- 7.1.2. Services
- 7.2. Market Analysis, Insights and Forecast - by Deployment Type
- 7.2.1. On-premises
- 7.2.2. Cloud
- 7.3. Market Analysis, Insights and Forecast - by End-User Industry
- 7.3.1. BFSI
- 7.3.2. IT and Telecom
- 7.3.3. Healthcare
- 7.3.4. Retail
- 7.3.5. Manufacturing
- 7.3.6. Other End-User Industries
- 7.1. Market Analysis, Insights and Forecast - by Component
- 8. Asia Pacific Management Decision Industry Analysis, Insights and Forecast, 2019-2031
- 8.1. Market Analysis, Insights and Forecast - by Component
- 8.1.1. Software
- 8.1.2. Services
- 8.2. Market Analysis, Insights and Forecast - by Deployment Type
- 8.2.1. On-premises
- 8.2.2. Cloud
- 8.3. Market Analysis, Insights and Forecast - by End-User Industry
- 8.3.1. BFSI
- 8.3.2. IT and Telecom
- 8.3.3. Healthcare
- 8.3.4. Retail
- 8.3.5. Manufacturing
- 8.3.6. Other End-User Industries
- 8.1. Market Analysis, Insights and Forecast - by Component
- 9. Latin America Management Decision Industry Analysis, Insights and Forecast, 2019-2031
- 9.1. Market Analysis, Insights and Forecast - by Component
- 9.1.1. Software
- 9.1.2. Services
- 9.2. Market Analysis, Insights and Forecast - by Deployment Type
- 9.2.1. On-premises
- 9.2.2. Cloud
- 9.3. Market Analysis, Insights and Forecast - by End-User Industry
- 9.3.1. BFSI
- 9.3.2. IT and Telecom
- 9.3.3. Healthcare
- 9.3.4. Retail
- 9.3.5. Manufacturing
- 9.3.6. Other End-User Industries
- 9.1. Market Analysis, Insights and Forecast - by Component
- 10. Middle East and Africa Management Decision Industry Analysis, Insights and Forecast, 2019-2031
- 10.1. Market Analysis, Insights and Forecast - by Component
- 10.1.1. Software
- 10.1.2. Services
- 10.2. Market Analysis, Insights and Forecast - by Deployment Type
- 10.2.1. On-premises
- 10.2.2. Cloud
- 10.3. Market Analysis, Insights and Forecast - by End-User Industry
- 10.3.1. BFSI
- 10.3.2. IT and Telecom
- 10.3.3. Healthcare
- 10.3.4. Retail
- 10.3.5. Manufacturing
- 10.3.6. Other End-User Industries
- 10.1. Market Analysis, Insights and Forecast - by Component
- 11. North America Management Decision Industry Analysis, Insights and Forecast, 2019-2031
- 11.1. Market Analysis, Insights and Forecast - By Country/Sub-region
- 11.1.1 United States
- 11.1.2 Canada
- 11.1.3 Mexico
- 12. Europe Management Decision Industry Analysis, Insights and Forecast, 2019-2031
- 12.1. Market Analysis, Insights and Forecast - By Country/Sub-region
- 12.1.1 Germany
- 12.1.2 United Kingdom
- 12.1.3 France
- 12.1.4 Spain
- 12.1.5 Italy
- 12.1.6 Spain
- 12.1.7 Belgium
- 12.1.8 Netherland
- 12.1.9 Nordics
- 12.1.10 Rest of Europe
- 13. Asia Pacific Management Decision Industry Analysis, Insights and Forecast, 2019-2031
- 13.1. Market Analysis, Insights and Forecast - By Country/Sub-region
- 13.1.1 China
- 13.1.2 Japan
- 13.1.3 India
- 13.1.4 South Korea
- 13.1.5 Southeast Asia
- 13.1.6 Australia
- 13.1.7 Indonesia
- 13.1.8 Phillipes
- 13.1.9 Singapore
- 13.1.10 Thailandc
- 13.1.11 Rest of Asia Pacific
- 14. South America Management Decision Industry Analysis, Insights and Forecast, 2019-2031
- 14.1. Market Analysis, Insights and Forecast - By Country/Sub-region
- 14.1.1 Brazil
- 14.1.2 Argentina
- 14.1.3 Peru
- 14.1.4 Chile
- 14.1.5 Colombia
- 14.1.6 Ecuador
- 14.1.7 Venezuela
- 14.1.8 Rest of South America
- 15. North America Management Decision Industry Analysis, Insights and Forecast, 2019-2031
- 15.1. Market Analysis, Insights and Forecast - By Country/Sub-region
- 15.1.1 United States
- 15.1.2 Canada
- 15.1.3 Mexico
- 16. MEA Management Decision Industry Analysis, Insights and Forecast, 2019-2031
- 16.1. Market Analysis, Insights and Forecast - By Country/Sub-region
- 16.1.1 United Arab Emirates
- 16.1.2 Saudi Arabia
- 16.1.3 South Africa
- 16.1.4 Rest of Middle East and Africa
- 17. Competitive Analysis
- 17.1. Global Market Share Analysis 2024
- 17.2. Company Profiles
- 17.2.1 SAS Institute Inc
- 17.2.1.1. Overview
- 17.2.1.2. Products
- 17.2.1.3. SWOT Analysis
- 17.2.1.4. Recent Developments
- 17.2.1.5. Financials (Based on Availability)
- 17.2.2 Scorto Inc
- 17.2.2.1. Overview
- 17.2.2.2. Products
- 17.2.2.3. SWOT Analysis
- 17.2.2.4. Recent Developments
- 17.2.2.5. Financials (Based on Availability)
- 17.2.3 Sparkling Logic Inc
- 17.2.3.1. Overview
- 17.2.3.2. Products
- 17.2.3.3. SWOT Analysis
- 17.2.3.4. Recent Developments
- 17.2.3.5. Financials (Based on Availability)
- 17.2.4 TIBCO Software Inc
- 17.2.4.1. Overview
- 17.2.4.2. Products
- 17.2.4.3. SWOT Analysis
- 17.2.4.4. Recent Developments
- 17.2.4.5. Financials (Based on Availability)
- 17.2.5 IBM Corporation
- 17.2.5.1. Overview
- 17.2.5.2. Products
- 17.2.5.3. SWOT Analysis
- 17.2.5.4. Recent Developments
- 17.2.5.5. Financials (Based on Availability)
- 17.2.6 InRule Technology Inc
- 17.2.6.1. Overview
- 17.2.6.2. Products
- 17.2.6.3. SWOT Analysis
- 17.2.6.4. Recent Developments
- 17.2.6.5. Financials (Based on Availability)
- 17.2.7 DMC Dubai (Decision Management Consultants)*List Not Exhaustive
- 17.2.7.1. Overview
- 17.2.7.2. Products
- 17.2.7.3. SWOT Analysis
- 17.2.7.4. Recent Developments
- 17.2.7.5. Financials (Based on Availability)
- 17.2.8 FICO (Fair Isaac Corporation)
- 17.2.8.1. Overview
- 17.2.8.2. Products
- 17.2.8.3. SWOT Analysis
- 17.2.8.4. Recent Developments
- 17.2.8.5. Financials (Based on Availability)
- 17.2.9 Experian Information Solutions Inc
- 17.2.9.1. Overview
- 17.2.9.2. Products
- 17.2.9.3. SWOT Analysis
- 17.2.9.4. Recent Developments
- 17.2.9.5. Financials (Based on Availability)
- 17.2.10 Pegasystems Inc
- 17.2.10.1. Overview
- 17.2.10.2. Products
- 17.2.10.3. SWOT Analysis
- 17.2.10.4. Recent Developments
- 17.2.10.5. Financials (Based on Availability)
- 17.2.11 Actico GmbH
- 17.2.11.1. Overview
- 17.2.11.2. Products
- 17.2.11.3. SWOT Analysis
- 17.2.11.4. Recent Developments
- 17.2.11.5. Financials (Based on Availability)
- 17.2.12 Sapiens International Corporation
- 17.2.12.1. Overview
- 17.2.12.2. Products
- 17.2.12.3. SWOT Analysis
- 17.2.12.4. Recent Developments
- 17.2.12.5. Financials (Based on Availability)
- 17.2.13 Oracle Corporation
- 17.2.13.1. Overview
- 17.2.13.2. Products
- 17.2.13.3. SWOT Analysis
- 17.2.13.4. Recent Developments
- 17.2.13.5. Financials (Based on Availability)
- 17.2.14 Equifax Inc
- 17.2.14.1. Overview
- 17.2.14.2. Products
- 17.2.14.3. SWOT Analysis
- 17.2.14.4. Recent Developments
- 17.2.14.5. Financials (Based on Availability)
- 17.2.15 SAP SE
- 17.2.15.1. Overview
- 17.2.15.2. Products
- 17.2.15.3. SWOT Analysis
- 17.2.15.4. Recent Developments
- 17.2.15.5. Financials (Based on Availability)
- 17.2.1 SAS Institute Inc
List of Figures
- Figure 1: Global Management Decision Industry Revenue Breakdown (Million, %) by Region 2024 & 2032
- Figure 2: North America Management Decision Industry Revenue (Million), by Country 2024 & 2032
- Figure 3: North America Management Decision Industry Revenue Share (%), by Country 2024 & 2032
- Figure 4: Europe Management Decision Industry Revenue (Million), by Country 2024 & 2032
- Figure 5: Europe Management Decision Industry Revenue Share (%), by Country 2024 & 2032
- Figure 6: Asia Pacific Management Decision Industry Revenue (Million), by Country 2024 & 2032
- Figure 7: Asia Pacific Management Decision Industry Revenue Share (%), by Country 2024 & 2032
- Figure 8: South America Management Decision Industry Revenue (Million), by Country 2024 & 2032
- Figure 9: South America Management Decision Industry Revenue Share (%), by Country 2024 & 2032
- Figure 10: North America Management Decision Industry Revenue (Million), by Country 2024 & 2032
- Figure 11: North America Management Decision Industry Revenue Share (%), by Country 2024 & 2032
- Figure 12: MEA Management Decision Industry Revenue (Million), by Country 2024 & 2032
- Figure 13: MEA Management Decision Industry Revenue Share (%), by Country 2024 & 2032
- Figure 14: North America Management Decision Industry Revenue (Million), by Component 2024 & 2032
- Figure 15: North America Management Decision Industry Revenue Share (%), by Component 2024 & 2032
- Figure 16: North America Management Decision Industry Revenue (Million), by Deployment Type 2024 & 2032
- Figure 17: North America Management Decision Industry Revenue Share (%), by Deployment Type 2024 & 2032
- Figure 18: North America Management Decision Industry Revenue (Million), by End-User Industry 2024 & 2032
- Figure 19: North America Management Decision Industry Revenue Share (%), by End-User Industry 2024 & 2032
- Figure 20: North America Management Decision Industry Revenue (Million), by Country 2024 & 2032
- Figure 21: North America Management Decision Industry Revenue Share (%), by Country 2024 & 2032
- Figure 22: Europe Management Decision Industry Revenue (Million), by Component 2024 & 2032
- Figure 23: Europe Management Decision Industry Revenue Share (%), by Component 2024 & 2032
- Figure 24: Europe Management Decision Industry Revenue (Million), by Deployment Type 2024 & 2032
- Figure 25: Europe Management Decision Industry Revenue Share (%), by Deployment Type 2024 & 2032
- Figure 26: Europe Management Decision Industry Revenue (Million), by End-User Industry 2024 & 2032
- Figure 27: Europe Management Decision Industry Revenue Share (%), by End-User Industry 2024 & 2032
- Figure 28: Europe Management Decision Industry Revenue (Million), by Country 2024 & 2032
- Figure 29: Europe Management Decision Industry Revenue Share (%), by Country 2024 & 2032
- Figure 30: Asia Pacific Management Decision Industry Revenue (Million), by Component 2024 & 2032
- Figure 31: Asia Pacific Management Decision Industry Revenue Share (%), by Component 2024 & 2032
- Figure 32: Asia Pacific Management Decision Industry Revenue (Million), by Deployment Type 2024 & 2032
- Figure 33: Asia Pacific Management Decision Industry Revenue Share (%), by Deployment Type 2024 & 2032
- Figure 34: Asia Pacific Management Decision Industry Revenue (Million), by End-User Industry 2024 & 2032
- Figure 35: Asia Pacific Management Decision Industry Revenue Share (%), by End-User Industry 2024 & 2032
- Figure 36: Asia Pacific Management Decision Industry Revenue (Million), by Country 2024 & 2032
- Figure 37: Asia Pacific Management Decision Industry Revenue Share (%), by Country 2024 & 2032
- Figure 38: Latin America Management Decision Industry Revenue (Million), by Component 2024 & 2032
- Figure 39: Latin America Management Decision Industry Revenue Share (%), by Component 2024 & 2032
- Figure 40: Latin America Management Decision Industry Revenue (Million), by Deployment Type 2024 & 2032
- Figure 41: Latin America Management Decision Industry Revenue Share (%), by Deployment Type 2024 & 2032
- Figure 42: Latin America Management Decision Industry Revenue (Million), by End-User Industry 2024 & 2032
- Figure 43: Latin America Management Decision Industry Revenue Share (%), by End-User Industry 2024 & 2032
- Figure 44: Latin America Management Decision Industry Revenue (Million), by Country 2024 & 2032
- Figure 45: Latin America Management Decision Industry Revenue Share (%), by Country 2024 & 2032
- Figure 46: Middle East and Africa Management Decision Industry Revenue (Million), by Component 2024 & 2032
- Figure 47: Middle East and Africa Management Decision Industry Revenue Share (%), by Component 2024 & 2032
- Figure 48: Middle East and Africa Management Decision Industry Revenue (Million), by Deployment Type 2024 & 2032
- Figure 49: Middle East and Africa Management Decision Industry Revenue Share (%), by Deployment Type 2024 & 2032
- Figure 50: Middle East and Africa Management Decision Industry Revenue (Million), by End-User Industry 2024 & 2032
- Figure 51: Middle East and Africa Management Decision Industry Revenue Share (%), by End-User Industry 2024 & 2032
- Figure 52: Middle East and Africa Management Decision Industry Revenue (Million), by Country 2024 & 2032
- Figure 53: Middle East and Africa Management Decision Industry Revenue Share (%), by Country 2024 & 2032
List of Tables
- Table 1: Global Management Decision Industry Revenue Million Forecast, by Region 2019 & 2032
- Table 2: Global Management Decision Industry Revenue Million Forecast, by Component 2019 & 2032
- Table 3: Global Management Decision Industry Revenue Million Forecast, by Deployment Type 2019 & 2032
- Table 4: Global Management Decision Industry Revenue Million Forecast, by End-User Industry 2019 & 2032
- Table 5: Global Management Decision Industry Revenue Million Forecast, by Region 2019 & 2032
- Table 6: Global Management Decision Industry Revenue Million Forecast, by Country 2019 & 2032
- Table 7: United States Management Decision Industry Revenue (Million) Forecast, by Application 2019 & 2032
- Table 8: Canada Management Decision Industry Revenue (Million) Forecast, by Application 2019 & 2032
- Table 9: Mexico Management Decision Industry Revenue (Million) Forecast, by Application 2019 & 2032
- Table 10: Global Management Decision Industry Revenue Million Forecast, by Country 2019 & 2032
- Table 11: Germany Management Decision Industry Revenue (Million) Forecast, by Application 2019 & 2032
- Table 12: United Kingdom Management Decision Industry Revenue (Million) Forecast, by Application 2019 & 2032
- Table 13: France Management Decision Industry Revenue (Million) Forecast, by Application 2019 & 2032
- Table 14: Spain Management Decision Industry Revenue (Million) Forecast, by Application 2019 & 2032
- Table 15: Italy Management Decision Industry Revenue (Million) Forecast, by Application 2019 & 2032
- Table 16: Spain Management Decision Industry Revenue (Million) Forecast, by Application 2019 & 2032
- Table 17: Belgium Management Decision Industry Revenue (Million) Forecast, by Application 2019 & 2032
- Table 18: Netherland Management Decision Industry Revenue (Million) Forecast, by Application 2019 & 2032
- Table 19: Nordics Management Decision Industry Revenue (Million) Forecast, by Application 2019 & 2032
- Table 20: Rest of Europe Management Decision Industry Revenue (Million) Forecast, by Application 2019 & 2032
- Table 21: Global Management Decision Industry Revenue Million Forecast, by Country 2019 & 2032
- Table 22: China Management Decision Industry Revenue (Million) Forecast, by Application 2019 & 2032
- Table 23: Japan Management Decision Industry Revenue (Million) Forecast, by Application 2019 & 2032
- Table 24: India Management Decision Industry Revenue (Million) Forecast, by Application 2019 & 2032
- Table 25: South Korea Management Decision Industry Revenue (Million) Forecast, by Application 2019 & 2032
- Table 26: Southeast Asia Management Decision Industry Revenue (Million) Forecast, by Application 2019 & 2032
- Table 27: Australia Management Decision Industry Revenue (Million) Forecast, by Application 2019 & 2032
- Table 28: Indonesia Management Decision Industry Revenue (Million) Forecast, by Application 2019 & 2032
- Table 29: Phillipes Management Decision Industry Revenue (Million) Forecast, by Application 2019 & 2032
- Table 30: Singapore Management Decision Industry Revenue (Million) Forecast, by Application 2019 & 2032
- Table 31: Thailandc Management Decision Industry Revenue (Million) Forecast, by Application 2019 & 2032
- Table 32: Rest of Asia Pacific Management Decision Industry Revenue (Million) Forecast, by Application 2019 & 2032
- Table 33: Global Management Decision Industry Revenue Million Forecast, by Country 2019 & 2032
- Table 34: Brazil Management Decision Industry Revenue (Million) Forecast, by Application 2019 & 2032
- Table 35: Argentina Management Decision Industry Revenue (Million) Forecast, by Application 2019 & 2032
- Table 36: Peru Management Decision Industry Revenue (Million) Forecast, by Application 2019 & 2032
- Table 37: Chile Management Decision Industry Revenue (Million) Forecast, by Application 2019 & 2032
- Table 38: Colombia Management Decision Industry Revenue (Million) Forecast, by Application 2019 & 2032
- Table 39: Ecuador Management Decision Industry Revenue (Million) Forecast, by Application 2019 & 2032
- Table 40: Venezuela Management Decision Industry Revenue (Million) Forecast, by Application 2019 & 2032
- Table 41: Rest of South America Management Decision Industry Revenue (Million) Forecast, by Application 2019 & 2032
- Table 42: Global Management Decision Industry Revenue Million Forecast, by Country 2019 & 2032
- Table 43: United States Management Decision Industry Revenue (Million) Forecast, by Application 2019 & 2032
- Table 44: Canada Management Decision Industry Revenue (Million) Forecast, by Application 2019 & 2032
- Table 45: Mexico Management Decision Industry Revenue (Million) Forecast, by Application 2019 & 2032
- Table 46: Global Management Decision Industry Revenue Million Forecast, by Country 2019 & 2032
- Table 47: United Arab Emirates Management Decision Industry Revenue (Million) Forecast, by Application 2019 & 2032
- Table 48: Saudi Arabia Management Decision Industry Revenue (Million) Forecast, by Application 2019 & 2032
- Table 49: South Africa Management Decision Industry Revenue (Million) Forecast, by Application 2019 & 2032
- Table 50: Rest of Middle East and Africa Management Decision Industry Revenue (Million) Forecast, by Application 2019 & 2032
- Table 51: Global Management Decision Industry Revenue Million Forecast, by Component 2019 & 2032
- Table 52: Global Management Decision Industry Revenue Million Forecast, by Deployment Type 2019 & 2032
- Table 53: Global Management Decision Industry Revenue Million Forecast, by End-User Industry 2019 & 2032
- Table 54: Global Management Decision Industry Revenue Million Forecast, by Country 2019 & 2032
- Table 55: United States Management Decision Industry Revenue (Million) Forecast, by Application 2019 & 2032
- Table 56: Canada Management Decision Industry Revenue (Million) Forecast, by Application 2019 & 2032
- Table 57: Rest of North America Management Decision Industry Revenue (Million) Forecast, by Application 2019 & 2032
- Table 58: Global Management Decision Industry Revenue Million Forecast, by Component 2019 & 2032
- Table 59: Global Management Decision Industry Revenue Million Forecast, by Deployment Type 2019 & 2032
- Table 60: Global Management Decision Industry Revenue Million Forecast, by End-User Industry 2019 & 2032
- Table 61: Global Management Decision Industry Revenue Million Forecast, by Country 2019 & 2032
- Table 62: Germany Management Decision Industry Revenue (Million) Forecast, by Application 2019 & 2032
- Table 63: United Kingdom Management Decision Industry Revenue (Million) Forecast, by Application 2019 & 2032
- Table 64: France Management Decision Industry Revenue (Million) Forecast, by Application 2019 & 2032
- Table 65: Spain Management Decision Industry Revenue (Million) Forecast, by Application 2019 & 2032
- Table 66: Rest of Europe Management Decision Industry Revenue (Million) Forecast, by Application 2019 & 2032
- Table 67: Global Management Decision Industry Revenue Million Forecast, by Component 2019 & 2032
- Table 68: Global Management Decision Industry Revenue Million Forecast, by Deployment Type 2019 & 2032
- Table 69: Global Management Decision Industry Revenue Million Forecast, by End-User Industry 2019 & 2032
- Table 70: Global Management Decision Industry Revenue Million Forecast, by Country 2019 & 2032
- Table 71: China Management Decision Industry Revenue (Million) Forecast, by Application 2019 & 2032
- Table 72: Japan Management Decision Industry Revenue (Million) Forecast, by Application 2019 & 2032
- Table 73: India Management Decision Industry Revenue (Million) Forecast, by Application 2019 & 2032
- Table 74: Rest of Asia Pacific Management Decision Industry Revenue (Million) Forecast, by Application 2019 & 2032
- Table 75: Global Management Decision Industry Revenue Million Forecast, by Component 2019 & 2032
- Table 76: Global Management Decision Industry Revenue Million Forecast, by Deployment Type 2019 & 2032
- Table 77: Global Management Decision Industry Revenue Million Forecast, by End-User Industry 2019 & 2032
- Table 78: Global Management Decision Industry Revenue Million Forecast, by Country 2019 & 2032
- Table 79: Brazil Management Decision Industry Revenue (Million) Forecast, by Application 2019 & 2032
- Table 80: Argentina Management Decision Industry Revenue (Million) Forecast, by Application 2019 & 2032
- Table 81: Rest of Latin America Management Decision Industry Revenue (Million) Forecast, by Application 2019 & 2032
- Table 82: Global Management Decision Industry Revenue Million Forecast, by Component 2019 & 2032
- Table 83: Global Management Decision Industry Revenue Million Forecast, by Deployment Type 2019 & 2032
- Table 84: Global Management Decision Industry Revenue Million Forecast, by End-User Industry 2019 & 2032
- Table 85: Global Management Decision Industry Revenue Million Forecast, by Country 2019 & 2032
- Table 86: UAE Management Decision Industry Revenue (Million) Forecast, by Application 2019 & 2032
- Table 87: Saudi Arabia Management Decision Industry Revenue (Million) Forecast, by Application 2019 & 2032
- Table 88: South Africa Management Decision Industry Revenue (Million) Forecast, by Application 2019 & 2032
- Table 89: Rest of Middle East and Africa Management Decision Industry Revenue (Million) Forecast, by Application 2019 & 2032
Frequently Asked Questions
1. What is the projected Compound Annual Growth Rate (CAGR) of the Management Decision Industry?
The projected CAGR is approximately 13.64%.
2. Which companies are prominent players in the Management Decision Industry?
Key companies in the market include SAS Institute Inc, Scorto Inc, Sparkling Logic Inc, TIBCO Software Inc, IBM Corporation, InRule Technology Inc, DMC Dubai (Decision Management Consultants)*List Not Exhaustive, FICO (Fair Isaac Corporation), Experian Information Solutions Inc, Pegasystems Inc, Actico GmbH, Sapiens International Corporation, Oracle Corporation, Equifax Inc, SAP SE.
3. What are the main segments of the Management Decision Industry?
The market segments include Component, Deployment Type, End-User Industry.
4. Can you provide details about the market size?
The market size is estimated to be USD 6.55 Million as of 2022.
5. What are some drivers contributing to market growth?
Increasing need for business agility which requires faster and efficient decision making; Increasing demand for Decision Analytics in BFSI sector to drive the market.
6. What are the notable trends driving market growth?
BSFI Sector is Expected to Hold Significant Share.
7. Are there any restraints impacting market growth?
High monetary cost involved for the implementation.
8. Can you provide examples of recent developments in the market?
November 2022 - IBM introduced Business Analytics Enterprise, a more advanced version of the program allowing companies to acquire a thorough perspective of the data sources across their entire business. The program will assist in business intelligence planning, budgeting, reporting, forecasting, and dashboard capabilities.
9. What pricing options are available for accessing the report?
Pricing options include single-user, multi-user, and enterprise licenses priced at USD 4750, USD 5250, and USD 8750 respectively.
10. Is the market size provided in terms of value or volume?
The market size is provided in terms of value, measured in Million.
11. Are there any specific market keywords associated with the report?
Yes, the market keyword associated with the report is "Management Decision Industry," which aids in identifying and referencing the specific market segment covered.
12. How do I determine which pricing option suits my needs best?
The pricing options vary based on user requirements and access needs. Individual users may opt for single-user licenses, while businesses requiring broader access may choose multi-user or enterprise licenses for cost-effective access to the report.
13. Are there any additional resources or data provided in the Management Decision Industry report?
While the report offers comprehensive insights, it's advisable to review the specific contents or supplementary materials provided to ascertain if additional resources or data are available.
14. How can I stay updated on further developments or reports in the Management Decision Industry?
To stay informed about further developments, trends, and reports in the Management Decision Industry, consider subscribing to industry newsletters, following relevant companies and organizations, or regularly checking reputable industry news sources and publications.
Methodology
Step 1 - Identification of Relevant Samples Size from Population Database


Step 2 - Approaches for Defining Global Market Size (Value, Volume* & Price*)

Note*: In applicable scenarios
Step 3 - Data Sources
Primary Research
- Web Analytics
- Survey Reports
- Research Institute
- Latest Research Reports
- Opinion Leaders
Secondary Research
- Annual Reports
- White Paper
- Latest Press Release
- Industry Association
- Paid Database
- Investor Presentations

Step 4 - Data Triangulation
Involves using different sources of information in order to increase the validity of a study
These sources are likely to be stakeholders in a program - participants, other researchers, program staff, other community members, and so on.
Then we put all data in single framework & apply various statistical tools to find out the dynamic on the market.
During the analysis stage, feedback from the stakeholder groups would be compared to determine areas of agreement as well as areas of divergence


