

Key Insights
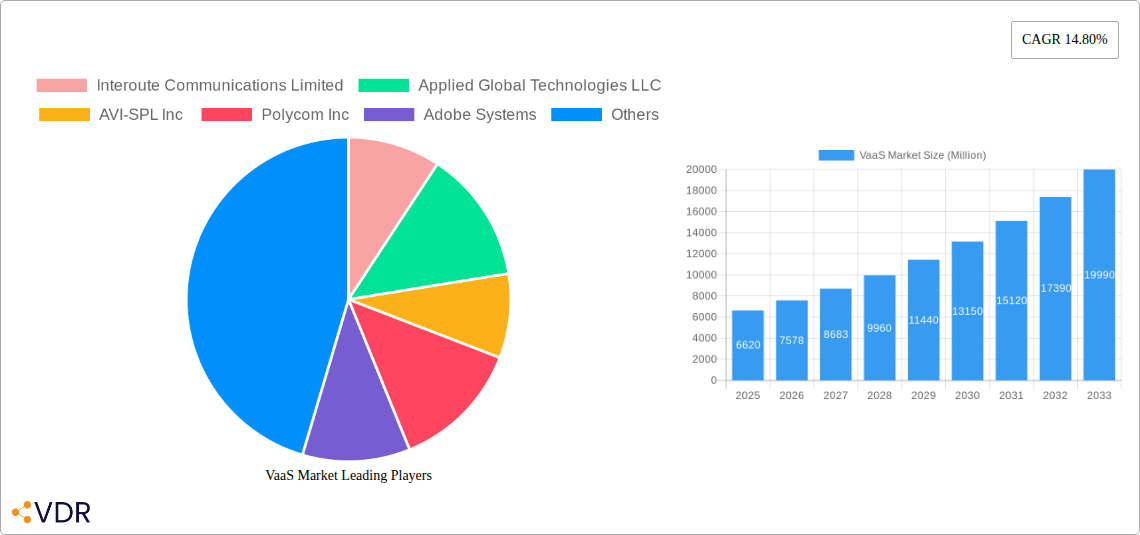
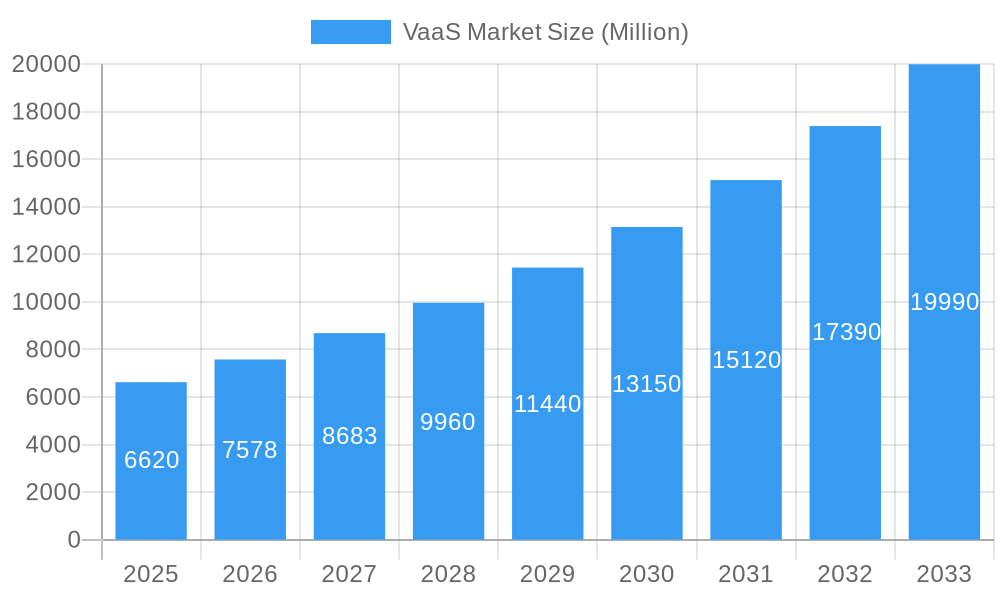
The Video-as-a-Service (VaaS) market is experiencing robust growth, projected to reach a market size of $6.62 billion in 2025, expanding at a Compound Annual Growth Rate (CAGR) of 14.80%. This significant expansion is driven by several key factors. The increasing adoption of cloud-based solutions across various industries, particularly in sectors like Government and Defense, BFSI (Banking, Financial Services, and Insurance), and Healthcare, is fueling demand for scalable and cost-effective video communication and collaboration tools. Furthermore, the rising prevalence of hybrid work models and the need for enhanced remote collaboration are significantly boosting VaaS adoption. Technological advancements, such as improved video quality, enhanced security features, and the integration of AI-powered analytics, are further contributing to market growth. The market is segmented by service type (managed vs. professional), deployment model (public, private, and hybrid cloud), end-user industry, platform (application, device, and network management), and device type (mobility and enterprise computing). North America currently holds a significant market share, followed by Europe and Asia-Pacific, with growth potential across all regions.
VaaS Market Market Size (In Billion)
The competitive landscape is characterized by a mix of established players like Cisco, Avaya, and Polycom, alongside emerging technology providers. Strategic partnerships, mergers, and acquisitions are common strategies employed by companies to expand their market reach and service offerings. While the market faces challenges such as security concerns associated with cloud-based solutions and the need for robust network infrastructure, the overall positive growth trajectory is expected to continue through 2033. The increasing demand for seamless video communication across various devices and platforms will continue to drive innovation and adoption within the VaaS market, further solidifying its position as a critical component of modern business communication strategies.
VaaS Market Company Market Share
VaaS Market Report: A Comprehensive Analysis (2019-2033)
This comprehensive report provides an in-depth analysis of the Video as a Service (VaaS) market, encompassing market dynamics, growth trends, dominant segments, and key players. The study period covers 2019-2033, with 2025 as the base and estimated year. The forecast period spans 2025-2033, and the historical period covers 2019-2024. This report is essential for industry professionals, investors, and strategists seeking to understand and capitalize on the evolving VaaS landscape. The total market value in 2025 is estimated at xx Million.
VaaS Market Dynamics & Structure
The VaaS market is characterized by moderate concentration, with a few major players holding significant market share, alongside numerous smaller niche providers. Technological innovation, particularly advancements in cloud computing, 5G networks, and AI-powered video analytics, are key drivers. Regulatory frameworks concerning data privacy and security are increasingly influential. Competitive substitutes include traditional video conferencing solutions and other communication platforms. The end-user demographics are broad, spanning across diverse industries with varying adoption rates. M&A activity has been relatively consistent, with xx deals recorded in the last five years, driving consolidation and market expansion.
- Market Concentration: Moderately concentrated, with top 5 players holding approximately xx% market share (2025).
- Technological Innovation: Cloud-based solutions, AI-powered features, and improved video quality are major drivers.
- Regulatory Landscape: Data privacy regulations (e.g., GDPR, CCPA) are shaping market practices.
- Competitive Substitutes: Traditional video conferencing systems and other communication tools pose competition.
- M&A Activity: An average of xx M&A deals per year (2020-2024), indicating ongoing consolidation.
- Innovation Barriers: High initial investment costs for infrastructure and technology development.
VaaS Market Growth Trends & Insights
The VaaS market has experienced robust growth in recent years, driven by increasing demand for remote collaboration, improved video conferencing capabilities, and the rising adoption of cloud-based solutions. The market size has grown from xx Million in 2019 to an estimated xx Million in 2025, exhibiting a CAGR of xx% during the historical period. This growth is expected to continue, with a projected CAGR of xx% during the forecast period (2025-2033), reaching xx Million by 2033. Market penetration is currently at xx% and is anticipated to increase significantly in the coming years, particularly in emerging economies. Technological disruptions, such as the integration of AI and VR/AR technologies, are creating new growth opportunities. Shifting consumer behavior, with increased preference for flexible and scalable solutions, further fuels market expansion.
Dominant Regions, Countries, or Segments in VaaS Market
North America currently holds the largest market share in the VaaS market, driven by high technology adoption rates, robust infrastructure, and the presence of major players. However, the Asia-Pacific region is expected to experience the fastest growth during the forecast period, fueled by increasing digitalization and the expansion of businesses. Within the segments, the Managed Services segment dominates by revenue, followed by Professional Services. Public Cloud deployment models are seeing rapid adoption. The IT & Telecom and BFSI sectors are the leading end-user industries, while Application Management is the leading platform.
- Leading Region: North America (market share xx% in 2025)
- Fastest-Growing Region: Asia-Pacific (projected CAGR of xx% during 2025-2033)
- Dominant Service Segment: Managed Services (market share xx% in 2025)
- Dominant Deployment Model: Public Cloud (market share xx% in 2025)
- Leading End-User Industry: IT & Telecom (market share xx% in 2025)
- Leading Platform: Application Management (market share xx% in 2025)
- Key Drivers: Government initiatives promoting digital transformation, expanding high-speed internet access.
VaaS Market Product Landscape
The VaaS market showcases a wide range of products, from basic video conferencing tools to sophisticated platforms integrating AI-powered features, such as real-time transcription, translation, and analytics. Key innovations include improved video quality, enhanced security features, and seamless integration with other collaboration tools. Products are differentiated by their scalability, ease of use, pricing models, and integration capabilities. Unique selling propositions focus on enhanced user experience, cost-effectiveness, and robust security features.
Key Drivers, Barriers & Challenges in VaaS Market
Key Drivers: The increasing need for remote collaboration, enhanced communication efficiency, and cost savings associated with cloud-based solutions are major driving forces. Technological advancements, such as AI and improved network infrastructure, also contribute significantly. Government initiatives promoting digitalization further fuel market growth.
Key Challenges: Security concerns surrounding data breaches, high initial investment costs, and the complexity of integrating VaaS solutions with existing IT infrastructure pose significant challenges. Competition from established players and emerging technologies also adds pressure. Supply chain disruptions may affect the availability of hardware components, while regulatory hurdles can impact market expansion.
Emerging Opportunities in VaaS Market
The integration of VaaS with emerging technologies like AR/VR and the Metaverse presents significant opportunities. Expansion into untapped markets, particularly in developing economies, offers considerable growth potential. The increasing demand for personalized and customized VaaS solutions, tailored to specific industry needs, creates further opportunities. Growing adoption in sectors like education and healthcare presents lucrative avenues for expansion.
Growth Accelerators in the VaaS Market Industry
Strategic partnerships between VaaS providers and other technology companies are driving market expansion. Continuous technological innovation, particularly in AI, 5G, and cloud computing, significantly accelerates growth. Expanding into new geographical markets and targeting underserved industries fuels long-term growth. The increasing adoption of hybrid work models further strengthens market prospects.
Key Players Shaping the VaaS Market Market
- Interoute Communications Limited
- Applied Global Technologies LLC
- AVI-SPL Inc
- Polycom Inc
- Adobe Systems
- Cisco Systems Inc
- Avaya Inc
- BlueJeans Network
- Huawei Technologies Co Limited
- Vidyo Inc
Notable Milestones in VaaS Market Sector
- November 2022: Tesla integrates Zoom app into its vehicle infotainment system, expanding VaaS into the automotive sector.
- October 2022: Cisco and Microsoft announce a strategic alliance, enhancing Microsoft Teams integration with Cisco devices.
In-Depth VaaS Market Market Outlook
The VaaS market is poised for continued strong growth, driven by ongoing technological advancements and increasing demand for seamless communication solutions. Strategic partnerships, expansion into new markets, and innovation in areas such as AI and VR/AR will further accelerate market expansion. The market presents attractive opportunities for both established players and new entrants, particularly those focusing on niche applications and emerging technologies.
VaaS Market Segmentation
-
1. Platform
- 1.1. Application Management
- 1.2. Device Management
- 1.3. Network Management
-
2. Device
- 2.1. Mobility Devices
- 2.2. Enterprise Computing
-
3. Service
- 3.1. Managed
- 3.2. Professional
-
4. Deployment Model
- 4.1. Public Cloud
- 4.2. Private Cloud
- 4.3. Hybrid Cloud
-
5. End-user Industry
- 5.1. Government and Defense
- 5.2. BFSI
- 5.3. Healthcare
- 5.4. IT & Telecom
- 5.5. Media & Entertainment
- 5.6. Manufacturing
- 5.7. Other End-user Industries
VaaS Market Segmentation By Geography
- 1. North America
- 2. Europe
- 3. Asia
- 4. Latin America
- 5. Middle East and Africa
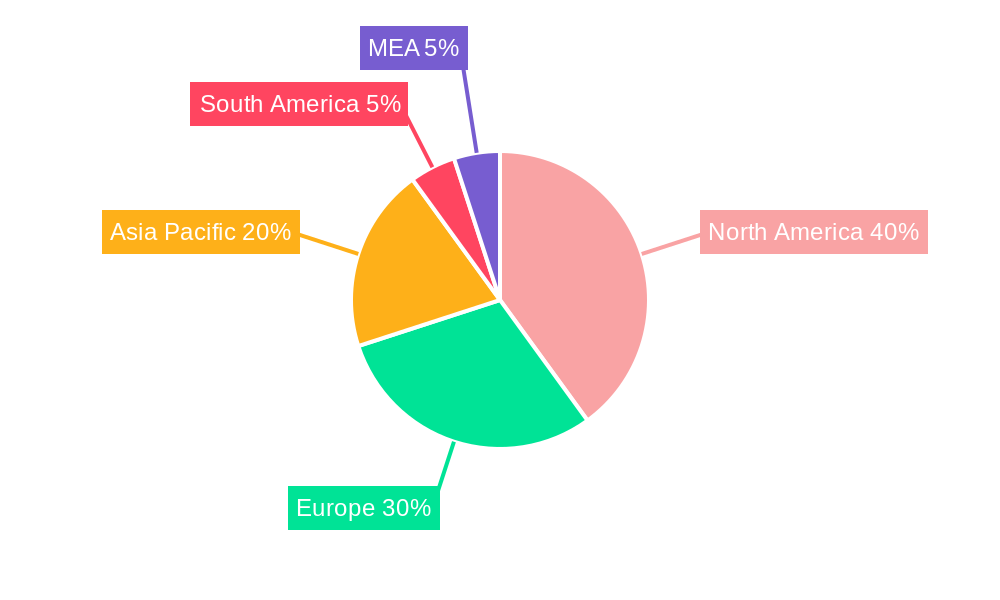
VaaS Market Regional Market Share
Geographic Coverage of VaaS Market
VaaS Market REPORT HIGHLIGHTS
| Aspects | Details |
|---|---|
| Study Period | 2020-2034 |
| Base Year | 2025 |
| Estimated Year | 2026 |
| Forecast Period | 2026-2034 |
| Historical Period | 2020-2025 |
| Growth Rate | CAGR of 14.80% from 2020-2034 |
| Segmentation |
|
Table of Contents
- 1. Introduction
- 1.1. Research Scope
- 1.2. Market Segmentation
- 1.3. Research Objective
- 1.4. Definitions and Assumptions
- 2. Executive Summary
- 2.1. Market Snapshot
- 3. Market Dynamics
- 3.1. Market Drivers
- 3.2. Market Restrains
- 3.3. Market Trends
- 3.4. Market Opportunities
- 4. Market Factor Analysis
- 4.1. Porters Five Forces
- 4.1.1. Bargaining Power of Suppliers
- 4.1.2. Bargaining Power of Buyers
- 4.1.3. Threat of New Entrants
- 4.1.4. Threat of Substitutes
- 4.1.5. Competitive Rivalry
- 4.2. PESTEL analysis
- 4.3. BCG Analysis
- 4.3.1. Stars (High Growth, High Market Share)
- 4.3.2. Cash Cows (Low Growth, High Market Share)
- 4.3.3. Question Mark (High Growth, Low Market Share)
- 4.3.4. Dogs (Low Growth, Low Market Share)
- 4.4. Ansoff Matrix Analysis
- 4.5. Supply Chain Analysis
- 4.6. Regulatory Landscape
- 4.7. Current Market Potential and Opportunity Assessment (TAM–SAM–SOM Framework)
- 4.8. VDR Analyst Note
- 4.1. Porters Five Forces
- 5. Market Analysis, Insights and Forecast 2021-2033
- 5.1. Market Analysis, Insights and Forecast - by Platform
- 5.1.1. Application Management
- 5.1.2. Device Management
- 5.1.3. Network Management
- 5.2. Market Analysis, Insights and Forecast - by Device
- 5.2.1. Mobility Devices
- 5.2.2. Enterprise Computing
- 5.3. Market Analysis, Insights and Forecast - by Service
- 5.3.1. Managed
- 5.3.2. Professional
- 5.4. Market Analysis, Insights and Forecast - by Deployment Model
- 5.4.1. Public Cloud
- 5.4.2. Private Cloud
- 5.4.3. Hybrid Cloud
- 5.5. Market Analysis, Insights and Forecast - by End-user Industry
- 5.5.1. Government and Defense
- 5.5.2. BFSI
- 5.5.3. Healthcare
- 5.5.4. IT & Telecom
- 5.5.5. Media & Entertainment
- 5.5.6. Manufacturing
- 5.5.7. Other End-user Industries
- 5.6. Market Analysis, Insights and Forecast - by Region
- 5.6.1. North America
- 5.6.2. Europe
- 5.6.3. Asia
- 5.6.4. Latin America
- 5.6.5. Middle East and Africa
- 5.1. Market Analysis, Insights and Forecast - by Platform
- 6. Global VaaS Market Analysis, Insights and Forecast, 2021-2033
- 6.1. Market Analysis, Insights and Forecast - by Platform
- 6.1.1. Application Management
- 6.1.2. Device Management
- 6.1.3. Network Management
- 6.2. Market Analysis, Insights and Forecast - by Device
- 6.2.1. Mobility Devices
- 6.2.2. Enterprise Computing
- 6.3. Market Analysis, Insights and Forecast - by Service
- 6.3.1. Managed
- 6.3.2. Professional
- 6.4. Market Analysis, Insights and Forecast - by Deployment Model
- 6.4.1. Public Cloud
- 6.4.2. Private Cloud
- 6.4.3. Hybrid Cloud
- 6.5. Market Analysis, Insights and Forecast - by End-user Industry
- 6.5.1. Government and Defense
- 6.5.2. BFSI
- 6.5.3. Healthcare
- 6.5.4. IT & Telecom
- 6.5.5. Media & Entertainment
- 6.5.6. Manufacturing
- 6.5.7. Other End-user Industries
- 6.1. Market Analysis, Insights and Forecast - by Platform
- 7. North America VaaS Market Analysis, Insights and Forecast, 2021-2033
- 7.1. Market Analysis, Insights and Forecast - by Platform
- 7.1.1. Application Management
- 7.1.2. Device Management
- 7.1.3. Network Management
- 7.2. Market Analysis, Insights and Forecast - by Device
- 7.2.1. Mobility Devices
- 7.2.2. Enterprise Computing
- 7.3. Market Analysis, Insights and Forecast - by Service
- 7.3.1. Managed
- 7.3.2. Professional
- 7.4. Market Analysis, Insights and Forecast - by Deployment Model
- 7.4.1. Public Cloud
- 7.4.2. Private Cloud
- 7.4.3. Hybrid Cloud
- 7.5. Market Analysis, Insights and Forecast - by End-user Industry
- 7.5.1. Government and Defense
- 7.5.2. BFSI
- 7.5.3. Healthcare
- 7.5.4. IT & Telecom
- 7.5.5. Media & Entertainment
- 7.5.6. Manufacturing
- 7.5.7. Other End-user Industries
- 7.1. Market Analysis, Insights and Forecast - by Platform
- 8. Europe VaaS Market Analysis, Insights and Forecast, 2021-2033
- 8.1. Market Analysis, Insights and Forecast - by Platform
- 8.1.1. Application Management
- 8.1.2. Device Management
- 8.1.3. Network Management
- 8.2. Market Analysis, Insights and Forecast - by Device
- 8.2.1. Mobility Devices
- 8.2.2. Enterprise Computing
- 8.3. Market Analysis, Insights and Forecast - by Service
- 8.3.1. Managed
- 8.3.2. Professional
- 8.4. Market Analysis, Insights and Forecast - by Deployment Model
- 8.4.1. Public Cloud
- 8.4.2. Private Cloud
- 8.4.3. Hybrid Cloud
- 8.5. Market Analysis, Insights and Forecast - by End-user Industry
- 8.5.1. Government and Defense
- 8.5.2. BFSI
- 8.5.3. Healthcare
- 8.5.4. IT & Telecom
- 8.5.5. Media & Entertainment
- 8.5.6. Manufacturing
- 8.5.7. Other End-user Industries
- 8.1. Market Analysis, Insights and Forecast - by Platform
- 9. Asia VaaS Market Analysis, Insights and Forecast, 2021-2033
- 9.1. Market Analysis, Insights and Forecast - by Platform
- 9.1.1. Application Management
- 9.1.2. Device Management
- 9.1.3. Network Management
- 9.2. Market Analysis, Insights and Forecast - by Device
- 9.2.1. Mobility Devices
- 9.2.2. Enterprise Computing
- 9.3. Market Analysis, Insights and Forecast - by Service
- 9.3.1. Managed
- 9.3.2. Professional
- 9.4. Market Analysis, Insights and Forecast - by Deployment Model
- 9.4.1. Public Cloud
- 9.4.2. Private Cloud
- 9.4.3. Hybrid Cloud
- 9.5. Market Analysis, Insights and Forecast - by End-user Industry
- 9.5.1. Government and Defense
- 9.5.2. BFSI
- 9.5.3. Healthcare
- 9.5.4. IT & Telecom
- 9.5.5. Media & Entertainment
- 9.5.6. Manufacturing
- 9.5.7. Other End-user Industries
- 9.1. Market Analysis, Insights and Forecast - by Platform
- 10. Latin America VaaS Market Analysis, Insights and Forecast, 2021-2033
- 10.1. Market Analysis, Insights and Forecast - by Platform
- 10.1.1. Application Management
- 10.1.2. Device Management
- 10.1.3. Network Management
- 10.2. Market Analysis, Insights and Forecast - by Device
- 10.2.1. Mobility Devices
- 10.2.2. Enterprise Computing
- 10.3. Market Analysis, Insights and Forecast - by Service
- 10.3.1. Managed
- 10.3.2. Professional
- 10.4. Market Analysis, Insights and Forecast - by Deployment Model
- 10.4.1. Public Cloud
- 10.4.2. Private Cloud
- 10.4.3. Hybrid Cloud
- 10.5. Market Analysis, Insights and Forecast - by End-user Industry
- 10.5.1. Government and Defense
- 10.5.2. BFSI
- 10.5.3. Healthcare
- 10.5.4. IT & Telecom
- 10.5.5. Media & Entertainment
- 10.5.6. Manufacturing
- 10.5.7. Other End-user Industries
- 10.1. Market Analysis, Insights and Forecast - by Platform
- 11. Middle East and Africa VaaS Market Analysis, Insights and Forecast, 2021-2033
- 11.1. Market Analysis, Insights and Forecast - by Platform
- 11.1.1. Application Management
- 11.1.2. Device Management
- 11.1.3. Network Management
- 11.2. Market Analysis, Insights and Forecast - by Device
- 11.2.1. Mobility Devices
- 11.2.2. Enterprise Computing
- 11.3. Market Analysis, Insights and Forecast - by Service
- 11.3.1. Managed
- 11.3.2. Professional
- 11.4. Market Analysis, Insights and Forecast - by Deployment Model
- 11.4.1. Public Cloud
- 11.4.2. Private Cloud
- 11.4.3. Hybrid Cloud
- 11.5. Market Analysis, Insights and Forecast - by End-user Industry
- 11.5.1. Government and Defense
- 11.5.2. BFSI
- 11.5.3. Healthcare
- 11.5.4. IT & Telecom
- 11.5.5. Media & Entertainment
- 11.5.6. Manufacturing
- 11.5.7. Other End-user Industries
- 11.1. Market Analysis, Insights and Forecast - by Platform
- 12. Competitive Analysis
- 12.1. Company Profiles
- 12.1.1 Interoute Communications Limited
- 12.1.1.1. Company Overview
- 12.1.1.2. Products
- 12.1.1.3. Company Financials
- 12.1.1.4. SWOT Analysis
- 12.1.2 Applied Global Technologies LLC
- 12.1.2.1. Company Overview
- 12.1.2.2. Products
- 12.1.2.3. Company Financials
- 12.1.2.4. SWOT Analysis
- 12.1.3 AVI-SPL Inc
- 12.1.3.1. Company Overview
- 12.1.3.2. Products
- 12.1.3.3. Company Financials
- 12.1.3.4. SWOT Analysis
- 12.1.4 Polycom Inc
- 12.1.4.1. Company Overview
- 12.1.4.2. Products
- 12.1.4.3. Company Financials
- 12.1.4.4. SWOT Analysis
- 12.1.5 Adobe Systems
- 12.1.5.1. Company Overview
- 12.1.5.2. Products
- 12.1.5.3. Company Financials
- 12.1.5.4. SWOT Analysis
- 12.1.6 Cisco Systems Inc
- 12.1.6.1. Company Overview
- 12.1.6.2. Products
- 12.1.6.3. Company Financials
- 12.1.6.4. SWOT Analysis
- 12.1.7 Avaya Inc
- 12.1.7.1. Company Overview
- 12.1.7.2. Products
- 12.1.7.3. Company Financials
- 12.1.7.4. SWOT Analysis
- 12.1.8 BlueJeans Network
- 12.1.8.1. Company Overview
- 12.1.8.2. Products
- 12.1.8.3. Company Financials
- 12.1.8.4. SWOT Analysis
- 12.1.9 Huawei Technologies Co Limited
- 12.1.9.1. Company Overview
- 12.1.9.2. Products
- 12.1.9.3. Company Financials
- 12.1.9.4. SWOT Analysis
- 12.1.10 Vidyo Inc
- 12.1.10.1. Company Overview
- 12.1.10.2. Products
- 12.1.10.3. Company Financials
- 12.1.10.4. SWOT Analysis
- 12.1.1 Interoute Communications Limited
- 12.2. Market Entropy
- 12.2.1 Company's Key Areas Served
- 12.2.2 Recent Developments
- 12.3. Company Market Share Analysis 2025
- 12.3.1 Top 5 Companies Market Share Analysis
- 12.3.2 Top 3 Companies Market Share Analysis
- 12.4. List of Potential Customers
- 13. Research Methodology
List of Figures
- Figure 1: Global VaaS Market Revenue Breakdown (Million, %) by Region 2025 & 2033
- Figure 2: North America VaaS Market Revenue (Million), by Platform 2025 & 2033
- Figure 3: North America VaaS Market Revenue Share (%), by Platform 2025 & 2033
- Figure 4: North America VaaS Market Revenue (Million), by Device 2025 & 2033
- Figure 5: North America VaaS Market Revenue Share (%), by Device 2025 & 2033
- Figure 6: North America VaaS Market Revenue (Million), by Service 2025 & 2033
- Figure 7: North America VaaS Market Revenue Share (%), by Service 2025 & 2033
- Figure 8: North America VaaS Market Revenue (Million), by Deployment Model 2025 & 2033
- Figure 9: North America VaaS Market Revenue Share (%), by Deployment Model 2025 & 2033
- Figure 10: North America VaaS Market Revenue (Million), by End-user Industry 2025 & 2033
- Figure 11: North America VaaS Market Revenue Share (%), by End-user Industry 2025 & 2033
- Figure 12: North America VaaS Market Revenue (Million), by Country 2025 & 2033
- Figure 13: North America VaaS Market Revenue Share (%), by Country 2025 & 2033
- Figure 14: Europe VaaS Market Revenue (Million), by Platform 2025 & 2033
- Figure 15: Europe VaaS Market Revenue Share (%), by Platform 2025 & 2033
- Figure 16: Europe VaaS Market Revenue (Million), by Device 2025 & 2033
- Figure 17: Europe VaaS Market Revenue Share (%), by Device 2025 & 2033
- Figure 18: Europe VaaS Market Revenue (Million), by Service 2025 & 2033
- Figure 19: Europe VaaS Market Revenue Share (%), by Service 2025 & 2033
- Figure 20: Europe VaaS Market Revenue (Million), by Deployment Model 2025 & 2033
- Figure 21: Europe VaaS Market Revenue Share (%), by Deployment Model 2025 & 2033
- Figure 22: Europe VaaS Market Revenue (Million), by End-user Industry 2025 & 2033
- Figure 23: Europe VaaS Market Revenue Share (%), by End-user Industry 2025 & 2033
- Figure 24: Europe VaaS Market Revenue (Million), by Country 2025 & 2033
- Figure 25: Europe VaaS Market Revenue Share (%), by Country 2025 & 2033
- Figure 26: Asia VaaS Market Revenue (Million), by Platform 2025 & 2033
- Figure 27: Asia VaaS Market Revenue Share (%), by Platform 2025 & 2033
- Figure 28: Asia VaaS Market Revenue (Million), by Device 2025 & 2033
- Figure 29: Asia VaaS Market Revenue Share (%), by Device 2025 & 2033
- Figure 30: Asia VaaS Market Revenue (Million), by Service 2025 & 2033
- Figure 31: Asia VaaS Market Revenue Share (%), by Service 2025 & 2033
- Figure 32: Asia VaaS Market Revenue (Million), by Deployment Model 2025 & 2033
- Figure 33: Asia VaaS Market Revenue Share (%), by Deployment Model 2025 & 2033
- Figure 34: Asia VaaS Market Revenue (Million), by End-user Industry 2025 & 2033
- Figure 35: Asia VaaS Market Revenue Share (%), by End-user Industry 2025 & 2033
- Figure 36: Asia VaaS Market Revenue (Million), by Country 2025 & 2033
- Figure 37: Asia VaaS Market Revenue Share (%), by Country 2025 & 2033
- Figure 38: Latin America VaaS Market Revenue (Million), by Platform 2025 & 2033
- Figure 39: Latin America VaaS Market Revenue Share (%), by Platform 2025 & 2033
- Figure 40: Latin America VaaS Market Revenue (Million), by Device 2025 & 2033
- Figure 41: Latin America VaaS Market Revenue Share (%), by Device 2025 & 2033
- Figure 42: Latin America VaaS Market Revenue (Million), by Service 2025 & 2033
- Figure 43: Latin America VaaS Market Revenue Share (%), by Service 2025 & 2033
- Figure 44: Latin America VaaS Market Revenue (Million), by Deployment Model 2025 & 2033
- Figure 45: Latin America VaaS Market Revenue Share (%), by Deployment Model 2025 & 2033
- Figure 46: Latin America VaaS Market Revenue (Million), by End-user Industry 2025 & 2033
- Figure 47: Latin America VaaS Market Revenue Share (%), by End-user Industry 2025 & 2033
- Figure 48: Latin America VaaS Market Revenue (Million), by Country 2025 & 2033
- Figure 49: Latin America VaaS Market Revenue Share (%), by Country 2025 & 2033
- Figure 50: Middle East and Africa VaaS Market Revenue (Million), by Platform 2025 & 2033
- Figure 51: Middle East and Africa VaaS Market Revenue Share (%), by Platform 2025 & 2033
- Figure 52: Middle East and Africa VaaS Market Revenue (Million), by Device 2025 & 2033
- Figure 53: Middle East and Africa VaaS Market Revenue Share (%), by Device 2025 & 2033
- Figure 54: Middle East and Africa VaaS Market Revenue (Million), by Service 2025 & 2033
- Figure 55: Middle East and Africa VaaS Market Revenue Share (%), by Service 2025 & 2033
- Figure 56: Middle East and Africa VaaS Market Revenue (Million), by Deployment Model 2025 & 2033
- Figure 57: Middle East and Africa VaaS Market Revenue Share (%), by Deployment Model 2025 & 2033
- Figure 58: Middle East and Africa VaaS Market Revenue (Million), by End-user Industry 2025 & 2033
- Figure 59: Middle East and Africa VaaS Market Revenue Share (%), by End-user Industry 2025 & 2033
- Figure 60: Middle East and Africa VaaS Market Revenue (Million), by Country 2025 & 2033
- Figure 61: Middle East and Africa VaaS Market Revenue Share (%), by Country 2025 & 2033
List of Tables
- Table 1: Global VaaS Market Revenue Million Forecast, by Platform 2020 & 2033
- Table 2: Global VaaS Market Revenue Million Forecast, by Device 2020 & 2033
- Table 3: Global VaaS Market Revenue Million Forecast, by Service 2020 & 2033
- Table 4: Global VaaS Market Revenue Million Forecast, by Deployment Model 2020 & 2033
- Table 5: Global VaaS Market Revenue Million Forecast, by End-user Industry 2020 & 2033
- Table 6: Global VaaS Market Revenue Million Forecast, by Region 2020 & 2033
- Table 7: Global VaaS Market Revenue Million Forecast, by Platform 2020 & 2033
- Table 8: Global VaaS Market Revenue Million Forecast, by Device 2020 & 2033
- Table 9: Global VaaS Market Revenue Million Forecast, by Service 2020 & 2033
- Table 10: Global VaaS Market Revenue Million Forecast, by Deployment Model 2020 & 2033
- Table 11: Global VaaS Market Revenue Million Forecast, by End-user Industry 2020 & 2033
- Table 12: Global VaaS Market Revenue Million Forecast, by Country 2020 & 2033
- Table 13: Global VaaS Market Revenue Million Forecast, by Platform 2020 & 2033
- Table 14: Global VaaS Market Revenue Million Forecast, by Device 2020 & 2033
- Table 15: Global VaaS Market Revenue Million Forecast, by Service 2020 & 2033
- Table 16: Global VaaS Market Revenue Million Forecast, by Deployment Model 2020 & 2033
- Table 17: Global VaaS Market Revenue Million Forecast, by End-user Industry 2020 & 2033
- Table 18: Global VaaS Market Revenue Million Forecast, by Country 2020 & 2033
- Table 19: Global VaaS Market Revenue Million Forecast, by Platform 2020 & 2033
- Table 20: Global VaaS Market Revenue Million Forecast, by Device 2020 & 2033
- Table 21: Global VaaS Market Revenue Million Forecast, by Service 2020 & 2033
- Table 22: Global VaaS Market Revenue Million Forecast, by Deployment Model 2020 & 2033
- Table 23: Global VaaS Market Revenue Million Forecast, by End-user Industry 2020 & 2033
- Table 24: Global VaaS Market Revenue Million Forecast, by Country 2020 & 2033
- Table 25: Global VaaS Market Revenue Million Forecast, by Platform 2020 & 2033
- Table 26: Global VaaS Market Revenue Million Forecast, by Device 2020 & 2033
- Table 27: Global VaaS Market Revenue Million Forecast, by Service 2020 & 2033
- Table 28: Global VaaS Market Revenue Million Forecast, by Deployment Model 2020 & 2033
- Table 29: Global VaaS Market Revenue Million Forecast, by End-user Industry 2020 & 2033
- Table 30: Global VaaS Market Revenue Million Forecast, by Country 2020 & 2033
- Table 31: Global VaaS Market Revenue Million Forecast, by Platform 2020 & 2033
- Table 32: Global VaaS Market Revenue Million Forecast, by Device 2020 & 2033
- Table 33: Global VaaS Market Revenue Million Forecast, by Service 2020 & 2033
- Table 34: Global VaaS Market Revenue Million Forecast, by Deployment Model 2020 & 2033
- Table 35: Global VaaS Market Revenue Million Forecast, by End-user Industry 2020 & 2033
- Table 36: Global VaaS Market Revenue Million Forecast, by Country 2020 & 2033
Frequently Asked Questions
1. What is the projected Compound Annual Growth Rate (CAGR) of the VaaS Market?
The projected CAGR is approximately 14.80%.
2. Which companies are prominent players in the VaaS Market?
Key companies in the market include Interoute Communications Limited, Applied Global Technologies LLC, AVI-SPL Inc , Polycom Inc, Adobe Systems, Cisco Systems Inc, Avaya Inc, BlueJeans Network, Huawei Technologies Co Limited, Vidyo Inc.
3. What are the main segments of the VaaS Market?
The market segments include Platform, Device, Service, Deployment Model, End-user Industry.
4. Can you provide details about the market size?
The market size is estimated to be USD 6.62 Million as of 2022.
5. What are some drivers contributing to market growth?
Increasing Investment on Cloud-Based Video Services; Enabling Digital Workforce.
6. What are the notable trends driving market growth?
The Hybrid Cloud Segment is Anticipated to Drive the Market Demand.
7. Are there any restraints impacting market growth?
High Cost of Video Content Creation and Validity.
8. Can you provide examples of recent developments in the market?
November 2022: Tesla announced that a Tesla driver could use the Zoom app to make or receive video conversations in the vehicle. The Zoom call app would be directly accessed on Tesla's central touchscreen infotainment system. The software utilizes the in-car camera mounted on the rearview mirror.
9. What pricing options are available for accessing the report?
Pricing options include single-user, multi-user, and enterprise licenses priced at USD 4750, USD 5250, and USD 8750 respectively.
10. Is the market size provided in terms of value or volume?
The market size is provided in terms of value, measured in Million.
11. Are there any specific market keywords associated with the report?
Yes, the market keyword associated with the report is "VaaS Market," which aids in identifying and referencing the specific market segment covered.
12. How do I determine which pricing option suits my needs best?
The pricing options vary based on user requirements and access needs. Individual users may opt for single-user licenses, while businesses requiring broader access may choose multi-user or enterprise licenses for cost-effective access to the report.
13. Are there any additional resources or data provided in the VaaS Market report?
While the report offers comprehensive insights, it's advisable to review the specific contents or supplementary materials provided to ascertain if additional resources or data are available.
14. How can I stay updated on further developments or reports in the VaaS Market?
To stay informed about further developments, trends, and reports in the VaaS Market, consider subscribing to industry newsletters, following relevant companies and organizations, or regularly checking reputable industry news sources and publications.
Methodology
Step 1 - Identification of Relevant Samples Size from Population Database


Step 2 - Approaches for Defining Global Market Size (Value, Volume* & Price*)

Note*: In applicable scenarios
Step 3 - Data Sources
Primary Research
- Web Analytics
- Survey Reports
- Research Institute
- Latest Research Reports
- Opinion Leaders
Secondary Research
- Annual Reports
- White Paper
- Latest Press Release
- Industry Association
- Paid Database
- Investor Presentations

Step 4 - Data Triangulation
Involves using different sources of information in order to increase the validity of a study
These sources are likely to be stakeholders in a program - participants, other researchers, program staff, other community members, and so on.
Then we put all data in single framework & apply various statistical tools to find out the dynamic on the market.
During the analysis stage, feedback from the stakeholder groups would be compared to determine areas of agreement as well as areas of divergence