Exploring Gaming Accessories Market Growth Trajectories: CAGR Insights 2025-2033

Gaming Accessories Market by Product Type (Gamepads/Joysticks, Gaming Keyboards, Gaming Mice, Gaming Headsets, Virtual Reality Devices), by Device Type (PC (Desktop and Laptop), Gaming Consoles, Smartphones), by North America, by Europe, by Asia Pacific, by Latin America, by Middle East and Africa Forecast 2025-2033

Aug 5 2025
Base Year: 2024

234 Pages
Main Logo

Exploring Gaming Accessories Market Growth Trajectories: CAGR Insights 2025-2033


Home
Industries
Technology, Media and Telecom
sponsor image
sponsor image
sponsor image
sponsor image
sponsor image
sponsor image
sponsor image
sponsor image
sponsor image
sponsor image
sponsor image
sponsor image
sponsor image
sponsor image
sponsor image
sponsor image
sponsor image
sponsor image
sponsor image
sponsor image

Tailored for you

  • In-depth Analysis Tailored to Specified Regions or Segments
  • Company Profiles Customized to User Preferences
  • Comprehensive Insights Focused on Specific Segments or Regions
  • Customized Evaluation of Competitive Landscape to Meet Your Needs
  • Tailored Customization to Address Other Specific Requirements
Ask for customization


Key Insights

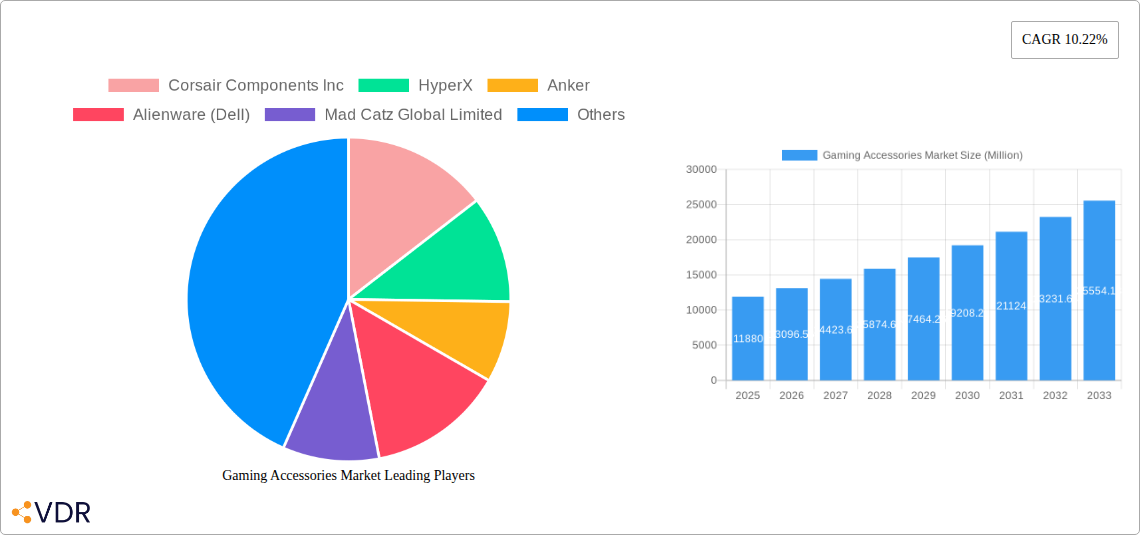
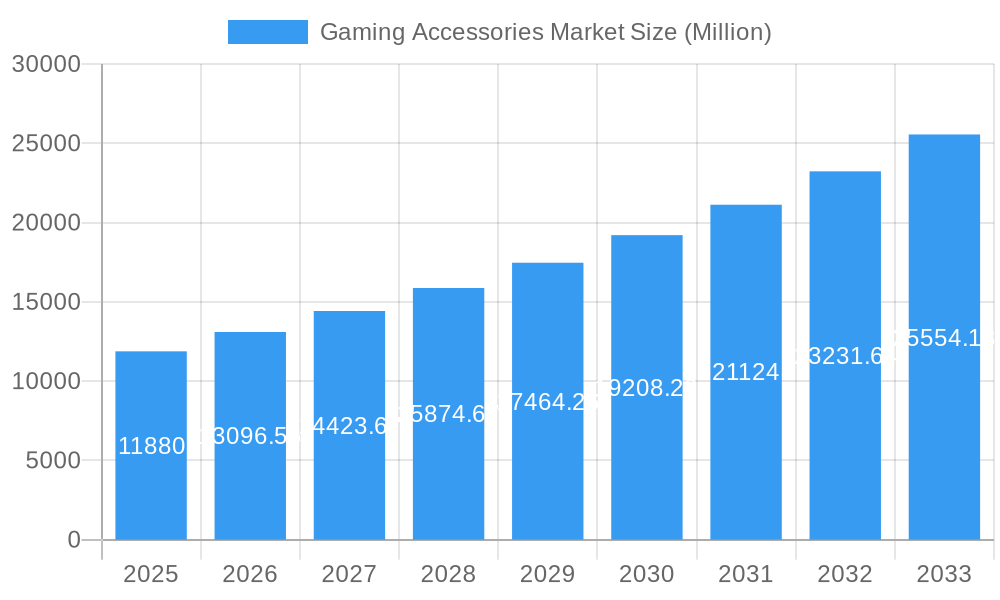
The global gaming accessories market, valued at $11.88 billion in 2025, is projected to experience robust growth, exhibiting a compound annual growth rate (CAGR) of 10.22% from 2025 to 2033. This expansion is fueled by several key drivers. The rising popularity of esports and competitive gaming is significantly boosting demand for high-performance accessories like gaming keyboards, mice, and headsets. Technological advancements, such as the introduction of improved sensor technologies in mice and enhanced ergonomic designs in controllers, are further enhancing the user experience and driving sales. The increasing penetration of high-speed internet and the growing accessibility of affordable gaming PCs and consoles are also contributing to market growth. Furthermore, the emergence of virtual reality (VR) and augmented reality (AR) gaming is creating new opportunities for innovative accessory development, expanding the market's potential. However, the market faces certain restraints including the relatively high price of premium gaming accessories, potentially limiting accessibility for budget-conscious consumers. The fluctuating prices of raw materials used in manufacturing these accessories could also impact profitability.

Segment-wise, the market is diverse, encompassing various product types like gamepads/joysticks, gaming keyboards, gaming mice, gaming headsets, and virtual reality devices, catering to different gaming platforms including PCs (desktops and laptops), gaming consoles, and smartphones. North America currently holds a significant market share due to high gaming console penetration and a strong esports culture. However, the Asia-Pacific region is expected to witness the fastest growth, driven by the burgeoning gaming community in countries like China and India. Key players like Corsair, HyperX, Razer, Logitech, and SteelSeries are competing fiercely through product innovation, strategic partnerships, and aggressive marketing campaigns, shaping the competitive landscape. The forecast period (2025-2033) promises substantial growth driven by technological advancements and a continuously expanding gaming community globally.

Gaming Accessories Market Research Report - Market Size, Growth & Forecast

Gaming Accessories Market: A Comprehensive Report (2019-2033)

This in-depth report provides a comprehensive analysis of the Gaming Accessories Market, encompassing market dynamics, growth trends, regional dominance, product landscape, key players, and future outlook. The study period spans from 2019 to 2033, with 2025 serving as the base and estimated year. The report segments the market by product type (Gamepads/Joysticks, Gaming Keyboards, Gaming Mice, Gaming Headsets, Virtual Reality Devices) and device type (PC, Gaming Consoles, Smartphones), offering granular insights into this dynamic sector. The market size is valued in million units.

Gaming Accessories Market Dynamics & Structure

The gaming accessories market is characterized by a moderately concentrated landscape, with key players like Corsair, Razer, and Logitech holding significant market share. Technological innovation, particularly in audio quality, ergonomics, and connectivity, is a primary growth driver. Stringent regulatory frameworks concerning product safety and electromagnetic interference (EMI) influence market operations. Competitive pressures arise from the availability of substitute products and the emergence of new entrants. End-user demographics, dominated by millennials and Gen Z gamers, significantly influence market demand. M&A activity has been moderate in recent years, with xx deals recorded between 2019 and 2024, representing an average of xx deals per year.

  • Market Concentration: Moderately concentrated, with top 5 players holding xx% market share in 2024.
  • Technological Innovation: Focus on enhanced audio, haptic feedback, and wireless connectivity.
  • Regulatory Frameworks: Compliance with safety and EMI standards impacting product development and costs.
  • Competitive Substitutes: Presence of cheaper alternatives from smaller manufacturers creates competitive pressure.
  • End-User Demographics: Millennials and Gen Z gamers represent the largest consumer segment, driving demand.
  • M&A Trends: Moderate activity with xx M&A deals recorded between 2019 and 2024.

Gaming Accessories Market Growth Trends & Insights

The global gaming accessories market experienced robust growth during the historical period (2019-2024), with a CAGR of xx%. This growth is attributed to the rising popularity of esports, increasing gaming console penetration, and the growing adoption of mobile gaming. The market is expected to maintain a healthy growth trajectory during the forecast period (2025-2033), driven by technological advancements, such as the integration of AI and improved haptic feedback in gaming peripherals. Market penetration is expected to reach xx% by 2033, particularly in developing economies with increasing internet access and smartphone penetration. Consumer behavior is shifting towards premium, feature-rich accessories, impacting product pricing and market segmentation. Technological disruptions like the metaverse and virtual reality (VR) gaming are expected to create new market segments and opportunities.

Gaming Accessories Market Growth

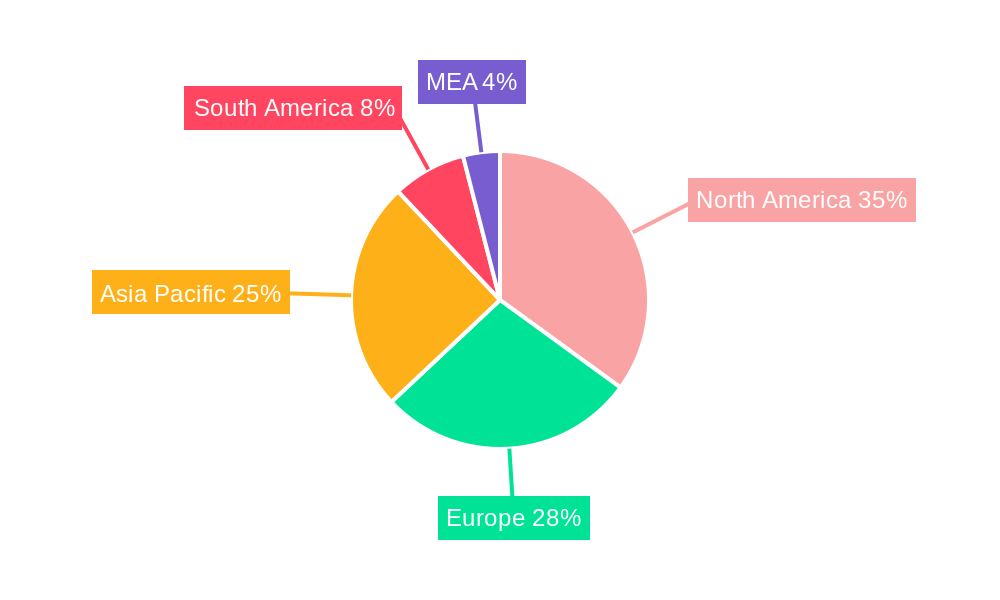
Dominant Regions, Countries, or Segments in Gaming Accessories Market

North America and Asia-Pacific are currently the dominant regions in the gaming accessories market, driven by high gaming console and PC penetration rates, strong esports cultures, and significant disposable income. Within product types, gaming headsets and gaming keyboards demonstrate the highest growth, driven by enhanced audio and ergonomic design. Gaming consoles remain a key device type, while PC gaming continues to maintain a significant market share.

  • North America: High market penetration, strong consumer demand, and established esports scene.
  • Asia-Pacific: Rapid growth fueled by rising smartphone penetration and a large gaming population.
  • Europe: Steady growth driven by established gaming communities and high disposable income in certain countries.
  • Product Type: Gaming Headsets and Gaming Keyboards show highest growth rates.
  • Device Type: Gaming Consoles and PCs maintain dominant market share.

Gaming Accessories Market Product Landscape

The gaming accessories market is marked by continuous product innovation, focusing on enhanced ergonomics, improved audio fidelity, customizable features, and seamless connectivity. Manufacturers are introducing products with advanced features like haptic feedback, programmable macros, and AI-powered personalization. The unique selling propositions often revolve around superior comfort, performance, and design aesthetics, catering to the demands of both casual and professional gamers. Technological advancements include the incorporation of wireless technologies like Bluetooth and 2.4 GHz for lag-free gameplay, and the integration of RGB lighting for enhanced aesthetics.

Key Drivers, Barriers & Challenges in Gaming Accessories Market

Key Drivers:

  • Rising popularity of esports: Increased viewership and participation driving demand for high-performance accessories.
  • Advancements in gaming technology: Improved graphics and gameplay features demand better peripherals.
  • Growing mobile gaming market: Increased adoption of mobile gaming creates demand for mobile gaming accessories.

Challenges:

  • Intense competition: Numerous established and emerging players create a highly competitive market.
  • Supply chain disruptions: Global supply chain vulnerabilities impacting production and distribution.
  • Economic fluctuations: Economic downturns can affect consumer spending on non-essential items like gaming accessories.

Emerging Opportunities in Gaming Accessories Market

  • Growth in cloud gaming: Cloud gaming platforms drive demand for peripherals compatible with various devices.
  • Expansion into VR/AR gaming: Emergence of VR/AR creates opportunities for specialized gaming accessories.
  • Integration of AI and machine learning: AI-powered personalization and adaptive features creating new market segments.

Growth Accelerators in the Gaming Accessories Market Industry

Technological advancements, strategic partnerships between hardware and software companies, and expansion into emerging markets are key accelerators driving long-term growth. The growing popularity of esports and the increasing sophistication of gaming experiences create an environment ripe for innovation and market expansion. Strategic mergers and acquisitions further consolidate the market and drive economies of scale.

Key Players Shaping the Gaming Accessories Market Market

  • Corsair Components Inc
  • HyperX
  • Anker
  • Alienware (Dell)
  • Mad Catz Global Limited
  • SteelSeries
  • Turtle Beach Corporation
  • Nintendo Co Ltd
  • Nvidia Corporation
  • Sennheiser Electronic GmbH & Co KG
  • Razer Inc
  • Reddragon (Eastern Times Technology Co Ltd)
  • Cooler Master Co Ltd
  • Logitech International SA
  • Sony Corporation

Notable Milestones in Gaming Accessories Market Sector

  • February 2023: Corsair Gaming Inc. launched the HS65 WIRELESS gaming headset, featuring dual connectivity and Sonarworks SoundID.
  • April 2023: Razer Inc. announced the Razer BlackShark V2 Pro esports headset, boasting improved audio, comfort, and battery life.

In-Depth Gaming Accessories Market Market Outlook

The gaming accessories market is poised for significant growth in the coming years. Continued technological advancements, coupled with the rising popularity of esports and the expansion of gaming into new platforms (VR/AR, cloud gaming), will drive demand for innovative and high-performance accessories. Strategic partnerships and market consolidation will further shape the industry landscape, creating opportunities for both established players and new entrants. The market's future success will hinge on the ability of companies to innovate, adapt to evolving consumer preferences, and navigate the complexities of a competitive global marketplace.

Gaming Accessories Market Segmentation

  • 1. Product Type
    • 1.1. Gamepads/Joysticks
    • 1.2. Gaming Keyboards
    • 1.3. Gaming Mice
    • 1.4. Gaming Headsets
    • 1.5. Virtual Reality Devices
  • 2. Device Type
    • 2.1. PC (Desktop and Laptop)
    • 2.2. Gaming Consoles
    • 2.3. Smartphones

Gaming Accessories Market Segmentation By Geography

  • 1. North America
  • 2. Europe
  • 3. Asia Pacific
  • 4. Latin America
  • 5. Middle East and Africa
Gaming Accessories Market Regional Share


Gaming Accessories Market REPORT HIGHLIGHTS

AspectsDetails
Study Period 2019-2033
Base Year 2024
Estimated Year 2025
Forecast Period2025-2033
Historical Period2019-2024
Growth RateCAGR of 10.22% from 2019-2033
Segmentation
    • By Product Type
      • Gamepads/Joysticks
      • Gaming Keyboards
      • Gaming Mice
      • Gaming Headsets
      • Virtual Reality Devices
    • By Device Type
      • PC (Desktop and Laptop)
      • Gaming Consoles
      • Smartphones
  • By Geography
    • North America
    • Europe
    • Asia Pacific
    • Latin America
    • Middle East and Africa


Table of Contents

  1. 1. Introduction
    • 1.1. Research Scope
    • 1.2. Market Segmentation
    • 1.3. Research Methodology
    • 1.4. Definitions and Assumptions
  2. 2. Executive Summary
    • 2.1. Introduction
  3. 3. Market Dynamics
    • 3.1. Introduction
      • 3.2. Market Drivers
        • 3.2.1. Rise in e-sports gaming to fuel the demand for gaming accessory equipment; New console and computer GPU unit launch to present an increase of demands for accessories
      • 3.3. Market Restrains
        • 3.3.1. Fluctuation in the production of silicon chips leading to shortage in demand of gaming accessories
      • 3.4. Market Trends
        • 3.4.1. Rise in E-Sports Gaming to Fuel the Demand for Gaming Accessory Equipment to Drive the Market Growth
  4. 4. Market Factor Analysis
    • 4.1. Porters Five Forces
    • 4.2. Supply/Value Chain
    • 4.3. PESTEL analysis
    • 4.4. Market Entropy
    • 4.5. Patent/Trademark Analysis
  5. 5. Global Gaming Accessories Market Analysis, Insights and Forecast, 2019-2031
    • 5.1. Market Analysis, Insights and Forecast - by Product Type
      • 5.1.1. Gamepads/Joysticks
      • 5.1.2. Gaming Keyboards
      • 5.1.3. Gaming Mice
      • 5.1.4. Gaming Headsets
      • 5.1.5. Virtual Reality Devices
    • 5.2. Market Analysis, Insights and Forecast - by Device Type
      • 5.2.1. PC (Desktop and Laptop)
      • 5.2.2. Gaming Consoles
      • 5.2.3. Smartphones
    • 5.3. Market Analysis, Insights and Forecast - by Region
      • 5.3.1. North America
      • 5.3.2. Europe
      • 5.3.3. Asia Pacific
      • 5.3.4. Latin America
      • 5.3.5. Middle East and Africa
  6. 6. North America Gaming Accessories Market Analysis, Insights and Forecast, 2019-2031
    • 6.1. Market Analysis, Insights and Forecast - by Product Type
      • 6.1.1. Gamepads/Joysticks
      • 6.1.2. Gaming Keyboards
      • 6.1.3. Gaming Mice
      • 6.1.4. Gaming Headsets
      • 6.1.5. Virtual Reality Devices
    • 6.2. Market Analysis, Insights and Forecast - by Device Type
      • 6.2.1. PC (Desktop and Laptop)
      • 6.2.2. Gaming Consoles
      • 6.2.3. Smartphones
  7. 7. Europe Gaming Accessories Market Analysis, Insights and Forecast, 2019-2031
    • 7.1. Market Analysis, Insights and Forecast - by Product Type
      • 7.1.1. Gamepads/Joysticks
      • 7.1.2. Gaming Keyboards
      • 7.1.3. Gaming Mice
      • 7.1.4. Gaming Headsets
      • 7.1.5. Virtual Reality Devices
    • 7.2. Market Analysis, Insights and Forecast - by Device Type
      • 7.2.1. PC (Desktop and Laptop)
      • 7.2.2. Gaming Consoles
      • 7.2.3. Smartphones
  8. 8. Asia Pacific Gaming Accessories Market Analysis, Insights and Forecast, 2019-2031
    • 8.1. Market Analysis, Insights and Forecast - by Product Type
      • 8.1.1. Gamepads/Joysticks
      • 8.1.2. Gaming Keyboards
      • 8.1.3. Gaming Mice
      • 8.1.4. Gaming Headsets
      • 8.1.5. Virtual Reality Devices
    • 8.2. Market Analysis, Insights and Forecast - by Device Type
      • 8.2.1. PC (Desktop and Laptop)
      • 8.2.2. Gaming Consoles
      • 8.2.3. Smartphones
  9. 9. Latin America Gaming Accessories Market Analysis, Insights and Forecast, 2019-2031
    • 9.1. Market Analysis, Insights and Forecast - by Product Type
      • 9.1.1. Gamepads/Joysticks
      • 9.1.2. Gaming Keyboards
      • 9.1.3. Gaming Mice
      • 9.1.4. Gaming Headsets
      • 9.1.5. Virtual Reality Devices
    • 9.2. Market Analysis, Insights and Forecast - by Device Type
      • 9.2.1. PC (Desktop and Laptop)
      • 9.2.2. Gaming Consoles
      • 9.2.3. Smartphones
  10. 10. Middle East and Africa Gaming Accessories Market Analysis, Insights and Forecast, 2019-2031
    • 10.1. Market Analysis, Insights and Forecast - by Product Type
      • 10.1.1. Gamepads/Joysticks
      • 10.1.2. Gaming Keyboards
      • 10.1.3. Gaming Mice
      • 10.1.4. Gaming Headsets
      • 10.1.5. Virtual Reality Devices
    • 10.2. Market Analysis, Insights and Forecast - by Device Type
      • 10.2.1. PC (Desktop and Laptop)
      • 10.2.2. Gaming Consoles
      • 10.2.3. Smartphones
  11. 11. North America Gaming Accessories Market Analysis, Insights and Forecast, 2019-2031
      • 11.1. Market Analysis, Insights and Forecast - By Country/Sub-region
        • 11.1.1 United States
        • 11.1.2 Canada
        • 11.1.3 Mexico
  12. 12. Europe Gaming Accessories Market Analysis, Insights and Forecast, 2019-2031
      • 12.1. Market Analysis, Insights and Forecast - By Country/Sub-region
        • 12.1.1 Germany
        • 12.1.2 United Kingdom
        • 12.1.3 France
        • 12.1.4 Spain
        • 12.1.5 Italy
        • 12.1.6 Spain
        • 12.1.7 Belgium
        • 12.1.8 Netherland
        • 12.1.9 Nordics
        • 12.1.10 Rest of Europe
  13. 13. Asia Pacific Gaming Accessories Market Analysis, Insights and Forecast, 2019-2031
      • 13.1. Market Analysis, Insights and Forecast - By Country/Sub-region
        • 13.1.1 China
        • 13.1.2 Japan
        • 13.1.3 India
        • 13.1.4 South Korea
        • 13.1.5 Southeast Asia
        • 13.1.6 Australia
        • 13.1.7 Indonesia
        • 13.1.8 Phillipes
        • 13.1.9 Singapore
        • 13.1.10 Thailandc
        • 13.1.11 Rest of Asia Pacific
  14. 14. South America Gaming Accessories Market Analysis, Insights and Forecast, 2019-2031
      • 14.1. Market Analysis, Insights and Forecast - By Country/Sub-region
        • 14.1.1 Brazil
        • 14.1.2 Argentina
        • 14.1.3 Peru
        • 14.1.4 Chile
        • 14.1.5 Colombia
        • 14.1.6 Ecuador
        • 14.1.7 Venezuela
        • 14.1.8 Rest of South America
  15. 15. North America Gaming Accessories Market Analysis, Insights and Forecast, 2019-2031
      • 15.1. Market Analysis, Insights and Forecast - By Country/Sub-region
        • 15.1.1 United States
        • 15.1.2 Canada
        • 15.1.3 Mexico
  16. 16. MEA Gaming Accessories Market Analysis, Insights and Forecast, 2019-2031
      • 16.1. Market Analysis, Insights and Forecast - By Country/Sub-region
        • 16.1.1 United Arab Emirates
        • 16.1.2 Saudi Arabia
        • 16.1.3 South Africa
        • 16.1.4 Rest of Middle East and Africa
  17. 17. Competitive Analysis
    • 17.1. Global Market Share Analysis 2024
      • 17.2. Company Profiles
        • 17.2.1 Corsair Components Inc
          • 17.2.1.1. Overview
          • 17.2.1.2. Products
          • 17.2.1.3. SWOT Analysis
          • 17.2.1.4. Recent Developments
          • 17.2.1.5. Financials (Based on Availability)
        • 17.2.2 HyperX
          • 17.2.2.1. Overview
          • 17.2.2.2. Products
          • 17.2.2.3. SWOT Analysis
          • 17.2.2.4. Recent Developments
          • 17.2.2.5. Financials (Based on Availability)
        • 17.2.3 Anker
          • 17.2.3.1. Overview
          • 17.2.3.2. Products
          • 17.2.3.3. SWOT Analysis
          • 17.2.3.4. Recent Developments
          • 17.2.3.5. Financials (Based on Availability)
        • 17.2.4 Alienware (Dell)
          • 17.2.4.1. Overview
          • 17.2.4.2. Products
          • 17.2.4.3. SWOT Analysis
          • 17.2.4.4. Recent Developments
          • 17.2.4.5. Financials (Based on Availability)
        • 17.2.5 Mad Catz Global Limited
          • 17.2.5.1. Overview
          • 17.2.5.2. Products
          • 17.2.5.3. SWOT Analysis
          • 17.2.5.4. Recent Developments
          • 17.2.5.5. Financials (Based on Availability)
        • 17.2.6 SteelSeries
          • 17.2.6.1. Overview
          • 17.2.6.2. Products
          • 17.2.6.3. SWOT Analysis
          • 17.2.6.4. Recent Developments
          • 17.2.6.5. Financials (Based on Availability)
        • 17.2.7 Turtle Beach Corporation
          • 17.2.7.1. Overview
          • 17.2.7.2. Products
          • 17.2.7.3. SWOT Analysis
          • 17.2.7.4. Recent Developments
          • 17.2.7.5. Financials (Based on Availability)
        • 17.2.8 Nintendo Co Ltd
          • 17.2.8.1. Overview
          • 17.2.8.2. Products
          • 17.2.8.3. SWOT Analysis
          • 17.2.8.4. Recent Developments
          • 17.2.8.5. Financials (Based on Availability)
        • 17.2.9 Nvidia Corporation
          • 17.2.9.1. Overview
          • 17.2.9.2. Products
          • 17.2.9.3. SWOT Analysis
          • 17.2.9.4. Recent Developments
          • 17.2.9.5. Financials (Based on Availability)
        • 17.2.10 Sennheiser Electronic GmbH & Co KG
          • 17.2.10.1. Overview
          • 17.2.10.2. Products
          • 17.2.10.3. SWOT Analysis
          • 17.2.10.4. Recent Developments
          • 17.2.10.5. Financials (Based on Availability)
        • 17.2.11 Razer Inc
          • 17.2.11.1. Overview
          • 17.2.11.2. Products
          • 17.2.11.3. SWOT Analysis
          • 17.2.11.4. Recent Developments
          • 17.2.11.5. Financials (Based on Availability)
        • 17.2.12 Reddragon (Eastern Times Technology Co Ltd)
          • 17.2.12.1. Overview
          • 17.2.12.2. Products
          • 17.2.12.3. SWOT Analysis
          • 17.2.12.4. Recent Developments
          • 17.2.12.5. Financials (Based on Availability)
        • 17.2.13 Cooler Master Co Ltd
          • 17.2.13.1. Overview
          • 17.2.13.2. Products
          • 17.2.13.3. SWOT Analysis
          • 17.2.13.4. Recent Developments
          • 17.2.13.5. Financials (Based on Availability)
        • 17.2.14 Logitech International SA
          • 17.2.14.1. Overview
          • 17.2.14.2. Products
          • 17.2.14.3. SWOT Analysis
          • 17.2.14.4. Recent Developments
          • 17.2.14.5. Financials (Based on Availability)
        • 17.2.15 Sony Corporation
          • 17.2.15.1. Overview
          • 17.2.15.2. Products
          • 17.2.15.3. SWOT Analysis
          • 17.2.15.4. Recent Developments
          • 17.2.15.5. Financials (Based on Availability)

List of Figures

  1. Figure 1: Global Gaming Accessories Market Revenue Breakdown (Million, %) by Region 2024 & 2032
  2. Figure 2: Global Gaming Accessories Market Volume Breakdown (K Unit, %) by Region 2024 & 2032
  3. Figure 3: North America Gaming Accessories Market Revenue (Million), by Country 2024 & 2032
  4. Figure 4: North America Gaming Accessories Market Volume (K Unit), by Country 2024 & 2032
  5. Figure 5: North America Gaming Accessories Market Revenue Share (%), by Country 2024 & 2032
  6. Figure 6: North America Gaming Accessories Market Volume Share (%), by Country 2024 & 2032
  7. Figure 7: Europe Gaming Accessories Market Revenue (Million), by Country 2024 & 2032
  8. Figure 8: Europe Gaming Accessories Market Volume (K Unit), by Country 2024 & 2032
  9. Figure 9: Europe Gaming Accessories Market Revenue Share (%), by Country 2024 & 2032
  10. Figure 10: Europe Gaming Accessories Market Volume Share (%), by Country 2024 & 2032
  11. Figure 11: Asia Pacific Gaming Accessories Market Revenue (Million), by Country 2024 & 2032
  12. Figure 12: Asia Pacific Gaming Accessories Market Volume (K Unit), by Country 2024 & 2032
  13. Figure 13: Asia Pacific Gaming Accessories Market Revenue Share (%), by Country 2024 & 2032
  14. Figure 14: Asia Pacific Gaming Accessories Market Volume Share (%), by Country 2024 & 2032
  15. Figure 15: South America Gaming Accessories Market Revenue (Million), by Country 2024 & 2032
  16. Figure 16: South America Gaming Accessories Market Volume (K Unit), by Country 2024 & 2032
  17. Figure 17: South America Gaming Accessories Market Revenue Share (%), by Country 2024 & 2032
  18. Figure 18: South America Gaming Accessories Market Volume Share (%), by Country 2024 & 2032
  19. Figure 19: North America Gaming Accessories Market Revenue (Million), by Country 2024 & 2032
  20. Figure 20: North America Gaming Accessories Market Volume (K Unit), by Country 2024 & 2032
  21. Figure 21: North America Gaming Accessories Market Revenue Share (%), by Country 2024 & 2032
  22. Figure 22: North America Gaming Accessories Market Volume Share (%), by Country 2024 & 2032
  23. Figure 23: MEA Gaming Accessories Market Revenue (Million), by Country 2024 & 2032
  24. Figure 24: MEA Gaming Accessories Market Volume (K Unit), by Country 2024 & 2032
  25. Figure 25: MEA Gaming Accessories Market Revenue Share (%), by Country 2024 & 2032
  26. Figure 26: MEA Gaming Accessories Market Volume Share (%), by Country 2024 & 2032
  27. Figure 27: North America Gaming Accessories Market Revenue (Million), by Product Type 2024 & 2032
  28. Figure 28: North America Gaming Accessories Market Volume (K Unit), by Product Type 2024 & 2032
  29. Figure 29: North America Gaming Accessories Market Revenue Share (%), by Product Type 2024 & 2032
  30. Figure 30: North America Gaming Accessories Market Volume Share (%), by Product Type 2024 & 2032
  31. Figure 31: North America Gaming Accessories Market Revenue (Million), by Device Type 2024 & 2032
  32. Figure 32: North America Gaming Accessories Market Volume (K Unit), by Device Type 2024 & 2032
  33. Figure 33: North America Gaming Accessories Market Revenue Share (%), by Device Type 2024 & 2032
  34. Figure 34: North America Gaming Accessories Market Volume Share (%), by Device Type 2024 & 2032
  35. Figure 35: North America Gaming Accessories Market Revenue (Million), by Country 2024 & 2032
  36. Figure 36: North America Gaming Accessories Market Volume (K Unit), by Country 2024 & 2032
  37. Figure 37: North America Gaming Accessories Market Revenue Share (%), by Country 2024 & 2032
  38. Figure 38: North America Gaming Accessories Market Volume Share (%), by Country 2024 & 2032
  39. Figure 39: Europe Gaming Accessories Market Revenue (Million), by Product Type 2024 & 2032
  40. Figure 40: Europe Gaming Accessories Market Volume (K Unit), by Product Type 2024 & 2032
  41. Figure 41: Europe Gaming Accessories Market Revenue Share (%), by Product Type 2024 & 2032
  42. Figure 42: Europe Gaming Accessories Market Volume Share (%), by Product Type 2024 & 2032
  43. Figure 43: Europe Gaming Accessories Market Revenue (Million), by Device Type 2024 & 2032
  44. Figure 44: Europe Gaming Accessories Market Volume (K Unit), by Device Type 2024 & 2032
  45. Figure 45: Europe Gaming Accessories Market Revenue Share (%), by Device Type 2024 & 2032
  46. Figure 46: Europe Gaming Accessories Market Volume Share (%), by Device Type 2024 & 2032
  47. Figure 47: Europe Gaming Accessories Market Revenue (Million), by Country 2024 & 2032
  48. Figure 48: Europe Gaming Accessories Market Volume (K Unit), by Country 2024 & 2032
  49. Figure 49: Europe Gaming Accessories Market Revenue Share (%), by Country 2024 & 2032
  50. Figure 50: Europe Gaming Accessories Market Volume Share (%), by Country 2024 & 2032
  51. Figure 51: Asia Pacific Gaming Accessories Market Revenue (Million), by Product Type 2024 & 2032
  52. Figure 52: Asia Pacific Gaming Accessories Market Volume (K Unit), by Product Type 2024 & 2032
  53. Figure 53: Asia Pacific Gaming Accessories Market Revenue Share (%), by Product Type 2024 & 2032
  54. Figure 54: Asia Pacific Gaming Accessories Market Volume Share (%), by Product Type 2024 & 2032
  55. Figure 55: Asia Pacific Gaming Accessories Market Revenue (Million), by Device Type 2024 & 2032
  56. Figure 56: Asia Pacific Gaming Accessories Market Volume (K Unit), by Device Type 2024 & 2032
  57. Figure 57: Asia Pacific Gaming Accessories Market Revenue Share (%), by Device Type 2024 & 2032
  58. Figure 58: Asia Pacific Gaming Accessories Market Volume Share (%), by Device Type 2024 & 2032
  59. Figure 59: Asia Pacific Gaming Accessories Market Revenue (Million), by Country 2024 & 2032
  60. Figure 60: Asia Pacific Gaming Accessories Market Volume (K Unit), by Country 2024 & 2032
  61. Figure 61: Asia Pacific Gaming Accessories Market Revenue Share (%), by Country 2024 & 2032
  62. Figure 62: Asia Pacific Gaming Accessories Market Volume Share (%), by Country 2024 & 2032
  63. Figure 63: Latin America Gaming Accessories Market Revenue (Million), by Product Type 2024 & 2032
  64. Figure 64: Latin America Gaming Accessories Market Volume (K Unit), by Product Type 2024 & 2032
  65. Figure 65: Latin America Gaming Accessories Market Revenue Share (%), by Product Type 2024 & 2032
  66. Figure 66: Latin America Gaming Accessories Market Volume Share (%), by Product Type 2024 & 2032
  67. Figure 67: Latin America Gaming Accessories Market Revenue (Million), by Device Type 2024 & 2032
  68. Figure 68: Latin America Gaming Accessories Market Volume (K Unit), by Device Type 2024 & 2032
  69. Figure 69: Latin America Gaming Accessories Market Revenue Share (%), by Device Type 2024 & 2032
  70. Figure 70: Latin America Gaming Accessories Market Volume Share (%), by Device Type 2024 & 2032
  71. Figure 71: Latin America Gaming Accessories Market Revenue (Million), by Country 2024 & 2032
  72. Figure 72: Latin America Gaming Accessories Market Volume (K Unit), by Country 2024 & 2032
  73. Figure 73: Latin America Gaming Accessories Market Revenue Share (%), by Country 2024 & 2032
  74. Figure 74: Latin America Gaming Accessories Market Volume Share (%), by Country 2024 & 2032
  75. Figure 75: Middle East and Africa Gaming Accessories Market Revenue (Million), by Product Type 2024 & 2032
  76. Figure 76: Middle East and Africa Gaming Accessories Market Volume (K Unit), by Product Type 2024 & 2032
  77. Figure 77: Middle East and Africa Gaming Accessories Market Revenue Share (%), by Product Type 2024 & 2032
  78. Figure 78: Middle East and Africa Gaming Accessories Market Volume Share (%), by Product Type 2024 & 2032
  79. Figure 79: Middle East and Africa Gaming Accessories Market Revenue (Million), by Device Type 2024 & 2032
  80. Figure 80: Middle East and Africa Gaming Accessories Market Volume (K Unit), by Device Type 2024 & 2032
  81. Figure 81: Middle East and Africa Gaming Accessories Market Revenue Share (%), by Device Type 2024 & 2032
  82. Figure 82: Middle East and Africa Gaming Accessories Market Volume Share (%), by Device Type 2024 & 2032
  83. Figure 83: Middle East and Africa Gaming Accessories Market Revenue (Million), by Country 2024 & 2032
  84. Figure 84: Middle East and Africa Gaming Accessories Market Volume (K Unit), by Country 2024 & 2032
  85. Figure 85: Middle East and Africa Gaming Accessories Market Revenue Share (%), by Country 2024 & 2032
  86. Figure 86: Middle East and Africa Gaming Accessories Market Volume Share (%), by Country 2024 & 2032

List of Tables

  1. Table 1: Global Gaming Accessories Market Revenue Million Forecast, by Region 2019 & 2032
  2. Table 2: Global Gaming Accessories Market Volume K Unit Forecast, by Region 2019 & 2032
  3. Table 3: Global Gaming Accessories Market Revenue Million Forecast, by Product Type 2019 & 2032
  4. Table 4: Global Gaming Accessories Market Volume K Unit Forecast, by Product Type 2019 & 2032
  5. Table 5: Global Gaming Accessories Market Revenue Million Forecast, by Device Type 2019 & 2032
  6. Table 6: Global Gaming Accessories Market Volume K Unit Forecast, by Device Type 2019 & 2032
  7. Table 7: Global Gaming Accessories Market Revenue Million Forecast, by Region 2019 & 2032
  8. Table 8: Global Gaming Accessories Market Volume K Unit Forecast, by Region 2019 & 2032
  9. Table 9: Global Gaming Accessories Market Revenue Million Forecast, by Country 2019 & 2032
  10. Table 10: Global Gaming Accessories Market Volume K Unit Forecast, by Country 2019 & 2032
  11. Table 11: United States Gaming Accessories Market Revenue (Million) Forecast, by Application 2019 & 2032
  12. Table 12: United States Gaming Accessories Market Volume (K Unit) Forecast, by Application 2019 & 2032
  13. Table 13: Canada Gaming Accessories Market Revenue (Million) Forecast, by Application 2019 & 2032
  14. Table 14: Canada Gaming Accessories Market Volume (K Unit) Forecast, by Application 2019 & 2032
  15. Table 15: Mexico Gaming Accessories Market Revenue (Million) Forecast, by Application 2019 & 2032
  16. Table 16: Mexico Gaming Accessories Market Volume (K Unit) Forecast, by Application 2019 & 2032
  17. Table 17: Global Gaming Accessories Market Revenue Million Forecast, by Country 2019 & 2032
  18. Table 18: Global Gaming Accessories Market Volume K Unit Forecast, by Country 2019 & 2032
  19. Table 19: Germany Gaming Accessories Market Revenue (Million) Forecast, by Application 2019 & 2032
  20. Table 20: Germany Gaming Accessories Market Volume (K Unit) Forecast, by Application 2019 & 2032
  21. Table 21: United Kingdom Gaming Accessories Market Revenue (Million) Forecast, by Application 2019 & 2032
  22. Table 22: United Kingdom Gaming Accessories Market Volume (K Unit) Forecast, by Application 2019 & 2032
  23. Table 23: France Gaming Accessories Market Revenue (Million) Forecast, by Application 2019 & 2032
  24. Table 24: France Gaming Accessories Market Volume (K Unit) Forecast, by Application 2019 & 2032
  25. Table 25: Spain Gaming Accessories Market Revenue (Million) Forecast, by Application 2019 & 2032
  26. Table 26: Spain Gaming Accessories Market Volume (K Unit) Forecast, by Application 2019 & 2032
  27. Table 27: Italy Gaming Accessories Market Revenue (Million) Forecast, by Application 2019 & 2032
  28. Table 28: Italy Gaming Accessories Market Volume (K Unit) Forecast, by Application 2019 & 2032
  29. Table 29: Spain Gaming Accessories Market Revenue (Million) Forecast, by Application 2019 & 2032
  30. Table 30: Spain Gaming Accessories Market Volume (K Unit) Forecast, by Application 2019 & 2032
  31. Table 31: Belgium Gaming Accessories Market Revenue (Million) Forecast, by Application 2019 & 2032
  32. Table 32: Belgium Gaming Accessories Market Volume (K Unit) Forecast, by Application 2019 & 2032
  33. Table 33: Netherland Gaming Accessories Market Revenue (Million) Forecast, by Application 2019 & 2032
  34. Table 34: Netherland Gaming Accessories Market Volume (K Unit) Forecast, by Application 2019 & 2032
  35. Table 35: Nordics Gaming Accessories Market Revenue (Million) Forecast, by Application 2019 & 2032
  36. Table 36: Nordics Gaming Accessories Market Volume (K Unit) Forecast, by Application 2019 & 2032
  37. Table 37: Rest of Europe Gaming Accessories Market Revenue (Million) Forecast, by Application 2019 & 2032
  38. Table 38: Rest of Europe Gaming Accessories Market Volume (K Unit) Forecast, by Application 2019 & 2032
  39. Table 39: Global Gaming Accessories Market Revenue Million Forecast, by Country 2019 & 2032
  40. Table 40: Global Gaming Accessories Market Volume K Unit Forecast, by Country 2019 & 2032
  41. Table 41: China Gaming Accessories Market Revenue (Million) Forecast, by Application 2019 & 2032
  42. Table 42: China Gaming Accessories Market Volume (K Unit) Forecast, by Application 2019 & 2032
  43. Table 43: Japan Gaming Accessories Market Revenue (Million) Forecast, by Application 2019 & 2032
  44. Table 44: Japan Gaming Accessories Market Volume (K Unit) Forecast, by Application 2019 & 2032
  45. Table 45: India Gaming Accessories Market Revenue (Million) Forecast, by Application 2019 & 2032
  46. Table 46: India Gaming Accessories Market Volume (K Unit) Forecast, by Application 2019 & 2032
  47. Table 47: South Korea Gaming Accessories Market Revenue (Million) Forecast, by Application 2019 & 2032
  48. Table 48: South Korea Gaming Accessories Market Volume (K Unit) Forecast, by Application 2019 & 2032
  49. Table 49: Southeast Asia Gaming Accessories Market Revenue (Million) Forecast, by Application 2019 & 2032
  50. Table 50: Southeast Asia Gaming Accessories Market Volume (K Unit) Forecast, by Application 2019 & 2032
  51. Table 51: Australia Gaming Accessories Market Revenue (Million) Forecast, by Application 2019 & 2032
  52. Table 52: Australia Gaming Accessories Market Volume (K Unit) Forecast, by Application 2019 & 2032
  53. Table 53: Indonesia Gaming Accessories Market Revenue (Million) Forecast, by Application 2019 & 2032
  54. Table 54: Indonesia Gaming Accessories Market Volume (K Unit) Forecast, by Application 2019 & 2032
  55. Table 55: Phillipes Gaming Accessories Market Revenue (Million) Forecast, by Application 2019 & 2032
  56. Table 56: Phillipes Gaming Accessories Market Volume (K Unit) Forecast, by Application 2019 & 2032
  57. Table 57: Singapore Gaming Accessories Market Revenue (Million) Forecast, by Application 2019 & 2032
  58. Table 58: Singapore Gaming Accessories Market Volume (K Unit) Forecast, by Application 2019 & 2032
  59. Table 59: Thailandc Gaming Accessories Market Revenue (Million) Forecast, by Application 2019 & 2032
  60. Table 60: Thailandc Gaming Accessories Market Volume (K Unit) Forecast, by Application 2019 & 2032
  61. Table 61: Rest of Asia Pacific Gaming Accessories Market Revenue (Million) Forecast, by Application 2019 & 2032
  62. Table 62: Rest of Asia Pacific Gaming Accessories Market Volume (K Unit) Forecast, by Application 2019 & 2032
  63. Table 63: Global Gaming Accessories Market Revenue Million Forecast, by Country 2019 & 2032
  64. Table 64: Global Gaming Accessories Market Volume K Unit Forecast, by Country 2019 & 2032
  65. Table 65: Brazil Gaming Accessories Market Revenue (Million) Forecast, by Application 2019 & 2032
  66. Table 66: Brazil Gaming Accessories Market Volume (K Unit) Forecast, by Application 2019 & 2032
  67. Table 67: Argentina Gaming Accessories Market Revenue (Million) Forecast, by Application 2019 & 2032
  68. Table 68: Argentina Gaming Accessories Market Volume (K Unit) Forecast, by Application 2019 & 2032
  69. Table 69: Peru Gaming Accessories Market Revenue (Million) Forecast, by Application 2019 & 2032
  70. Table 70: Peru Gaming Accessories Market Volume (K Unit) Forecast, by Application 2019 & 2032
  71. Table 71: Chile Gaming Accessories Market Revenue (Million) Forecast, by Application 2019 & 2032
  72. Table 72: Chile Gaming Accessories Market Volume (K Unit) Forecast, by Application 2019 & 2032
  73. Table 73: Colombia Gaming Accessories Market Revenue (Million) Forecast, by Application 2019 & 2032
  74. Table 74: Colombia Gaming Accessories Market Volume (K Unit) Forecast, by Application 2019 & 2032
  75. Table 75: Ecuador Gaming Accessories Market Revenue (Million) Forecast, by Application 2019 & 2032
  76. Table 76: Ecuador Gaming Accessories Market Volume (K Unit) Forecast, by Application 2019 & 2032
  77. Table 77: Venezuela Gaming Accessories Market Revenue (Million) Forecast, by Application 2019 & 2032
  78. Table 78: Venezuela Gaming Accessories Market Volume (K Unit) Forecast, by Application 2019 & 2032
  79. Table 79: Rest of South America Gaming Accessories Market Revenue (Million) Forecast, by Application 2019 & 2032
  80. Table 80: Rest of South America Gaming Accessories Market Volume (K Unit) Forecast, by Application 2019 & 2032
  81. Table 81: Global Gaming Accessories Market Revenue Million Forecast, by Country 2019 & 2032
  82. Table 82: Global Gaming Accessories Market Volume K Unit Forecast, by Country 2019 & 2032
  83. Table 83: United States Gaming Accessories Market Revenue (Million) Forecast, by Application 2019 & 2032
  84. Table 84: United States Gaming Accessories Market Volume (K Unit) Forecast, by Application 2019 & 2032
  85. Table 85: Canada Gaming Accessories Market Revenue (Million) Forecast, by Application 2019 & 2032
  86. Table 86: Canada Gaming Accessories Market Volume (K Unit) Forecast, by Application 2019 & 2032
  87. Table 87: Mexico Gaming Accessories Market Revenue (Million) Forecast, by Application 2019 & 2032
  88. Table 88: Mexico Gaming Accessories Market Volume (K Unit) Forecast, by Application 2019 & 2032
  89. Table 89: Global Gaming Accessories Market Revenue Million Forecast, by Country 2019 & 2032
  90. Table 90: Global Gaming Accessories Market Volume K Unit Forecast, by Country 2019 & 2032
  91. Table 91: United Arab Emirates Gaming Accessories Market Revenue (Million) Forecast, by Application 2019 & 2032
  92. Table 92: United Arab Emirates Gaming Accessories Market Volume (K Unit) Forecast, by Application 2019 & 2032
  93. Table 93: Saudi Arabia Gaming Accessories Market Revenue (Million) Forecast, by Application 2019 & 2032
  94. Table 94: Saudi Arabia Gaming Accessories Market Volume (K Unit) Forecast, by Application 2019 & 2032
  95. Table 95: South Africa Gaming Accessories Market Revenue (Million) Forecast, by Application 2019 & 2032
  96. Table 96: South Africa Gaming Accessories Market Volume (K Unit) Forecast, by Application 2019 & 2032
  97. Table 97: Rest of Middle East and Africa Gaming Accessories Market Revenue (Million) Forecast, by Application 2019 & 2032
  98. Table 98: Rest of Middle East and Africa Gaming Accessories Market Volume (K Unit) Forecast, by Application 2019 & 2032
  99. Table 99: Global Gaming Accessories Market Revenue Million Forecast, by Product Type 2019 & 2032
  100. Table 100: Global Gaming Accessories Market Volume K Unit Forecast, by Product Type 2019 & 2032
  101. Table 101: Global Gaming Accessories Market Revenue Million Forecast, by Device Type 2019 & 2032
  102. Table 102: Global Gaming Accessories Market Volume K Unit Forecast, by Device Type 2019 & 2032
  103. Table 103: Global Gaming Accessories Market Revenue Million Forecast, by Country 2019 & 2032
  104. Table 104: Global Gaming Accessories Market Volume K Unit Forecast, by Country 2019 & 2032
  105. Table 105: Global Gaming Accessories Market Revenue Million Forecast, by Product Type 2019 & 2032
  106. Table 106: Global Gaming Accessories Market Volume K Unit Forecast, by Product Type 2019 & 2032
  107. Table 107: Global Gaming Accessories Market Revenue Million Forecast, by Device Type 2019 & 2032
  108. Table 108: Global Gaming Accessories Market Volume K Unit Forecast, by Device Type 2019 & 2032
  109. Table 109: Global Gaming Accessories Market Revenue Million Forecast, by Country 2019 & 2032
  110. Table 110: Global Gaming Accessories Market Volume K Unit Forecast, by Country 2019 & 2032
  111. Table 111: Global Gaming Accessories Market Revenue Million Forecast, by Product Type 2019 & 2032
  112. Table 112: Global Gaming Accessories Market Volume K Unit Forecast, by Product Type 2019 & 2032
  113. Table 113: Global Gaming Accessories Market Revenue Million Forecast, by Device Type 2019 & 2032
  114. Table 114: Global Gaming Accessories Market Volume K Unit Forecast, by Device Type 2019 & 2032
  115. Table 115: Global Gaming Accessories Market Revenue Million Forecast, by Country 2019 & 2032
  116. Table 116: Global Gaming Accessories Market Volume K Unit Forecast, by Country 2019 & 2032
  117. Table 117: Global Gaming Accessories Market Revenue Million Forecast, by Product Type 2019 & 2032
  118. Table 118: Global Gaming Accessories Market Volume K Unit Forecast, by Product Type 2019 & 2032
  119. Table 119: Global Gaming Accessories Market Revenue Million Forecast, by Device Type 2019 & 2032
  120. Table 120: Global Gaming Accessories Market Volume K Unit Forecast, by Device Type 2019 & 2032
  121. Table 121: Global Gaming Accessories Market Revenue Million Forecast, by Country 2019 & 2032
  122. Table 122: Global Gaming Accessories Market Volume K Unit Forecast, by Country 2019 & 2032
  123. Table 123: Global Gaming Accessories Market Revenue Million Forecast, by Product Type 2019 & 2032
  124. Table 124: Global Gaming Accessories Market Volume K Unit Forecast, by Product Type 2019 & 2032
  125. Table 125: Global Gaming Accessories Market Revenue Million Forecast, by Device Type 2019 & 2032
  126. Table 126: Global Gaming Accessories Market Volume K Unit Forecast, by Device Type 2019 & 2032
  127. Table 127: Global Gaming Accessories Market Revenue Million Forecast, by Country 2019 & 2032
  128. Table 128: Global Gaming Accessories Market Volume K Unit Forecast, by Country 2019 & 2032


Frequently Asked Questions

1. What is the projected Compound Annual Growth Rate (CAGR) of the Gaming Accessories Market?

The projected CAGR is approximately 10.22%.

2. Which companies are prominent players in the Gaming Accessories Market?

Key companies in the market include Corsair Components Inc, HyperX, Anker, Alienware (Dell), Mad Catz Global Limited, SteelSeries, Turtle Beach Corporation, Nintendo Co Ltd, Nvidia Corporation, Sennheiser Electronic GmbH & Co KG, Razer Inc, Reddragon (Eastern Times Technology Co Ltd), Cooler Master Co Ltd, Logitech International SA, Sony Corporation.

3. What are the main segments of the Gaming Accessories Market?

The market segments include Product Type, Device Type.

4. Can you provide details about the market size?

The market size is estimated to be USD 11.88 Million as of 2022.

5. What are some drivers contributing to market growth?

Rise in e-sports gaming to fuel the demand for gaming accessory equipment; New console and computer GPU unit launch to present an increase of demands for accessories.

6. What are the notable trends driving market growth?

Rise in E-Sports Gaming to Fuel the Demand for Gaming Accessory Equipment to Drive the Market Growth.

7. Are there any restraints impacting market growth?

Fluctuation in the production of silicon chips leading to shortage in demand of gaming accessories.

8. Can you provide examples of recent developments in the market?

April 2023: Razer Inc. announced the 2023 Razer BlackShark V2 Pro, the definitive esports headset evolves. The wireless headset is optimized for performance with cutting-edge audio, durable comfort, and ultra-fast connectivity, boasting a new innovative Razer HyperClear Super Wideband Mic, built-in Pro-Tuned FPS Profiles, 70-hour battery life, Type C charging capabilities, Bluetooth connectivity, and more, the enhanced 2023 BlackShark V2 Pro has been designed in collaboration with some of the world's top esports players, including Hakis (Alliance), Shotzzy (OpTic Gaming), Dexter (MOUZ), Refsgaard (Ninjas in Pyjamas), & Stax (DRX).

9. What pricing options are available for accessing the report?

Pricing options include single-user, multi-user, and enterprise licenses priced at USD 4750, USD 5250, and USD 8750 respectively.

10. Is the market size provided in terms of value or volume?

The market size is provided in terms of value, measured in Million and volume, measured in K Unit.

11. Are there any specific market keywords associated with the report?

Yes, the market keyword associated with the report is "Gaming Accessories Market," which aids in identifying and referencing the specific market segment covered.

12. How do I determine which pricing option suits my needs best?

The pricing options vary based on user requirements and access needs. Individual users may opt for single-user licenses, while businesses requiring broader access may choose multi-user or enterprise licenses for cost-effective access to the report.

13. Are there any additional resources or data provided in the Gaming Accessories Market report?

While the report offers comprehensive insights, it's advisable to review the specific contents or supplementary materials provided to ascertain if additional resources or data are available.

14. How can I stay updated on further developments or reports in the Gaming Accessories Market?

To stay informed about further developments, trends, and reports in the Gaming Accessories Market, consider subscribing to industry newsletters, following relevant companies and organizations, or regularly checking reputable industry news sources and publications.


Methodology

Step 1 - Identification of Relevant Samples Size from Population Database

Step Chart
Bar Chart
Method Chart

Step 2 - Approaches for Defining Global Market Size (Value, Volume* & Price*)

Approach Chart
Top-down and bottom-up approaches are used to validate the global market size and estimate the market size for manufactures, regional segments, product, and application.

Note*: In applicable scenarios

Step 3 - Data Sources

Primary Research

  • Web Analytics
  • Survey Reports
  • Research Institute
  • Latest Research Reports
  • Opinion Leaders

Secondary Research

  • Annual Reports
  • White Paper
  • Latest Press Release
  • Industry Association
  • Paid Database
  • Investor Presentations
Analyst Chart

Step 4 - Data Triangulation

Involves using different sources of information in order to increase the validity of a study

These sources are likely to be stakeholders in a program - participants, other researchers, program staff, other community members, and so on.

Then we put all data in single framework & apply various statistical tools to find out the dynamic on the market.

During the analysis stage, feedback from the stakeholder groups would be compared to determine areas of agreement as well as areas of divergence

Additionally, after gathering mixed and scattered data from a wide range of sources, data is triangulated and correlated to come up with estimated figures which are further validated through primary mediums or industry experts, opinion leaders.

About Visionary Data Reports

Visionary Data Reports provides future-focused market research, advanced analytics, and strategic insights for technology, healthcare, green energy, and finance. Our reports help you anticipate trends, innovate, and lead in your industry. Our expert team combines primary research, data science, and industry knowledge to deliver actionable intelligence. We offer syndicated reports, custom analytics, and consulting services tailored to your business needs. At Visionary Data Reports, we are committed to quality, transparency, and client satisfaction. Every report is rigorously validated to ensure accuracy and relevance. Our global perspective and forward-thinking approach help you understand both current and emerging market dynamics.

Stay ahead with Visionary Data Reports. Subscribe to our newsletter for the latest insights and research highlights, and follow us on social media for real-time updates. Visionary Data Reports – Your Guide to Tomorrow’s Opportunities.

artwork spiralartwork spiralRelated Reports
artwork underline

Japan Cloud Data Center Industry Industry Growth Trends and Analysis

Explore the booming Japan Cloud Data Center Industry with key insights into market size, CAGR of 21.06%, drivers, trends, and top companies. Discover growth opportunities and regional analysis.

October 2025
Base Year: 2024
No Of Pages: 197
Price: $3800

DLP Market Market Size and Trends 2025-2033: Comprehensive Outlook

Explore the booming Data Loss Prevention (DLP) market, projected to hit USD 2.86 billion by 2025 with a 22.77% CAGR. Discover key drivers like AI, cloud security, and regulatory compliance shaping the future of data protection.

October 2025
Base Year: 2024
No Of Pages: 234
Price: $4750

Navigating Hebei Data Center Market Market Trends: Competitor Analysis and Growth 2025-2033

Explore the booming Hebei data center market, driven by digital transformation and cloud adoption. Discover key growth drivers, trends, restraints, and market size projections up to 2033.

October 2025
Base Year: 2024
No Of Pages: 197
Price: $3800

Strategic Insights for Tactical Inertial Systems Market Market Expansion

Explore the booming Tactical Inertial Systems Market with projected growth to over $4.7 billion by 2033. Discover key drivers like defense modernization, technological advancements in MEMS, FOG, and RLG, and insights into market segments, leading companies, and regional trends.

October 2025
Base Year: 2024
No Of Pages: 234
Price: $4750

Regional Analysis of North America Clinical Data Analytics in Healthcare Industry Growth Trajectories

The size of the North America Clinical Data Analytics in Healthcare Industry market was valued at USD 12.85 Million in 2024 and is projected to reach USD 33.01 Million by 2033, with an expected CAGR of 14.43% during the forecast period.

October 2025
Base Year: 2024
No Of Pages: 197
Price: $3800

Proximity Sensor Industry Industry Analysis and Consumer Behavior

Explore the booming global proximity sensor market, driven by automation and IoT. Discover market size, CAGR of 7.30%, key drivers, restraints, technology trends, and industry segments from 2019-2033.

October 2025
Base Year: 2024
No Of Pages: 234
Price: $4750

Exploring Innovation in Enterprise Mobility In Healthcare Market Industry

The size of the Enterprise Mobility In Healthcare Market market was valued at USD XX Million in 2024 and is projected to reach USD XXX Million by 2033, with an expected CAGR of 11.92% during the forecast period.

October 2025
Base Year: 2024
No Of Pages: 234
Price: $4750

US Hazardous Location LED Lighting Industry Navigating Dynamics Comprehensive Analysis and Forecasts 2025-2033

Explore the dynamic US Hazardous Location LED Lighting market, forecasting substantial growth driven by safety demands in oil & gas, petrochemicals, and industrial sectors. Discover key trends, drivers, and restraints.

October 2025
Base Year: 2024
No Of Pages: 197
Price: $3800

Automotive LED Lighting Market Market Demand Dynamics: Insights 2025-2033

Explore the dynamic Automotive LED Lighting Market with expert analysis on growth drivers, trends, restraints, and key segments. Discover market size, CAGR of 16.42%, and regional insights for 2025-2033.

October 2025
Base Year: 2024
No Of Pages: 197
Price: $3800

Latin America IT Device Market Market’s Evolutionary Trends 2025-2033

Explore the Latin America IT Device Market analysis, including market size, CAGR, drivers, trends, restraints, segments, and regional insights for Brazil, Argentina, Mexico, and more.

October 2025
Base Year: 2024
No Of Pages: 234
Price: $4750

Europe Outdoor LED Lighting Market Market Overview: Growth and Insights

Explore the booming Europe Outdoor LED Lighting Market, driven by energy efficiency, smart technology, and urban development. Discover key trends, drivers, and growth forecasts for street, public, and roadway lighting.

October 2025
Base Year: 2024
No Of Pages: 197
Price: $3800

Media Streaming Market Market Overview: Trends and Strategic Forecasts 2025-2033

Explore the booming media streaming market forecast, driven by music & video streaming, subscription models, and smart devices. Analyze key players, growth drivers, and regional trends from 2019-2033.

October 2025
Base Year: 2024
No Of Pages: 234
Price: $4750

Digital Signage Media Player Market Navigating Dynamics Comprehensive Analysis and Forecasts 2025-2033

Explore the surging Digital Signage Media Player Market, valued at \$1.95 billion and projected to grow at a 9.09% CAGR. Discover key drivers, trends, and segmentation across retail, hospitality, corporate, and transportation sectors.

October 2025
Base Year: 2024
No Of Pages: 234
Price: $4750

United Kingdom System Integrator Market for Industrial Automation and Emerging Technologies: Growth Insights 2025-2033

Explore the UK Industrial Automation System Integrator Market's robust growth, driven by Industry 4.0 adoption, PLCs, DCS, SCADA, HMIs, and robotics. Analyze key drivers, trends, and restraints shaping the future of manufacturing, automotive, food & beverage, and pharmaceutical sectors.

October 2025
Base Year: 2024
No Of Pages: 197
Price: $3800

Growth Roadmap for Internet of Things in the Energy Market Market 2025-2033

Explore the dynamic Internet of Things (IoT) in Energy Market, driven by efficiency and grid modernization. Discover key drivers, trends, and growth opportunities from 2019-2033.

October 2025
Base Year: 2024
No Of Pages: 234
Price: $4750

Edge Analytics Industry Insightful Analysis: Trends, Competitor Dynamics, and Opportunities 2025-2033

The size of the Edge Analytics Industry market was valued at USD 13.88 Million in 2024 and is projected to reach USD 64.86 Million by 2033, with an expected CAGR of 24.64% during the forecast period.

October 2025
Base Year: 2024
No Of Pages: 234
Price: $4750

Service Delivery Automation Industry: Harnessing Emerging Innovations for Growth 2025-2033

Explore the booming Service Delivery Automation market with insights into its $30.65M size, impressive 27.25% CAGR, key drivers, and future trends. Discover opportunities in BFSI, IT, and healthcare.

October 2025
Base Year: 2024
No Of Pages: 234
Price: $4750

Europe Sortation System Industry XX CAGR Growth to Drive Market Size to XXX Million by 2033

Explore the booming European Sortation System Industry! Discover market size, CAGR, key drivers like e-commerce & automation trends, and leading companies from 2025-2033.

October 2025
Base Year: 2024
No Of Pages: 210
Price: $4750

Strategic Insights into United Kingdom Marketing Agencies Market Market Trends

Explore the UK marketing agencies market's growth trajectory, key drivers like digital transformation, and dominant services. Discover trends in BFSI, Retail, and IT sectors with insights from leading agencies.

October 2025
Base Year: 2024
No Of Pages: 197
Price: $3800

Chemical Sensor Market Insights: Market Size Analysis to 2033

Explore the booming Chemical Sensor Market analysis, uncovering key growth drivers, emerging trends like IoT integration and advanced materials, and market size projections up to 2033. Discover segment-specific opportunities and regional market shares.

October 2025
Base Year: 2024
No Of Pages: 234
Price: $4750

Gas Sensor, Detector and Analyzer Market Charting Growth Trajectories 2025-2033: Strategic Insights and Forecasts

Explore the booming Gas Sensor, Detector, and Analyzer market, driven by environmental regulations and safety needs. Discover market size, CAGR, key drivers, trends, and leading companies shaping the future of gas monitoring.

October 2025
Base Year: 2024
No Of Pages: 234
Price: $4750

Romania Facility Management Industry XX CAGR Growth Analysis 2025-2033

Explore the dynamic Romania Facility Management market, highlighting growth drivers, key trends like bundled FM services, and market size projections up to 2033. Discover insights for commercial, institutional, and industrial sectors.

October 2025
Base Year: 2024
No Of Pages: 197
Price: $3800

Workforce Management Industry Market Overview: Trends and Strategic Forecasts 2025-2033

Explore the dynamic Workforce Management industry's growth, driven by cloud adoption and advanced analytics. Discover market trends, key drivers, and forecasts for 2025-2033, alongside leading companies and regional insights.

October 2025
Base Year: 2024
No Of Pages: 197
Price: $3800

Self-Organizing Network Market Market Analysis and Forecasts

The size of the Self-Organizing Network Market market was valued at USD XX Million in 2024 and is projected to reach USD XXX Million by 2033, with an expected CAGR of 11.00% during the forecast period.

October 2025
Base Year: 2024
No Of Pages: 234
Price: $4750

US Hardware OTP Token Authentication Market Trends and Opportunities for Growth

Explore the robust growth and key drivers of the US Hardware OTP Token Authentication Market, featuring insights on CAGR, market size, and dominant industry segments for enhanced digital security.

October 2025
Base Year: 2024
No Of Pages: 197
Price: $3800

Team Collaboration Tools Industry Consumer Behavior Dynamics: Key Trends 2025-2033

The size of the Team Collaboration Tools Industry market was valued at USD XX Million in 2024 and is projected to reach USD XXX Million by 2033, with an expected CAGR of 18.00% during the forecast period.

October 2025
Base Year: 2024
No Of Pages: 234
Price: $4750

Exploring Innovation in Video Streaming Market Industry

Explore the booming video streaming market, projected for massive growth driven by OTT, live streaming, and subscription models. Discover key drivers, trends, and leading companies.

October 2025
Base Year: 2024
No Of Pages: 234
Price: $4750

South Korea Data Center Rack Market Unlocking Growth Potential: 2025-2033 Analysis and Forecasts

Explore the booming South Korea data center rack market analysis, revealing key insights, CAGR, market drivers, and trends in racks, size, and end-users from 2019-2033.

October 2025
Base Year: 2024
No Of Pages: 197
Price: $3800

Iraq ICT Market Strategic Dynamics: Competitor Analysis 2025-2033

Explore the Iraqi ICT market's dynamic growth, driven by digital transformation, IT services, and telecommunications. Uncover key trends, drivers, and segments shaping Iraq's technology landscape through 2033.

October 2025
Base Year: 2024
No Of Pages: 197
Price: $3800

Comprehensive Overview of Canada Digital Transformation Market Trends: 2025-2033

Canada's digital transformation market is set for rapid expansion, driven by XR, IoT, AI, and Cloud. Discover key trends, drivers, and market size projections for 2025-2033.

October 2025
Base Year: 2024
No Of Pages: 197
Price: $3800

Drivers of Change in Europe Thermal Imaging Systems Market Market 2025-2033

Explore the dynamic European Thermal Imaging Systems Market, driven by robust growth, advanced security needs, and key industry applications. Discover market size, CAGR, key trends, and future projections up to 2033.

October 2025
Base Year: 2024
No Of Pages: 210
Price: $4750

UK Telecom Industry Report 2025: Growth Driven by Government Incentives and Partnerships

Explore the dynamic UK telecom industry forecast, analyzing market size, CAGR of 4.59%, key drivers like 5G and OTT services, and leading companies. Get insights into voice, data, and pay TV segments.

October 2025
Base Year: 2024
No Of Pages: 197
Price: $3800

Comprehensive Overview of Europe HVAC Market Trends: 2025-2033

The size of the Europe HVAC Market market was valued at USD 28.67 Million in 2024 and is projected to reach USD 43.68 Million by 2033, with an expected CAGR of 6.20% during the forecast period.

October 2025
Base Year: 2024
No Of Pages: 210
Price: $4750

Future Forecasts for South America Data Center Server Market Industry Growth

Explore the booming South America Data Center Server Market. Discover key insights, growth drivers, market size projections (2019-2033), and leading companies. Understand the impact of digital transformation and cloud adoption on server infrastructure.

October 2025
Base Year: 2024
No Of Pages: 234
Price: $4750

Exploring Opportunities in Internet of Things Security Industry Sector

Explore the booming Internet of Things (IoT) Security market, projected to reach USD 65 billion by 2033 with a 33.53% CAGR. Discover key drivers, trends, and segments for robust cybersecurity.

October 2025
Base Year: 2024
No Of Pages: 234
Price: $4750

South Korea Smart Home Market Market Analysis and Growth Roadmap

Explore the booming South Korea smart home market, projected for significant growth with a 16.15% CAGR. Discover key drivers, emerging trends in Wi-Fi and Bluetooth technologies, and leading companies shaping smart living.

October 2025
Base Year: 2024
No Of Pages: 197
Price: $3800

Market Deep Dive: Exploring Collaborative Robot Market Trends 2025-2033

Explore the booming Collaborative Robot Market, driven by automation, AI, and affordability. Discover key drivers, trends, and market size projections up to 2033 for electronics, automotive, manufacturing, and more.

October 2025
Base Year: 2024
No Of Pages: 234
Price: $4750

Exploring Europe Structured Cabling Market Market Evolution 2025-2033

Explore the dynamic European structured cabling market, driven by 5G, IoT, and data center growth. Get insights on market size, CAGR, drivers, and key players from 2019-2033.

October 2025
Base Year: 2024
No Of Pages: 210
Price: $4750

Understanding Growth Trends in Europe Machine Vision Systems Industry Market

Explore the booming Europe Machine Vision Systems market, driven by Industry 4.0 adoption, automation, and AI. Discover key trends, growth drivers, restraints, and forecast for 2025-2033.

October 2025
Base Year: 2024
No Of Pages: 210
Price: $4750

Radiation Detection, Monitoring & Safety Industry 2025-2033 Trends: Unveiling Growth Opportunities and Competitor Dynamics

Explore the dynamic Radiation Detection, Monitoring & Safety market, driven by healthcare, industrial, and defense needs. Discover growth drivers, key trends, and market size projections through 2033.

October 2025
Base Year: 2024
No Of Pages: 234
Price: $4750

North America Location Analytics Market Future-Proof Strategies: Market Trends 2025-2033

Explore the booming North America Location Analytics Market, projected to reach $4.49 million with a 16.32% CAGR. Discover key drivers, trends, and applications in retail, banking, and manufacturing.

October 2025
Base Year: 2024
No Of Pages: 197
Price: $3800

Growth Strategies in BI Market Market: 2025-2033 Outlook

Explore the dynamic Business Intelligence (BI) market, projected to reach $33.34 million with a 13.16% CAGR by 2033. Discover key drivers, trends like AI integration, and dominant industry segments shaping the future of data analytics.

October 2025
Base Year: 2024
No Of Pages: 234
Price: $4750

China Fitness Rings Market Market Predictions: Growth and Size Trends to 2033

Explore the booming China fitness rings market, driven by health trends and wearable tech adoption. Discover market size, CAGR, key players like Xiaomi and Huawei, and future growth potential through 2033.

October 2025
Base Year: 2024
No Of Pages: 197
Price: $3800

Unveiling South Korea Automotive LED Lighting Market Industry Trends

Explore the dynamic South Korea automotive LED lighting market with an estimated $1.2 billion size in 2025 and a strong 9.26% CAGR. Discover key growth drivers, emerging trends, and leading companies shaping the future of automotive lighting in Korea, from DRLs to advanced vehicle illumination.

October 2025
Base Year: 2024
No Of Pages: 197
Price: $3800

Exploring Barriers in Organic Field-Effect Transistor Industry Market: Trends and Analysis 2025-2033

Explore the booming Organic Field-Effect Transistor (OFET) market, driven by flexible electronics, IoT, and advanced applications. Discover market size, CAGR, key drivers, trends, and leading companies shaping the future of semiconductors.

October 2025
Base Year: 2024
No Of Pages: 234
Price: $4750

Data Wrangling Market 2025-2033 Market Analysis: Trends, Dynamics, and Growth Opportunities

Explore the booming Data Wrangling Market analysis, drivers, trends, and forecasts. Discover how businesses leverage data preparation for smarter insights and growth through 2033.

September 2025
Base Year: 2024
No Of Pages: 234
Price: $4750

North America Touch Screen Controllers Market Planning for the Future: Key Trends 2025-2033

Explore the North America touch screen controllers market forecast, driven by automotive, healthcare, and consumer electronics. Discover key insights, CAGR of 13.40%, and market trends.

September 2025
Base Year: 2024
No Of Pages: 210
Price: $4750

Europe Access Control Software Market Market’s Growth Blueprint

Explore the dynamic European Access Control Software Market, projected to reach \$153.30 million by 2025 with an 8.90% CAGR. Discover key drivers, trends, restraints, and leading companies shaping enhanced security solutions across commercial, residential, and industrial sectors.

September 2025
Base Year: 2024
No Of Pages: 210
Price: $4750

Comprehensive Insights into Wi-Fi Network Equipment Market: Trends and Growth Projections 2025-2033

The size of the Wi-Fi Network Equipment Market market was valued at USD 1.85 Million in 2024 and is projected to reach USD 3.93 Million by 2033, with an expected CAGR of 11.35% during the forecast period.

September 2025
Base Year: 2024
No Of Pages: 234
Price: $4750

Vertical Lift Module (VLM) Industry Market’s Consumer Preferences: Trends and Analysis 2025-2033

The size of the Vertical Lift Module (VLM) Industry market was valued at USD XX Million in 2024 and is projected to reach USD XXX Million by 2033, with an expected CAGR of 8.00% during the forecast period.

September 2025
Base Year: 2024
No Of Pages: 234
Price: $4750
  • Home
  • About Us
  • Industries
    • Aerospace & Defense
    • Agriculture
    • Animal Nutrition & Wellness
    • Automotive
    • Chemicals & Materials
    • Consumer Goods and Services
    • Energy & Power
    • Financial Services and Investment Intelligence
    • Food & Beverage
    • Home and Property Improvement
    • Hospitality and Tourism
    • Logistics
    • Manufacturing Products and Services
    • Packaging
    • Professional and Commercial Services
    • Real Estate and Construction
    • Retail
    • Technology, Media and Telecom
    • Healthcare
  • Services
  • Contact
Main Logo
  • Home
  • About Us
  • Industries
    • Aerospace & Defense
    • Agriculture
    • Animal Nutrition & Wellness
    • Automotive
    • Chemicals & Materials
    • Consumer Goods and Services
    • Energy & Power
    • Financial Services and Investment Intelligence
    • Food & Beverage
    • Home and Property Improvement
    • Hospitality and Tourism
    • Logistics
    • Manufacturing Products and Services
    • Packaging
    • Professional and Commercial Services
    • Real Estate and Construction
    • Retail
    • Technology, Media and Telecom
    • Healthcare
  • Services
  • Contact
+17162654855
[email protected]

+17162654855

[email protected]

Business Address

Head Office

Ansec House 3 rd floor Tank Road, Yerwada, Pune, Maharashtra 411014

Contact Information

Craig Francis

Business Development Head

+17162654855

[email protected]

Secure Payment Partners

payment image
RetailLogisticsPackagingAutomotiveHealthcareAgricultureEnergy & PowerFood & BeverageAerospace & DefenseChemicals & MaterialsHospitality and TourismAnimal Nutrition & WellnessConsumer Goods and ServicesReal Estate and ConstructionHome and Property ImprovementTechnology, Media and TelecomManufacturing Products and ServicesFinancial Services and Investment Intelligence

© 2025 PRDUA Research & Media Private Limited, All rights reserved

Privacy Policy
Terms and Conditions
FAQ