
Key Insights
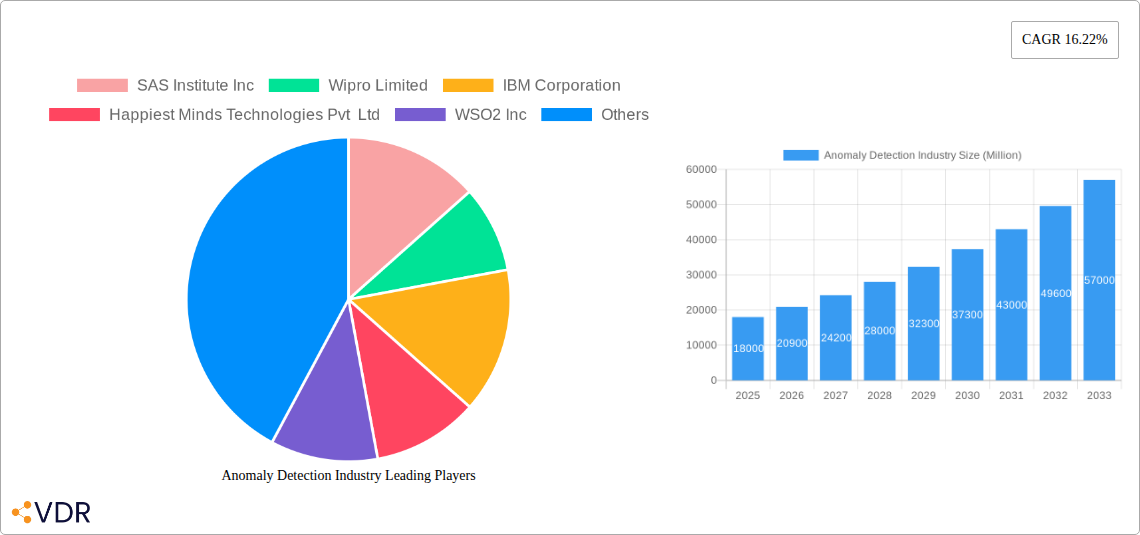
The anomaly detection market is experiencing robust growth, fueled by the increasing volume and complexity of data generated across various industries. The market's Compound Annual Growth Rate (CAGR) of 16.22% from 2019 to 2024 suggests a significant upward trajectory, projected to continue throughout the forecast period (2025-2033). Key drivers include the rising need for enhanced cybersecurity, fraud detection, and predictive maintenance across sectors like BFSI (Banking, Financial Services, and Insurance), manufacturing, healthcare, and IT & telecommunications. The shift towards cloud-based deployment models further accelerates market expansion, offering scalability and cost-effectiveness. While data privacy concerns and the complexity of implementing and managing anomaly detection systems pose challenges, the substantial benefits in risk mitigation and operational efficiency outweigh these restraints. The market is segmented by type (solutions and services), end-user industry (with BFSI and Manufacturing currently leading), and deployment (cloud showing strong growth). Major players like SAS Institute, IBM, Microsoft, and specialized firms are actively innovating and expanding their offerings to cater to this burgeoning demand, fostering competition and driving further market development.
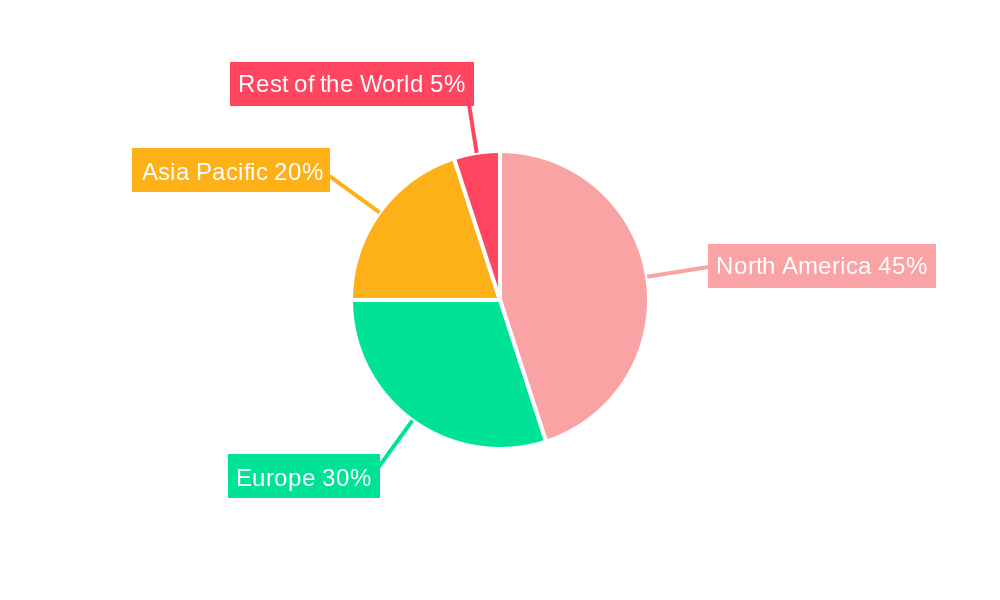
The projected market size in 2025 serves as a crucial benchmark. Assuming a conservative estimate based on the CAGR and considering market saturation factors, the 2025 market size is likely in the range of $15-20 billion (the actual figure would require further granular data). This substantial value underscores the market's potential for substantial future growth. The dominance of North America and Europe in terms of market share is expected to continue, although the Asia-Pacific region, driven by strong economic growth and increasing digitalization in countries like India and Japan, is anticipated to exhibit faster growth rates over the forecast period. Furthermore, the continuing advancement of AI and machine learning technologies will likely fuel the development of more sophisticated and effective anomaly detection solutions, further contributing to this market's expansion.
Anomaly Detection Industry Market Report: 2019-2033
This comprehensive report provides a detailed analysis of the Anomaly Detection industry, encompassing market dynamics, growth trends, regional dominance, competitive landscape, and future outlook. The study period covers 2019-2033, with 2025 as the base and estimated year. The report segments the market by type (Solutions, Service), end-user industry (BFSI, Manufacturing, Healthcare, IT & Telecommunications, Others), and deployment (On-premise, Cloud), providing granular insights for informed decision-making. The total market size is projected to reach xx Million by 2033.
Anomaly Detection Industry Market Dynamics & Structure
The Anomaly Detection market is experiencing significant growth driven by increasing data volumes, the rising adoption of cloud computing, and the need for enhanced cybersecurity. Market concentration is moderate, with several key players holding substantial market share, while smaller niche players cater to specific industry needs. Technological innovation, particularly in AI and Machine Learning, is a primary growth driver. Regulatory frameworks, like GDPR and CCPA, influence data handling and security practices, creating both challenges and opportunities. The market witnesses continuous M&A activity, with larger players acquiring smaller companies to expand their product portfolios and technological capabilities.
- Market Concentration: Moderately concentrated, with top 5 players holding approximately xx% market share in 2025.
- Technological Innovation: AI, Machine Learning, and Big Data analytics are key drivers. Innovation barriers include high implementation costs and skilled talent scarcity.
- Regulatory Frameworks: GDPR, CCPA, and other data privacy regulations significantly influence market dynamics.
- Competitive Substitutes: Traditional security solutions pose competitive pressure.
- End-User Demographics: BFSI and IT & Telecommunications sectors are early adopters, while healthcare and manufacturing are showing increasing adoption.
- M&A Trends: Consistent M&A activity, with an average of xx deals annually during 2019-2024.
Anomaly Detection Industry Growth Trends & Insights
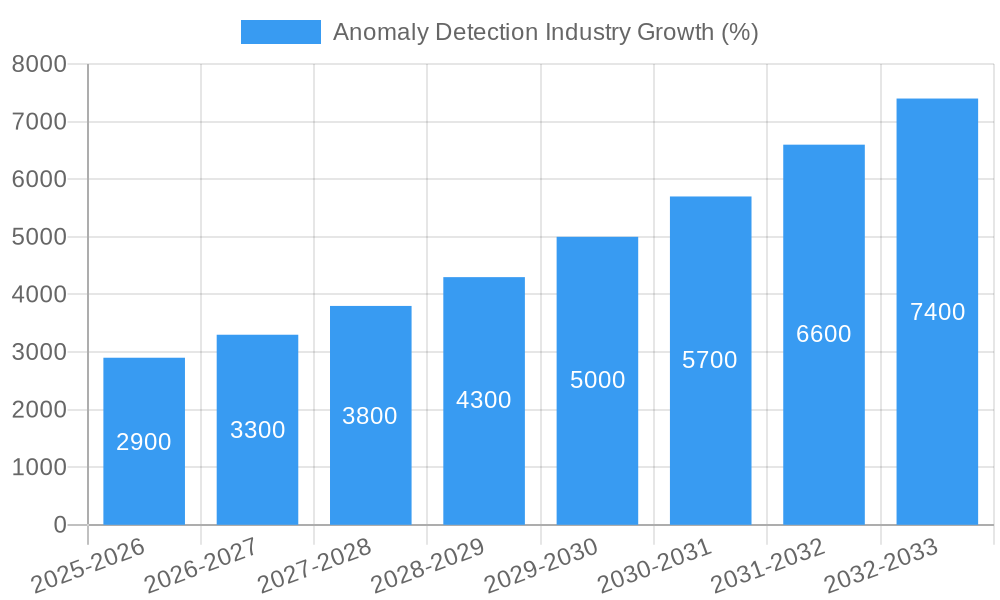
The Anomaly Detection market exhibits a robust growth trajectory, fueled by the increasing sophistication of cyber threats and the growing need for proactive security measures across various industries. The market experienced a CAGR of xx% during the historical period (2019-2024) and is projected to maintain a CAGR of xx% during the forecast period (2025-2033). Increased adoption rates are primarily driven by cloud adoption, improved data analytics capabilities, and the rising awareness of potential data breaches and cyberattacks. Technological disruptions, such as the advancements in AI and machine learning, are continuously improving anomaly detection accuracy and efficiency, further fueling market expansion. Consumer behavior shifts, with a growing preference for cloud-based solutions and a heightened focus on data security, are influencing market growth. The market size was valued at xx Million in 2024 and is projected to reach xx Million by 2033.
Dominant Regions, Countries, or Segments in Anomaly Detection Industry
North America currently dominates the Anomaly Detection market, driven by strong technological advancements, high adoption rates, and a well-established IT infrastructure. Within North America, the United States is the leading country, with a significant portion of the market share. The BFSI sector accounts for the largest segment share by end-user industry, followed by the IT and Telecommunications sector. Cloud deployment is rapidly gaining traction, owing to its scalability, cost-effectiveness, and accessibility.
- Key Drivers: Strong technological infrastructure, high digitalization rates, proactive regulatory environment, and high investments in cybersecurity.
- Dominance Factors: Early adoption of advanced technologies, high awareness of data security risks, and the presence of major technology players.
- Growth Potential: Emerging markets in Asia Pacific and EMEA present significant growth opportunities.
Anomaly Detection Industry Product Landscape
The Anomaly Detection market offers a diverse range of solutions, encompassing both software and hardware components. Products are characterized by their ability to leverage AI and Machine Learning algorithms to identify unusual patterns and outliers within large datasets. Key features include real-time monitoring, automated alert systems, and customizable dashboards for effective threat detection and response. Recent advancements have focused on improving accuracy, reducing false positives, and enhancing integration with existing security infrastructure. Unique selling propositions often center on the speed and accuracy of anomaly detection, the ease of integration, and the breadth of supported data sources.
Key Drivers, Barriers & Challenges in Anomaly Detection Industry
Key Drivers:
- The increasing volume and complexity of data necessitate sophisticated anomaly detection solutions.
- The growing prevalence of cyberattacks and data breaches is driving the adoption of proactive security measures.
- The rising adoption of cloud computing and the proliferation of IoT devices create new opportunities for anomaly detection.
Challenges and Restraints:
- The high cost of implementation and maintenance of anomaly detection systems can pose a barrier to entry for smaller organizations.
- The complexity of deploying and managing these systems requires specialized skills and expertise. This shortage represents approximately a xx% challenge to the growth in 2025.
- Competition from existing security solutions and the need for continuous upgrades and updates to keep pace with evolving threats are significant challenges.
Emerging Opportunities in Anomaly Detection Industry
Emerging opportunities in the Anomaly Detection market include:
- Expanding into untapped markets, such as the industrial IoT (IIoT) and smart city sectors.
- Leveraging AI and machine learning to improve the accuracy and efficiency of anomaly detection.
- Developing solutions tailored to specific industry needs, such as healthcare or finance.
- Integrating anomaly detection with other security solutions to provide a comprehensive security posture.
Growth Accelerators in the Anomaly Detection Industry
Long-term growth in the Anomaly Detection market will be fueled by continuous technological advancements in AI and machine learning, strategic partnerships between technology providers and industry verticals, and the expansion into new geographic markets. Increased investments in research and development and the emergence of innovative applications will further accelerate market growth.
Key Players Shaping the Anomaly Detection Industry Market
- SAS Institute Inc
- Wipro Limited
- IBM Corporation
- Happiest Minds Technologies Pvt Ltd
- WSO2 Inc
- Cisco Systems Inc
- Microsoft Corporation
- Trend Micro Incorporated
- Verint Systems Inc
- Guardian Analytics Inc
- Broadcom Inc (Symantec Corporation)
- List Not Exhaustive
Notable Milestones in Anomaly Detection Industry Sector
- June 2023: Wipro launched a new suite of banking financial services built on Microsoft Cloud, leveraging combined expertise to accelerate growth for financial services clients.
- June 2023: Cisco announced its AI-driven Cisco Security Cloud, simplifying cybersecurity and empowering users with enhanced protection against sophisticated threats.
In-Depth Anomaly Detection Industry Market Outlook
The Anomaly Detection market is poised for sustained growth, driven by ongoing technological advancements, increasing demand for robust cybersecurity solutions, and expansion into new applications and sectors. Strategic partnerships, focused innovation, and proactive adaptation to evolving security threats will be key success factors for industry players. The market's future potential is substantial, offering significant opportunities for both established players and new entrants.
Anomaly Detection Industry Segmentation
-
1. Type
- 1.1. Solutions
- 1.2. Service
-
2. End-user Industry
- 2.1. BFSI
- 2.2. Manufacturing
- 2.3. Healthcare
- 2.4. IT and Telecommunications
- 2.5. Other End-user Industries
-
3. Deployment
- 3.1. On-premise
- 3.2. Cloud
Anomaly Detection Industry Segmentation By Geography
-
1. North America
- 1.1. United States
- 1.2. Canada
-
2. Europe
- 2.1. United Kingdom
- 2.2. Germany
- 2.3. France
-
3. Asia
- 3.1. Australia
- 3.2. Japan
- 3.3. India
- 4. Latin America
- 5. Middle East and Africa
Anomaly Detection Industry REPORT HIGHLIGHTS
| Aspects | Details |
|---|---|
| Study Period | 2019-2033 |
| Base Year | 2024 |
| Estimated Year | 2025 |
| Forecast Period | 2025-2033 |
| Historical Period | 2019-2024 |
| Growth Rate | CAGR of 16.22% from 2019-2033 |
| Segmentation |
|
Table of Contents
- 1. Introduction
- 1.1. Research Scope
- 1.2. Market Segmentation
- 1.3. Research Methodology
- 1.4. Definitions and Assumptions
- 2. Executive Summary
- 2.1. Introduction
- 3. Market Dynamics
- 3.1. Introduction
- 3.2. Market Drivers
- 3.2.1. Increasing Number of Cyber Crimes; Increasing Adoption of Anomaly Detection Solutions in Software Testing
- 3.3. Market Restrains
- 3.3.1. Open Source Alternatives Pose as a Threat
- 3.4. Market Trends
- 3.4.1. BFSI is Expected to Hold a Significant Part of the Market Share
- 4. Market Factor Analysis
- 4.1. Porters Five Forces
- 4.2. Supply/Value Chain
- 4.3. PESTEL analysis
- 4.4. Market Entropy
- 4.5. Patent/Trademark Analysis
- 5. Global Anomaly Detection Industry Analysis, Insights and Forecast, 2019-2031
- 5.1. Market Analysis, Insights and Forecast - by Type
- 5.1.1. Solutions
- 5.1.2. Service
- 5.2. Market Analysis, Insights and Forecast - by End-user Industry
- 5.2.1. BFSI
- 5.2.2. Manufacturing
- 5.2.3. Healthcare
- 5.2.4. IT and Telecommunications
- 5.2.5. Other End-user Industries
- 5.3. Market Analysis, Insights and Forecast - by Deployment
- 5.3.1. On-premise
- 5.3.2. Cloud
- 5.4. Market Analysis, Insights and Forecast - by Region
- 5.4.1. North America
- 5.4.2. Europe
- 5.4.3. Asia
- 5.4.4. Latin America
- 5.4.5. Middle East and Africa
- 5.1. Market Analysis, Insights and Forecast - by Type
- 6. North America Anomaly Detection Industry Analysis, Insights and Forecast, 2019-2031
- 6.1. Market Analysis, Insights and Forecast - by Type
- 6.1.1. Solutions
- 6.1.2. Service
- 6.2. Market Analysis, Insights and Forecast - by End-user Industry
- 6.2.1. BFSI
- 6.2.2. Manufacturing
- 6.2.3. Healthcare
- 6.2.4. IT and Telecommunications
- 6.2.5. Other End-user Industries
- 6.3. Market Analysis, Insights and Forecast - by Deployment
- 6.3.1. On-premise
- 6.3.2. Cloud
- 6.1. Market Analysis, Insights and Forecast - by Type
- 7. Europe Anomaly Detection Industry Analysis, Insights and Forecast, 2019-2031
- 7.1. Market Analysis, Insights and Forecast - by Type
- 7.1.1. Solutions
- 7.1.2. Service
- 7.2. Market Analysis, Insights and Forecast - by End-user Industry
- 7.2.1. BFSI
- 7.2.2. Manufacturing
- 7.2.3. Healthcare
- 7.2.4. IT and Telecommunications
- 7.2.5. Other End-user Industries
- 7.3. Market Analysis, Insights and Forecast - by Deployment
- 7.3.1. On-premise
- 7.3.2. Cloud
- 7.1. Market Analysis, Insights and Forecast - by Type
- 8. Asia Anomaly Detection Industry Analysis, Insights and Forecast, 2019-2031
- 8.1. Market Analysis, Insights and Forecast - by Type
- 8.1.1. Solutions
- 8.1.2. Service
- 8.2. Market Analysis, Insights and Forecast - by End-user Industry
- 8.2.1. BFSI
- 8.2.2. Manufacturing
- 8.2.3. Healthcare
- 8.2.4. IT and Telecommunications
- 8.2.5. Other End-user Industries
- 8.3. Market Analysis, Insights and Forecast - by Deployment
- 8.3.1. On-premise
- 8.3.2. Cloud
- 8.1. Market Analysis, Insights and Forecast - by Type
- 9. Latin America Anomaly Detection Industry Analysis, Insights and Forecast, 2019-2031
- 9.1. Market Analysis, Insights and Forecast - by Type
- 9.1.1. Solutions
- 9.1.2. Service
- 9.2. Market Analysis, Insights and Forecast - by End-user Industry
- 9.2.1. BFSI
- 9.2.2. Manufacturing
- 9.2.3. Healthcare
- 9.2.4. IT and Telecommunications
- 9.2.5. Other End-user Industries
- 9.3. Market Analysis, Insights and Forecast - by Deployment
- 9.3.1. On-premise
- 9.3.2. Cloud
- 9.1. Market Analysis, Insights and Forecast - by Type
- 10. Middle East and Africa Anomaly Detection Industry Analysis, Insights and Forecast, 2019-2031
- 10.1. Market Analysis, Insights and Forecast - by Type
- 10.1.1. Solutions
- 10.1.2. Service
- 10.2. Market Analysis, Insights and Forecast - by End-user Industry
- 10.2.1. BFSI
- 10.2.2. Manufacturing
- 10.2.3. Healthcare
- 10.2.4. IT and Telecommunications
- 10.2.5. Other End-user Industries
- 10.3. Market Analysis, Insights and Forecast - by Deployment
- 10.3.1. On-premise
- 10.3.2. Cloud
- 10.1. Market Analysis, Insights and Forecast - by Type
- 11. North America Anomaly Detection Industry Analysis, Insights and Forecast, 2019-2031
- 11.1. Market Analysis, Insights and Forecast - By Country/Sub-region
- 11.1.1 United States
- 11.1.2 Canada
- 12. Europe Anomaly Detection Industry Analysis, Insights and Forecast, 2019-2031
- 12.1. Market Analysis, Insights and Forecast - By Country/Sub-region
- 12.1.1 United Kingdom
- 12.1.2 Germany
- 12.1.3 France
- 12.1.4 Rest of Europe
- 13. Asia Pacific Anomaly Detection Industry Analysis, Insights and Forecast, 2019-2031
- 13.1. Market Analysis, Insights and Forecast - By Country/Sub-region
- 13.1.1 Australia
- 13.1.2 Japan
- 13.1.3 India
- 13.1.4 Rest of Asia Pacific
- 14. Rest of the World Anomaly Detection Industry Analysis, Insights and Forecast, 2019-2031
- 14.1. Market Analysis, Insights and Forecast - By Country/Sub-region
- 14.1.1.
- 15. Competitive Analysis
- 15.1. Global Market Share Analysis 2024
- 15.2. Company Profiles
- 15.2.1 SAS Institute Inc
- 15.2.1.1. Overview
- 15.2.1.2. Products
- 15.2.1.3. SWOT Analysis
- 15.2.1.4. Recent Developments
- 15.2.1.5. Financials (Based on Availability)
- 15.2.2 Wipro Limited
- 15.2.2.1. Overview
- 15.2.2.2. Products
- 15.2.2.3. SWOT Analysis
- 15.2.2.4. Recent Developments
- 15.2.2.5. Financials (Based on Availability)
- 15.2.3 IBM Corporation
- 15.2.3.1. Overview
- 15.2.3.2. Products
- 15.2.3.3. SWOT Analysis
- 15.2.3.4. Recent Developments
- 15.2.3.5. Financials (Based on Availability)
- 15.2.4 Happiest Minds Technologies Pvt Ltd
- 15.2.4.1. Overview
- 15.2.4.2. Products
- 15.2.4.3. SWOT Analysis
- 15.2.4.4. Recent Developments
- 15.2.4.5. Financials (Based on Availability)
- 15.2.5 WSO2 Inc
- 15.2.5.1. Overview
- 15.2.5.2. Products
- 15.2.5.3. SWOT Analysis
- 15.2.5.4. Recent Developments
- 15.2.5.5. Financials (Based on Availability)
- 15.2.6 Cisco Systems Inc
- 15.2.6.1. Overview
- 15.2.6.2. Products
- 15.2.6.3. SWOT Analysis
- 15.2.6.4. Recent Developments
- 15.2.6.5. Financials (Based on Availability)
- 15.2.7 Microsoft Corporation
- 15.2.7.1. Overview
- 15.2.7.2. Products
- 15.2.7.3. SWOT Analysis
- 15.2.7.4. Recent Developments
- 15.2.7.5. Financials (Based on Availability)
- 15.2.8 Trend Micro Incorporated
- 15.2.8.1. Overview
- 15.2.8.2. Products
- 15.2.8.3. SWOT Analysis
- 15.2.8.4. Recent Developments
- 15.2.8.5. Financials (Based on Availability)
- 15.2.9 Verint Systems Inc
- 15.2.9.1. Overview
- 15.2.9.2. Products
- 15.2.9.3. SWOT Analysis
- 15.2.9.4. Recent Developments
- 15.2.9.5. Financials (Based on Availability)
- 15.2.10 Guardian Analytics Inc *List Not Exhaustive
- 15.2.10.1. Overview
- 15.2.10.2. Products
- 15.2.10.3. SWOT Analysis
- 15.2.10.4. Recent Developments
- 15.2.10.5. Financials (Based on Availability)
- 15.2.11 Broadcom Inc (Symantec Corporation)
- 15.2.11.1. Overview
- 15.2.11.2. Products
- 15.2.11.3. SWOT Analysis
- 15.2.11.4. Recent Developments
- 15.2.11.5. Financials (Based on Availability)
- 15.2.1 SAS Institute Inc
List of Figures
- Figure 1: Global Anomaly Detection Industry Revenue Breakdown (Million, %) by Region 2024 & 2032
- Figure 2: North America Anomaly Detection Industry Revenue (Million), by Country 2024 & 2032
- Figure 3: North America Anomaly Detection Industry Revenue Share (%), by Country 2024 & 2032
- Figure 4: Europe Anomaly Detection Industry Revenue (Million), by Country 2024 & 2032
- Figure 5: Europe Anomaly Detection Industry Revenue Share (%), by Country 2024 & 2032
- Figure 6: Asia Pacific Anomaly Detection Industry Revenue (Million), by Country 2024 & 2032
- Figure 7: Asia Pacific Anomaly Detection Industry Revenue Share (%), by Country 2024 & 2032
- Figure 8: Rest of the World Anomaly Detection Industry Revenue (Million), by Country 2024 & 2032
- Figure 9: Rest of the World Anomaly Detection Industry Revenue Share (%), by Country 2024 & 2032
- Figure 10: North America Anomaly Detection Industry Revenue (Million), by Type 2024 & 2032
- Figure 11: North America Anomaly Detection Industry Revenue Share (%), by Type 2024 & 2032
- Figure 12: North America Anomaly Detection Industry Revenue (Million), by End-user Industry 2024 & 2032
- Figure 13: North America Anomaly Detection Industry Revenue Share (%), by End-user Industry 2024 & 2032
- Figure 14: North America Anomaly Detection Industry Revenue (Million), by Deployment 2024 & 2032
- Figure 15: North America Anomaly Detection Industry Revenue Share (%), by Deployment 2024 & 2032
- Figure 16: North America Anomaly Detection Industry Revenue (Million), by Country 2024 & 2032
- Figure 17: North America Anomaly Detection Industry Revenue Share (%), by Country 2024 & 2032
- Figure 18: Europe Anomaly Detection Industry Revenue (Million), by Type 2024 & 2032
- Figure 19: Europe Anomaly Detection Industry Revenue Share (%), by Type 2024 & 2032
- Figure 20: Europe Anomaly Detection Industry Revenue (Million), by End-user Industry 2024 & 2032
- Figure 21: Europe Anomaly Detection Industry Revenue Share (%), by End-user Industry 2024 & 2032
- Figure 22: Europe Anomaly Detection Industry Revenue (Million), by Deployment 2024 & 2032
- Figure 23: Europe Anomaly Detection Industry Revenue Share (%), by Deployment 2024 & 2032
- Figure 24: Europe Anomaly Detection Industry Revenue (Million), by Country 2024 & 2032
- Figure 25: Europe Anomaly Detection Industry Revenue Share (%), by Country 2024 & 2032
- Figure 26: Asia Anomaly Detection Industry Revenue (Million), by Type 2024 & 2032
- Figure 27: Asia Anomaly Detection Industry Revenue Share (%), by Type 2024 & 2032
- Figure 28: Asia Anomaly Detection Industry Revenue (Million), by End-user Industry 2024 & 2032
- Figure 29: Asia Anomaly Detection Industry Revenue Share (%), by End-user Industry 2024 & 2032
- Figure 30: Asia Anomaly Detection Industry Revenue (Million), by Deployment 2024 & 2032
- Figure 31: Asia Anomaly Detection Industry Revenue Share (%), by Deployment 2024 & 2032
- Figure 32: Asia Anomaly Detection Industry Revenue (Million), by Country 2024 & 2032
- Figure 33: Asia Anomaly Detection Industry Revenue Share (%), by Country 2024 & 2032
- Figure 34: Latin America Anomaly Detection Industry Revenue (Million), by Type 2024 & 2032
- Figure 35: Latin America Anomaly Detection Industry Revenue Share (%), by Type 2024 & 2032
- Figure 36: Latin America Anomaly Detection Industry Revenue (Million), by End-user Industry 2024 & 2032
- Figure 37: Latin America Anomaly Detection Industry Revenue Share (%), by End-user Industry 2024 & 2032
- Figure 38: Latin America Anomaly Detection Industry Revenue (Million), by Deployment 2024 & 2032
- Figure 39: Latin America Anomaly Detection Industry Revenue Share (%), by Deployment 2024 & 2032
- Figure 40: Latin America Anomaly Detection Industry Revenue (Million), by Country 2024 & 2032
- Figure 41: Latin America Anomaly Detection Industry Revenue Share (%), by Country 2024 & 2032
- Figure 42: Middle East and Africa Anomaly Detection Industry Revenue (Million), by Type 2024 & 2032
- Figure 43: Middle East and Africa Anomaly Detection Industry Revenue Share (%), by Type 2024 & 2032
- Figure 44: Middle East and Africa Anomaly Detection Industry Revenue (Million), by End-user Industry 2024 & 2032
- Figure 45: Middle East and Africa Anomaly Detection Industry Revenue Share (%), by End-user Industry 2024 & 2032
- Figure 46: Middle East and Africa Anomaly Detection Industry Revenue (Million), by Deployment 2024 & 2032
- Figure 47: Middle East and Africa Anomaly Detection Industry Revenue Share (%), by Deployment 2024 & 2032
- Figure 48: Middle East and Africa Anomaly Detection Industry Revenue (Million), by Country 2024 & 2032
- Figure 49: Middle East and Africa Anomaly Detection Industry Revenue Share (%), by Country 2024 & 2032
List of Tables
- Table 1: Global Anomaly Detection Industry Revenue Million Forecast, by Region 2019 & 2032
- Table 2: Global Anomaly Detection Industry Revenue Million Forecast, by Type 2019 & 2032
- Table 3: Global Anomaly Detection Industry Revenue Million Forecast, by End-user Industry 2019 & 2032
- Table 4: Global Anomaly Detection Industry Revenue Million Forecast, by Deployment 2019 & 2032
- Table 5: Global Anomaly Detection Industry Revenue Million Forecast, by Region 2019 & 2032
- Table 6: Global Anomaly Detection Industry Revenue Million Forecast, by Country 2019 & 2032
- Table 7: United States Anomaly Detection Industry Revenue (Million) Forecast, by Application 2019 & 2032
- Table 8: Canada Anomaly Detection Industry Revenue (Million) Forecast, by Application 2019 & 2032
- Table 9: Global Anomaly Detection Industry Revenue Million Forecast, by Country 2019 & 2032
- Table 10: United Kingdom Anomaly Detection Industry Revenue (Million) Forecast, by Application 2019 & 2032
- Table 11: Germany Anomaly Detection Industry Revenue (Million) Forecast, by Application 2019 & 2032
- Table 12: France Anomaly Detection Industry Revenue (Million) Forecast, by Application 2019 & 2032
- Table 13: Rest of Europe Anomaly Detection Industry Revenue (Million) Forecast, by Application 2019 & 2032
- Table 14: Global Anomaly Detection Industry Revenue Million Forecast, by Country 2019 & 2032
- Table 15: Australia Anomaly Detection Industry Revenue (Million) Forecast, by Application 2019 & 2032
- Table 16: Japan Anomaly Detection Industry Revenue (Million) Forecast, by Application 2019 & 2032
- Table 17: India Anomaly Detection Industry Revenue (Million) Forecast, by Application 2019 & 2032
- Table 18: Rest of Asia Pacific Anomaly Detection Industry Revenue (Million) Forecast, by Application 2019 & 2032
- Table 19: Global Anomaly Detection Industry Revenue Million Forecast, by Country 2019 & 2032
- Table 20: Anomaly Detection Industry Revenue (Million) Forecast, by Application 2019 & 2032
- Table 21: Global Anomaly Detection Industry Revenue Million Forecast, by Type 2019 & 2032
- Table 22: Global Anomaly Detection Industry Revenue Million Forecast, by End-user Industry 2019 & 2032
- Table 23: Global Anomaly Detection Industry Revenue Million Forecast, by Deployment 2019 & 2032
- Table 24: Global Anomaly Detection Industry Revenue Million Forecast, by Country 2019 & 2032
- Table 25: United States Anomaly Detection Industry Revenue (Million) Forecast, by Application 2019 & 2032
- Table 26: Canada Anomaly Detection Industry Revenue (Million) Forecast, by Application 2019 & 2032
- Table 27: Global Anomaly Detection Industry Revenue Million Forecast, by Type 2019 & 2032
- Table 28: Global Anomaly Detection Industry Revenue Million Forecast, by End-user Industry 2019 & 2032
- Table 29: Global Anomaly Detection Industry Revenue Million Forecast, by Deployment 2019 & 2032
- Table 30: Global Anomaly Detection Industry Revenue Million Forecast, by Country 2019 & 2032
- Table 31: United Kingdom Anomaly Detection Industry Revenue (Million) Forecast, by Application 2019 & 2032
- Table 32: Germany Anomaly Detection Industry Revenue (Million) Forecast, by Application 2019 & 2032
- Table 33: France Anomaly Detection Industry Revenue (Million) Forecast, by Application 2019 & 2032
- Table 34: Global Anomaly Detection Industry Revenue Million Forecast, by Type 2019 & 2032
- Table 35: Global Anomaly Detection Industry Revenue Million Forecast, by End-user Industry 2019 & 2032
- Table 36: Global Anomaly Detection Industry Revenue Million Forecast, by Deployment 2019 & 2032
- Table 37: Global Anomaly Detection Industry Revenue Million Forecast, by Country 2019 & 2032
- Table 38: Australia Anomaly Detection Industry Revenue (Million) Forecast, by Application 2019 & 2032
- Table 39: Japan Anomaly Detection Industry Revenue (Million) Forecast, by Application 2019 & 2032
- Table 40: India Anomaly Detection Industry Revenue (Million) Forecast, by Application 2019 & 2032
- Table 41: Global Anomaly Detection Industry Revenue Million Forecast, by Type 2019 & 2032
- Table 42: Global Anomaly Detection Industry Revenue Million Forecast, by End-user Industry 2019 & 2032
- Table 43: Global Anomaly Detection Industry Revenue Million Forecast, by Deployment 2019 & 2032
- Table 44: Global Anomaly Detection Industry Revenue Million Forecast, by Country 2019 & 2032
- Table 45: Global Anomaly Detection Industry Revenue Million Forecast, by Type 2019 & 2032
- Table 46: Global Anomaly Detection Industry Revenue Million Forecast, by End-user Industry 2019 & 2032
- Table 47: Global Anomaly Detection Industry Revenue Million Forecast, by Deployment 2019 & 2032
- Table 48: Global Anomaly Detection Industry Revenue Million Forecast, by Country 2019 & 2032
Frequently Asked Questions
1. What is the projected Compound Annual Growth Rate (CAGR) of the Anomaly Detection Industry?
The projected CAGR is approximately 16.22%.
2. Which companies are prominent players in the Anomaly Detection Industry?
Key companies in the market include SAS Institute Inc, Wipro Limited, IBM Corporation, Happiest Minds Technologies Pvt Ltd, WSO2 Inc, Cisco Systems Inc, Microsoft Corporation, Trend Micro Incorporated, Verint Systems Inc, Guardian Analytics Inc *List Not Exhaustive, Broadcom Inc (Symantec Corporation).
3. What are the main segments of the Anomaly Detection Industry?
The market segments include Type, End-user Industry, Deployment.
4. Can you provide details about the market size?
The market size is estimated to be USD XX Million as of 2022.
5. What are some drivers contributing to market growth?
Increasing Number of Cyber Crimes; Increasing Adoption of Anomaly Detection Solutions in Software Testing.
6. What are the notable trends driving market growth?
BFSI is Expected to Hold a Significant Part of the Market Share.
7. Are there any restraints impacting market growth?
Open Source Alternatives Pose as a Threat.
8. Can you provide examples of recent developments in the market?
June 2023: Wipro has launched a new suite of banking financial services built on Microsoft Cloud; the partnership will combine Microsoft Cloud capabilities with Wipro FullStride Cloud and leverage Wipro's and Capco's deep domain expertise in financial services. And develop new solutions to help financial services clients accelerate growth and deepen client relationships.
9. What pricing options are available for accessing the report?
Pricing options include single-user, multi-user, and enterprise licenses priced at USD 4750, USD 5250, and USD 8750 respectively.
10. Is the market size provided in terms of value or volume?
The market size is provided in terms of value, measured in Million.
11. Are there any specific market keywords associated with the report?
Yes, the market keyword associated with the report is "Anomaly Detection Industry," which aids in identifying and referencing the specific market segment covered.
12. How do I determine which pricing option suits my needs best?
The pricing options vary based on user requirements and access needs. Individual users may opt for single-user licenses, while businesses requiring broader access may choose multi-user or enterprise licenses for cost-effective access to the report.
13. Are there any additional resources or data provided in the Anomaly Detection Industry report?
While the report offers comprehensive insights, it's advisable to review the specific contents or supplementary materials provided to ascertain if additional resources or data are available.
14. How can I stay updated on further developments or reports in the Anomaly Detection Industry?
To stay informed about further developments, trends, and reports in the Anomaly Detection Industry, consider subscribing to industry newsletters, following relevant companies and organizations, or regularly checking reputable industry news sources and publications.
Methodology
Step 1 - Identification of Relevant Samples Size from Population Database


Step 2 - Approaches for Defining Global Market Size (Value, Volume* & Price*)

Note*: In applicable scenarios
Step 3 - Data Sources
Primary Research
- Web Analytics
- Survey Reports
- Research Institute
- Latest Research Reports
- Opinion Leaders
Secondary Research
- Annual Reports
- White Paper
- Latest Press Release
- Industry Association
- Paid Database
- Investor Presentations

Step 4 - Data Triangulation
Involves using different sources of information in order to increase the validity of a study
These sources are likely to be stakeholders in a program - participants, other researchers, program staff, other community members, and so on.
Then we put all data in single framework & apply various statistical tools to find out the dynamic on the market.
During the analysis stage, feedback from the stakeholder groups would be compared to determine areas of agreement as well as areas of divergence


