
Key Insights
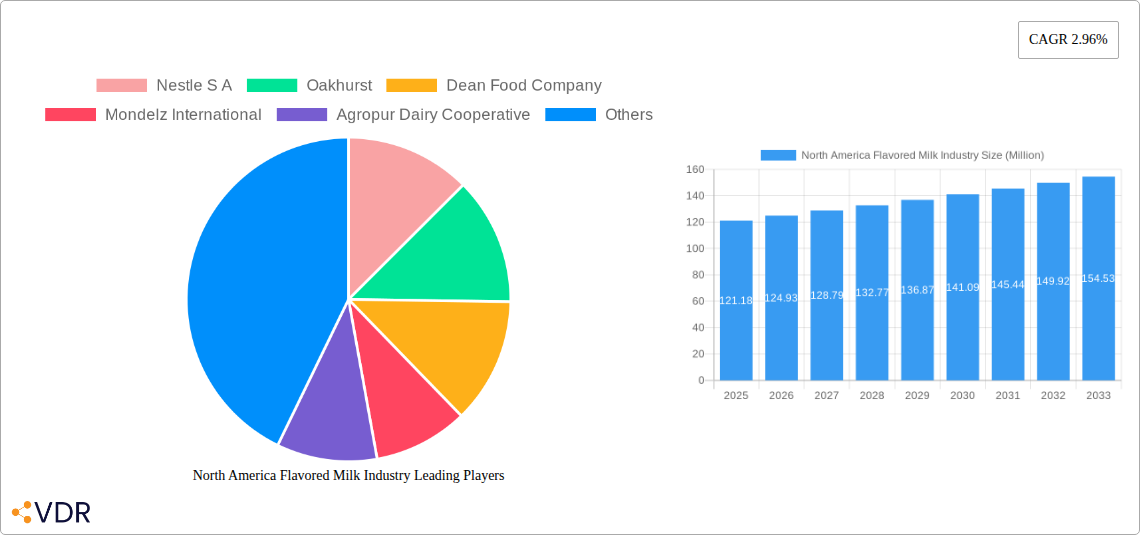
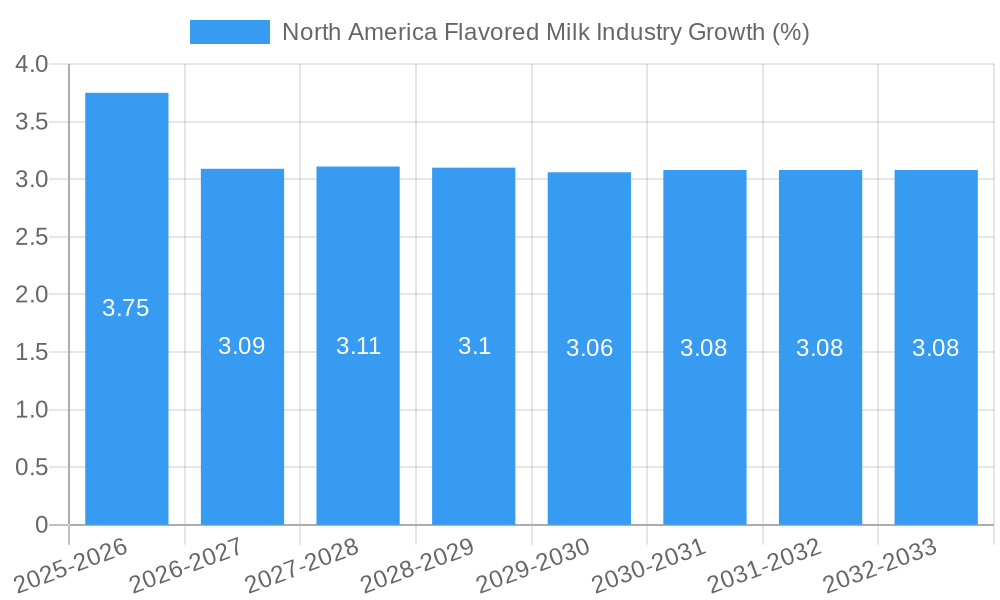
The North American flavored milk market, valued at $121.18 million in 2025, is projected to experience steady growth, driven by increasing consumer demand for convenient and flavorful dairy and plant-based options. The Compound Annual Growth Rate (CAGR) of 2.96% from 2025 to 2033 suggests a consistent market expansion, although this rate may be influenced by evolving consumer preferences and economic factors. Key growth drivers include the rising popularity of innovative flavors catering to diverse palates, the increasing availability of flavored milk in convenient formats such as single-serve bottles and ready-to-drink cartons, and the expanding presence of flavored milk in various retail channels, including supermarkets, convenience stores, and online platforms. The market segmentation by type (dairy-based and plant-based) highlights a dynamic landscape, with plant-based alternatives gaining traction due to increasing health consciousness and dietary preferences. Similarly, the distribution channel segmentation reveals the significance of supermarkets/hypermarkets and the emerging role of online retail in driving market accessibility and sales. Major players like Nestle, Danone, and Kraft Heinz are well-positioned to leverage these trends, while smaller regional brands and emerging plant-based companies contribute to the market's diversity and competitiveness.
The market's growth, however, faces certain restraints. Fluctuations in raw material costs (milk, sugar, and flavorings) can impact profitability and pricing. Growing consumer awareness of added sugars and potential health implications of excessive consumption could dampen demand for certain flavored milk varieties. Intense competition among established players and new entrants necessitates continuous innovation and effective marketing strategies to maintain market share. To mitigate these challenges, companies are likely to focus on product diversification (e.g., organic, low-sugar, functional flavored milk options), strategic partnerships, and targeted marketing campaigns highlighting the benefits and versatility of flavored milk. Future growth will depend on the ability of industry players to adapt to evolving consumer preferences, address concerns regarding health and nutrition, and effectively navigate the complexities of the retail landscape. Further segmentation by region within North America (US, Canada, Mexico) would provide a deeper understanding of market dynamics and growth potential in specific geographic areas.
North America Flavored Milk Industry: A Comprehensive Market Analysis (2019-2033)
This in-depth report provides a comprehensive analysis of the North America flavored milk industry, encompassing market dynamics, growth trends, regional performance, competitive landscape, and future outlook. The study covers the period from 2019 to 2033, with 2025 serving as the base and estimated year. The report utilizes both qualitative and quantitative data to offer actionable insights for industry professionals, investors, and stakeholders. The parent market is the broader dairy industry, while the child market focuses specifically on flavored milk products. The market size is valued in million units.
North America Flavored Milk Industry Market Dynamics & Structure
The North American flavored milk market is characterized by moderate concentration, with key players holding significant market share. Technological innovations, particularly in packaging and flavor development, are driving growth, alongside evolving consumer preferences. Regulatory frameworks concerning labeling and nutritional content significantly impact market dynamics. The competitive landscape includes both dairy-based and plant-based alternatives, creating a dynamic environment. Mergers and acquisitions (M&A) activity has been relatively moderate in recent years, with approximately xx deals recorded between 2019 and 2024.
- Market Concentration: Moderately concentrated, with top 5 players holding approximately xx% market share in 2024.
- Technological Innovation: Focus on sustainable packaging, innovative flavor profiles, and extended shelf life.
- Regulatory Framework: Stringent regulations on labeling, nutritional claims, and added sugars.
- Competitive Substitutes: Plant-based milk alternatives, fruit juices, and other beverages.
- End-User Demographics: Primarily focused on children and young adults, with increasing demand from health-conscious consumers.
- M&A Trends: Moderate activity, driven by consolidation and expansion into new segments.
North America Flavored Milk Industry Growth Trends & Insights
The North America flavored milk market experienced a CAGR of xx% during the historical period (2019-2024), reaching a market size of xx million units in 2024. This growth is attributed to factors such as increased consumer demand for convenient and enjoyable beverages, coupled with the introduction of innovative products. Technological disruptions, such as improved processing techniques and packaging solutions, have contributed to market expansion. Changing consumer preferences, particularly towards healthier options and plant-based alternatives, are reshaping market dynamics. The forecast period (2025-2033) projects a CAGR of xx%, driven by factors like growing health awareness and the development of functional flavored milk products. Market penetration is expected to increase to xx% by 2033.
Dominant Regions, Countries, or Segments in North America Flavored Milk Industry
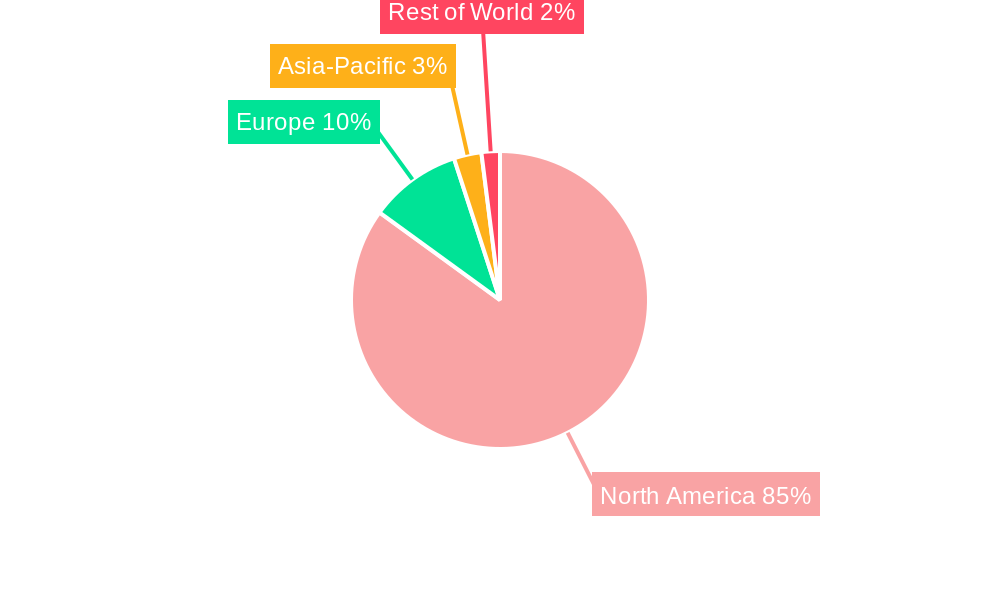
The United States dominates the North American flavored milk market, accounting for xx% of total sales in 2024. Strong consumer demand and robust distribution networks contribute to its leading position. The Dairy-based segment holds the largest market share, with a preference for traditional flavors. Within distribution channels, Supermarkets/Hypermarkets represent the largest sales segment due to high accessibility and volume purchasing.
Key Drivers (US): Large consumer base, strong retail infrastructure, and established distribution networks.
Key Drivers (Dairy-based): Consumer familiarity, established taste preferences, and competitive pricing.
Key Drivers (Supermarkets/Hypermarkets): High accessibility, volume purchasing opportunities, and brand visibility.
Growth Potential: The plant-based segment presents significant growth potential, driven by increasing health consciousness and ethical concerns. Online retail channels are also expected to witness substantial growth. Canada and Mexico offer promising expansion opportunities.
North America Flavored Milk Industry Product Landscape
The North American flavored milk market offers a diverse range of products, including traditional dairy-based options with classic flavors like chocolate and strawberry, alongside innovative varieties such as protein-enhanced and organic flavored milks. Plant-based alternatives, such as almond and soy-based flavored milk, cater to growing health and dietary preferences. Key product innovations include unique flavor combinations, functional ingredients (e.g., probiotics, vitamins), and sustainable packaging. These advancements enhance product appeal, drive premium pricing, and improve sustainability.
Key Drivers, Barriers & Challenges in North America Flavored Milk Industry
Key Drivers: Increasing demand for convenient beverages, innovation in flavors and functional ingredients, growing health consciousness (particularly with functional milk), and expanding distribution networks.
Key Challenges: Intense competition from alternative beverages, rising raw material costs, fluctuating milk prices, and stringent regulations related to labeling and nutritional claims. Supply chain disruptions caused by various factors including geopolitical issues, can lead to price fluctuations and limited availability.
Emerging Opportunities in North America Flavored Milk Industry
Untapped markets include functional and health-focused flavored milks targeting specific health concerns. Opportunities exist in developing innovative flavors catering to diverse consumer preferences, focusing on regional tastes. Expanding into emerging online retail channels and targeting specific demographics with personalized offerings are further avenues for growth.
Growth Accelerators in the North America Flavored Milk Industry
Strategic partnerships and collaborations between milk producers and flavoring companies, coupled with investment in research and development for new products and technologies, will be crucial for market growth. Expansion into emerging markets and the strategic development of plant-based options will further accelerate growth within the industry.
Key Players Shaping the North America Flavored Milk Industry Market
- Nestle S.A.
- Oakhurst
- Dean Foods Company
- Mondelz International
- Agropur Dairy Cooperative
- The Kraft Heinz Company
- Danone
- The Farmer's Cow
- Fairlife LLC
- Saputo Inc
- The Hershey Company
Notable Milestones in North America Flavored Milk Industry Sector
- 2021: Launch of several plant-based flavored milk options by major players.
- 2022: Increased focus on sustainable packaging solutions by several leading brands.
- 2023: Several mergers and acquisitions within the industry to enhance market share.
- 2024: Introduction of several functional flavored milk products enriched with probiotics and vitamins.
In-Depth North America Flavored Milk Industry Market Outlook
The North American flavored milk market is poised for sustained growth over the forecast period. Continued innovation in product development, expansion into emerging markets, and strategic alliances will play a key role in shaping future market dynamics. The increasing demand for convenient, healthy, and enjoyable beverages presents significant growth opportunities for existing players and new entrants alike.
North America Flavored Milk Industry Segmentation
-
1. Type
- 1.1. Dairy Based
- 1.2. Plant Based
-
2. Distribution Channel
- 2.1. Supermarkets/Hypermarkets
- 2.2. Convenience Stores
- 2.3. Specialist Stores
- 2.4. Online Retail Stores
- 2.5. Other Distribution Channels
-
3. Geography
- 3.1. United States
- 3.2. Canada
- 3.3. Mexico
- 3.4. Rest of North America
North America Flavored Milk Industry Segmentation By Geography
- 1. United States
- 2. Canada
- 3. Mexico
- 4. Rest of North America
North America Flavored Milk Industry REPORT HIGHLIGHTS
| Aspects | Details |
|---|---|
| Study Period | 2019-2033 |
| Base Year | 2024 |
| Estimated Year | 2025 |
| Forecast Period | 2025-2033 |
| Historical Period | 2019-2024 |
| Growth Rate | CAGR of 2.96% from 2019-2033 |
| Segmentation |
|
Table of Contents
- 1. Introduction
- 1.1. Research Scope
- 1.2. Market Segmentation
- 1.3. Research Methodology
- 1.4. Definitions and Assumptions
- 2. Executive Summary
- 2.1. Introduction
- 3. Market Dynamics
- 3.1. Introduction
- 3.2. Market Drivers
- 3.2.1. Government Initiatives and E-commerce Penetration
- 3.3. Market Restrains
- 3.3.1. Detrimental Health Impact of Caffeine Intake
- 3.4. Market Trends
- 3.4.1. Surge In Demand For Fortified Milk Products
- 4. Market Factor Analysis
- 4.1. Porters Five Forces
- 4.2. Supply/Value Chain
- 4.3. PESTEL analysis
- 4.4. Market Entropy
- 4.5. Patent/Trademark Analysis
- 5. North America Flavored Milk Industry Analysis, Insights and Forecast, 2019-2031
- 5.1. Market Analysis, Insights and Forecast - by Type
- 5.1.1. Dairy Based
- 5.1.2. Plant Based
- 5.2. Market Analysis, Insights and Forecast - by Distribution Channel
- 5.2.1. Supermarkets/Hypermarkets
- 5.2.2. Convenience Stores
- 5.2.3. Specialist Stores
- 5.2.4. Online Retail Stores
- 5.2.5. Other Distribution Channels
- 5.3. Market Analysis, Insights and Forecast - by Geography
- 5.3.1. United States
- 5.3.2. Canada
- 5.3.3. Mexico
- 5.3.4. Rest of North America
- 5.4. Market Analysis, Insights and Forecast - by Region
- 5.4.1. United States
- 5.4.2. Canada
- 5.4.3. Mexico
- 5.4.4. Rest of North America
- 5.1. Market Analysis, Insights and Forecast - by Type
- 6. United States North America Flavored Milk Industry Analysis, Insights and Forecast, 2019-2031
- 6.1. Market Analysis, Insights and Forecast - by Type
- 6.1.1. Dairy Based
- 6.1.2. Plant Based
- 6.2. Market Analysis, Insights and Forecast - by Distribution Channel
- 6.2.1. Supermarkets/Hypermarkets
- 6.2.2. Convenience Stores
- 6.2.3. Specialist Stores
- 6.2.4. Online Retail Stores
- 6.2.5. Other Distribution Channels
- 6.3. Market Analysis, Insights and Forecast - by Geography
- 6.3.1. United States
- 6.3.2. Canada
- 6.3.3. Mexico
- 6.3.4. Rest of North America
- 6.1. Market Analysis, Insights and Forecast - by Type
- 7. Canada North America Flavored Milk Industry Analysis, Insights and Forecast, 2019-2031
- 7.1. Market Analysis, Insights and Forecast - by Type
- 7.1.1. Dairy Based
- 7.1.2. Plant Based
- 7.2. Market Analysis, Insights and Forecast - by Distribution Channel
- 7.2.1. Supermarkets/Hypermarkets
- 7.2.2. Convenience Stores
- 7.2.3. Specialist Stores
- 7.2.4. Online Retail Stores
- 7.2.5. Other Distribution Channels
- 7.3. Market Analysis, Insights and Forecast - by Geography
- 7.3.1. United States
- 7.3.2. Canada
- 7.3.3. Mexico
- 7.3.4. Rest of North America
- 7.1. Market Analysis, Insights and Forecast - by Type
- 8. Mexico North America Flavored Milk Industry Analysis, Insights and Forecast, 2019-2031
- 8.1. Market Analysis, Insights and Forecast - by Type
- 8.1.1. Dairy Based
- 8.1.2. Plant Based
- 8.2. Market Analysis, Insights and Forecast - by Distribution Channel
- 8.2.1. Supermarkets/Hypermarkets
- 8.2.2. Convenience Stores
- 8.2.3. Specialist Stores
- 8.2.4. Online Retail Stores
- 8.2.5. Other Distribution Channels
- 8.3. Market Analysis, Insights and Forecast - by Geography
- 8.3.1. United States
- 8.3.2. Canada
- 8.3.3. Mexico
- 8.3.4. Rest of North America
- 8.1. Market Analysis, Insights and Forecast - by Type
- 9. Rest of North America North America Flavored Milk Industry Analysis, Insights and Forecast, 2019-2031
- 9.1. Market Analysis, Insights and Forecast - by Type
- 9.1.1. Dairy Based
- 9.1.2. Plant Based
- 9.2. Market Analysis, Insights and Forecast - by Distribution Channel
- 9.2.1. Supermarkets/Hypermarkets
- 9.2.2. Convenience Stores
- 9.2.3. Specialist Stores
- 9.2.4. Online Retail Stores
- 9.2.5. Other Distribution Channels
- 9.3. Market Analysis, Insights and Forecast - by Geography
- 9.3.1. United States
- 9.3.2. Canada
- 9.3.3. Mexico
- 9.3.4. Rest of North America
- 9.1. Market Analysis, Insights and Forecast - by Type
- 10. United States North America Flavored Milk Industry Analysis, Insights and Forecast, 2019-2031
- 11. Canada North America Flavored Milk Industry Analysis, Insights and Forecast, 2019-2031
- 12. Mexico North America Flavored Milk Industry Analysis, Insights and Forecast, 2019-2031
- 13. Rest of North America North America Flavored Milk Industry Analysis, Insights and Forecast, 2019-2031
- 14. Competitive Analysis
- 14.1. Market Share Analysis 2024
- 14.2. Company Profiles
- 14.2.1 Nestle S A
- 14.2.1.1. Overview
- 14.2.1.2. Products
- 14.2.1.3. SWOT Analysis
- 14.2.1.4. Recent Developments
- 14.2.1.5. Financials (Based on Availability)
- 14.2.2 Oakhurst
- 14.2.2.1. Overview
- 14.2.2.2. Products
- 14.2.2.3. SWOT Analysis
- 14.2.2.4. Recent Developments
- 14.2.2.5. Financials (Based on Availability)
- 14.2.3 Dean Food Company
- 14.2.3.1. Overview
- 14.2.3.2. Products
- 14.2.3.3. SWOT Analysis
- 14.2.3.4. Recent Developments
- 14.2.3.5. Financials (Based on Availability)
- 14.2.4 Mondelz International
- 14.2.4.1. Overview
- 14.2.4.2. Products
- 14.2.4.3. SWOT Analysis
- 14.2.4.4. Recent Developments
- 14.2.4.5. Financials (Based on Availability)
- 14.2.5 Agropur Dairy Cooperative
- 14.2.5.1. Overview
- 14.2.5.2. Products
- 14.2.5.3. SWOT Analysis
- 14.2.5.4. Recent Developments
- 14.2.5.5. Financials (Based on Availability)
- 14.2.6 The Kraft Heinz Company
- 14.2.6.1. Overview
- 14.2.6.2. Products
- 14.2.6.3. SWOT Analysis
- 14.2.6.4. Recent Developments
- 14.2.6.5. Financials (Based on Availability)
- 14.2.7 Danone*List Not Exhaustive
- 14.2.7.1. Overview
- 14.2.7.2. Products
- 14.2.7.3. SWOT Analysis
- 14.2.7.4. Recent Developments
- 14.2.7.5. Financials (Based on Availability)
- 14.2.8 The Farmer's Cow
- 14.2.8.1. Overview
- 14.2.8.2. Products
- 14.2.8.3. SWOT Analysis
- 14.2.8.4. Recent Developments
- 14.2.8.5. Financials (Based on Availability)
- 14.2.9 Fairlife LLC
- 14.2.9.1. Overview
- 14.2.9.2. Products
- 14.2.9.3. SWOT Analysis
- 14.2.9.4. Recent Developments
- 14.2.9.5. Financials (Based on Availability)
- 14.2.10 Saputo Inc
- 14.2.10.1. Overview
- 14.2.10.2. Products
- 14.2.10.3. SWOT Analysis
- 14.2.10.4. Recent Developments
- 14.2.10.5. Financials (Based on Availability)
- 14.2.11 The Hershey Company
- 14.2.11.1. Overview
- 14.2.11.2. Products
- 14.2.11.3. SWOT Analysis
- 14.2.11.4. Recent Developments
- 14.2.11.5. Financials (Based on Availability)
- 14.2.1 Nestle S A
List of Figures
- Figure 1: North America Flavored Milk Industry Revenue Breakdown (Million, %) by Product 2024 & 2032
- Figure 2: North America Flavored Milk Industry Share (%) by Company 2024
List of Tables
- Table 1: North America Flavored Milk Industry Revenue Million Forecast, by Region 2019 & 2032
- Table 2: North America Flavored Milk Industry Revenue Million Forecast, by Type 2019 & 2032
- Table 3: North America Flavored Milk Industry Revenue Million Forecast, by Distribution Channel 2019 & 2032
- Table 4: North America Flavored Milk Industry Revenue Million Forecast, by Geography 2019 & 2032
- Table 5: North America Flavored Milk Industry Revenue Million Forecast, by Region 2019 & 2032
- Table 6: North America Flavored Milk Industry Revenue Million Forecast, by Country 2019 & 2032
- Table 7: United States North America Flavored Milk Industry Revenue (Million) Forecast, by Application 2019 & 2032
- Table 8: Canada North America Flavored Milk Industry Revenue (Million) Forecast, by Application 2019 & 2032
- Table 9: Mexico North America Flavored Milk Industry Revenue (Million) Forecast, by Application 2019 & 2032
- Table 10: Rest of North America North America Flavored Milk Industry Revenue (Million) Forecast, by Application 2019 & 2032
- Table 11: North America Flavored Milk Industry Revenue Million Forecast, by Type 2019 & 2032
- Table 12: North America Flavored Milk Industry Revenue Million Forecast, by Distribution Channel 2019 & 2032
- Table 13: North America Flavored Milk Industry Revenue Million Forecast, by Geography 2019 & 2032
- Table 14: North America Flavored Milk Industry Revenue Million Forecast, by Country 2019 & 2032
- Table 15: North America Flavored Milk Industry Revenue Million Forecast, by Type 2019 & 2032
- Table 16: North America Flavored Milk Industry Revenue Million Forecast, by Distribution Channel 2019 & 2032
- Table 17: North America Flavored Milk Industry Revenue Million Forecast, by Geography 2019 & 2032
- Table 18: North America Flavored Milk Industry Revenue Million Forecast, by Country 2019 & 2032
- Table 19: North America Flavored Milk Industry Revenue Million Forecast, by Type 2019 & 2032
- Table 20: North America Flavored Milk Industry Revenue Million Forecast, by Distribution Channel 2019 & 2032
- Table 21: North America Flavored Milk Industry Revenue Million Forecast, by Geography 2019 & 2032
- Table 22: North America Flavored Milk Industry Revenue Million Forecast, by Country 2019 & 2032
- Table 23: North America Flavored Milk Industry Revenue Million Forecast, by Type 2019 & 2032
- Table 24: North America Flavored Milk Industry Revenue Million Forecast, by Distribution Channel 2019 & 2032
- Table 25: North America Flavored Milk Industry Revenue Million Forecast, by Geography 2019 & 2032
- Table 26: North America Flavored Milk Industry Revenue Million Forecast, by Country 2019 & 2032
Frequently Asked Questions
1. What is the projected Compound Annual Growth Rate (CAGR) of the North America Flavored Milk Industry?
The projected CAGR is approximately 2.96%.
2. Which companies are prominent players in the North America Flavored Milk Industry?
Key companies in the market include Nestle S A, Oakhurst, Dean Food Company, Mondelz International, Agropur Dairy Cooperative, The Kraft Heinz Company, Danone*List Not Exhaustive, The Farmer's Cow, Fairlife LLC, Saputo Inc, The Hershey Company.
3. What are the main segments of the North America Flavored Milk Industry?
The market segments include Type, Distribution Channel, Geography.
4. Can you provide details about the market size?
The market size is estimated to be USD 121.18 Million as of 2022.
5. What are some drivers contributing to market growth?
Government Initiatives and E-commerce Penetration.
6. What are the notable trends driving market growth?
Surge In Demand For Fortified Milk Products.
7. Are there any restraints impacting market growth?
Detrimental Health Impact of Caffeine Intake.
8. Can you provide examples of recent developments in the market?
N/A
9. What pricing options are available for accessing the report?
Pricing options include single-user, multi-user, and enterprise licenses priced at USD 4750, USD 5250, and USD 8750 respectively.
10. Is the market size provided in terms of value or volume?
The market size is provided in terms of value, measured in Million.
11. Are there any specific market keywords associated with the report?
Yes, the market keyword associated with the report is "North America Flavored Milk Industry," which aids in identifying and referencing the specific market segment covered.
12. How do I determine which pricing option suits my needs best?
The pricing options vary based on user requirements and access needs. Individual users may opt for single-user licenses, while businesses requiring broader access may choose multi-user or enterprise licenses for cost-effective access to the report.
13. Are there any additional resources or data provided in the North America Flavored Milk Industry report?
While the report offers comprehensive insights, it's advisable to review the specific contents or supplementary materials provided to ascertain if additional resources or data are available.
14. How can I stay updated on further developments or reports in the North America Flavored Milk Industry?
To stay informed about further developments, trends, and reports in the North America Flavored Milk Industry, consider subscribing to industry newsletters, following relevant companies and organizations, or regularly checking reputable industry news sources and publications.
Methodology
Step 1 - Identification of Relevant Samples Size from Population Database


Step 2 - Approaches for Defining Global Market Size (Value, Volume* & Price*)

Note*: In applicable scenarios
Step 3 - Data Sources
Primary Research
- Web Analytics
- Survey Reports
- Research Institute
- Latest Research Reports
- Opinion Leaders
Secondary Research
- Annual Reports
- White Paper
- Latest Press Release
- Industry Association
- Paid Database
- Investor Presentations

Step 4 - Data Triangulation
Involves using different sources of information in order to increase the validity of a study
These sources are likely to be stakeholders in a program - participants, other researchers, program staff, other community members, and so on.
Then we put all data in single framework & apply various statistical tools to find out the dynamic on the market.
During the analysis stage, feedback from the stakeholder groups would be compared to determine areas of agreement as well as areas of divergence


