
Key Insights
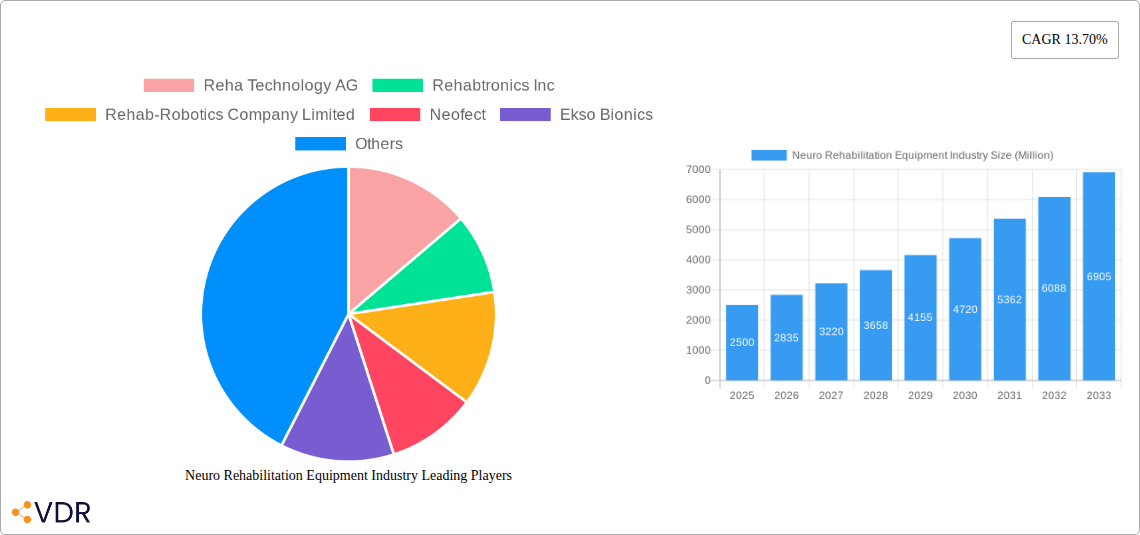
The neuro rehabilitation equipment market is experiencing robust growth, driven by the rising prevalence of neurological disorders like stroke, spinal cord injuries, and traumatic brain injuries, coupled with an aging global population. Technological advancements in neuro-robotic devices, wearable sensors, and non-invasive brain stimulation techniques are significantly enhancing rehabilitation outcomes and driving market expansion. The 13.70% CAGR indicates a substantial increase in market value from 2019 to 2024, with a projected continued growth over the forecast period (2025-2033). The market is segmented by product type (neuro-robotic devices, wearable devices, non-invasive stimulators, brain-computer interfaces) and end-user (hospitals/clinics, cognitive care centers, others). Neuro-robotic devices currently hold a significant market share due to their effectiveness in improving motor function, but the wearable devices segment is anticipated to experience rapid growth due to increasing demand for home-based rehabilitation solutions and advancements in sensor technology. Hospitals and clinics remain the largest end-users, although cognitive care centers are also demonstrating significant growth potential. Competition is dynamic with established players like Reha Technology AG and Ekso Bionics alongside emerging companies focusing on innovative technologies. Geographic variations exist, with North America and Europe holding substantial market shares due to well-established healthcare infrastructure and higher adoption rates of advanced technologies. However, Asia-Pacific is projected to show the fastest growth owing to increasing healthcare expenditure and rising prevalence of neurological disorders in developing economies. The market faces challenges such as high costs associated with advanced equipment, regulatory hurdles for new technologies, and a shortage of skilled professionals in the field.
The forecast for the neuro rehabilitation equipment market suggests continued strong growth, exceeding initial estimates. Factors influencing this projection include growing awareness of the benefits of neuro rehabilitation, increasing government initiatives to support healthcare infrastructure, and the emergence of tele-rehabilitation solutions further enhancing accessibility. Companies are focusing on developing personalized rehabilitation plans utilizing AI and machine learning, leading to improved patient outcomes and cost-effectiveness. Strategic partnerships, mergers, and acquisitions among major players are anticipated to reshape the competitive landscape in the coming years. Furthermore, the rising demand for minimally invasive and less expensive treatment options will influence the market trends and spur further innovation in non-invasive brain stimulation technologies. This trend of diversification in treatment options will likely lead to greater market penetration and broader accessibility of neurorehabilitation.
Neuro Rehabilitation Equipment Industry Market Report: 2019-2033
This comprehensive report provides a detailed analysis of the Neuro Rehabilitation Equipment market, encompassing market dynamics, growth trends, leading players, and future outlook. The study period spans from 2019 to 2033, with 2025 serving as the base and estimated year. The report segments the market by product type (Neuro-Robotic Devices, Wearable Devices, Non-Invasive Stimulators, Brain-Computer Interface) and end-user (Hospitals/Clinics, Cognitive Care Centers, Others), offering granular insights into various market facets. The report's findings are invaluable for industry professionals, investors, and strategic decision-makers seeking a thorough understanding of this rapidly evolving sector. The market size is projected to reach xx Million units by 2033.
Neuro Rehabilitation Equipment Industry Market Dynamics & Structure
The neuro rehabilitation equipment market is characterized by a moderately fragmented landscape, with several key players competing for market share. Market concentration is expected to increase slightly over the forecast period due to mergers and acquisitions (M&A) activity and the emergence of larger, more integrated companies. Technological innovation, driven by advancements in robotics, artificial intelligence (AI), and virtual reality (VR), plays a crucial role in shaping market dynamics. Stringent regulatory frameworks, particularly concerning medical device approvals, represent a significant barrier to market entry. The market also faces competition from alternative therapies, such as physical therapy and occupational therapy. Demographic trends, including an aging global population and rising prevalence of neurological disorders, are key growth drivers.
- Market Concentration: Moderately fragmented, trending towards consolidation. The top 5 players account for approximately xx% of the market share in 2025.
- Technological Innovation: AI, VR, and robotics are major drivers, leading to sophisticated and more effective rehabilitation solutions.
- Regulatory Frameworks: Stringent regulatory approvals (e.g., FDA, CE marking) pose entry barriers and influence product development timelines.
- Competitive Substitutes: Traditional therapies like physical and occupational therapy remain competitive alternatives.
- M&A Activity: A moderate level of M&A activity is observed, with larger companies seeking to expand their product portfolios and market reach. An estimated xx M&A deals occurred between 2019-2024.
- End-User Demographics: Aging population and increasing incidence of neurological diseases are primary market drivers.
Neuro Rehabilitation Equipment Industry Growth Trends & Insights
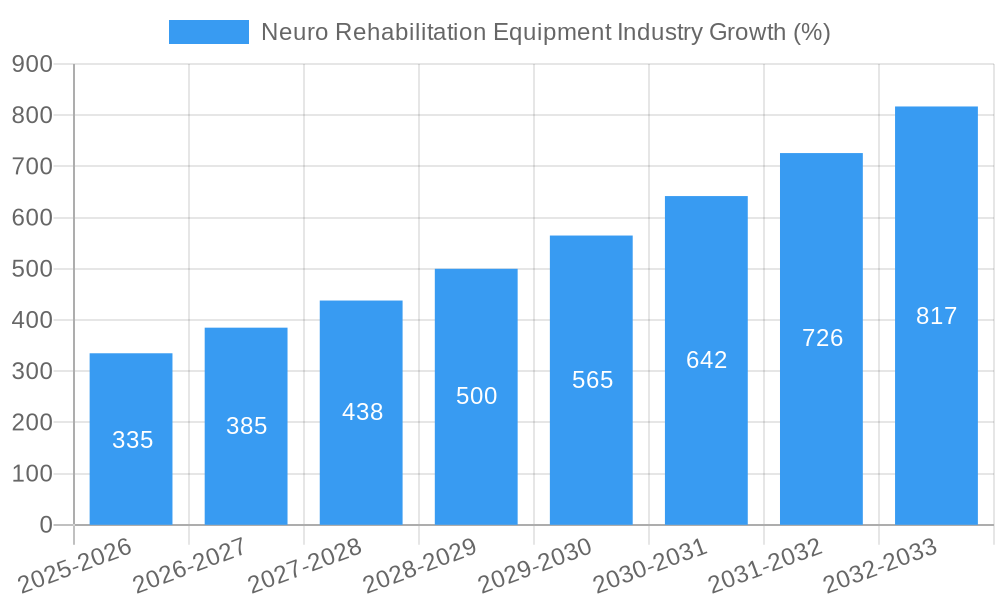
The neuro rehabilitation equipment market exhibits strong growth potential, driven by several factors. The market size increased from xx Million units in 2019 to xx Million units in 2024, reflecting a Compound Annual Growth Rate (CAGR) of xx%. This growth is fueled by technological advancements leading to improved treatment outcomes, increased adoption rates within healthcare facilities, and a rising awareness of neurorehabilitation benefits. Technological disruptions, such as the integration of AI and VR, are transforming the field, offering personalized and more engaging rehabilitation experiences. Consumer behavior is shifting towards more technologically advanced and convenient solutions, boosting the adoption of wearable and home-based rehabilitation devices.
The market penetration rate is expected to rise from xx% in 2024 to xx% by 2033, driven by increased awareness among healthcare professionals and patients. Factors like increasing healthcare expenditure, government initiatives promoting rehabilitation services, and rising insurance coverage further contribute to market expansion. However, high initial costs associated with some advanced technologies, along with reimbursement challenges in certain healthcare systems, act as constraints to market growth.
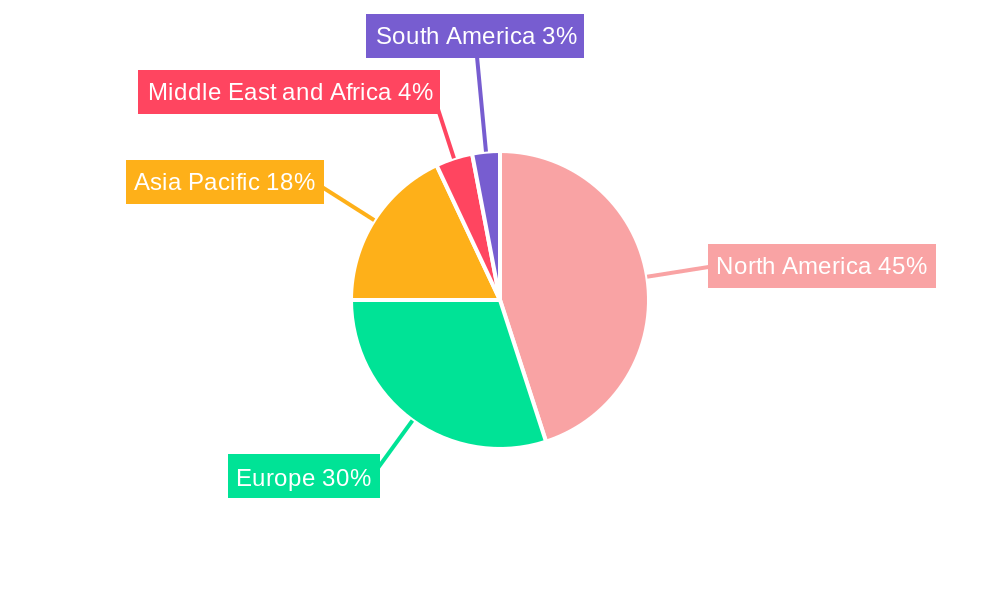
Dominant Regions, Countries, or Segments in Neuro Rehabilitation Equipment Industry
North America currently holds the largest market share in the neuro rehabilitation equipment industry, driven by factors like high healthcare spending, advanced medical infrastructure, and a significant number of specialized rehabilitation centers. Europe follows as a strong regional market, with robust healthcare systems and a growing adoption of technologically advanced rehabilitation solutions. Within the product segments, neuro-robotic devices command a significant portion of the market due to their potential for providing precise and customized rehabilitation. Hospitals and clinics constitute the largest end-user segment, owing to their established infrastructure and access to specialized professionals.
- North America: High healthcare expenditure, advanced infrastructure, and strong presence of key market players contribute to market leadership.
- Europe: Robust healthcare systems and rising adoption of advanced technologies drive growth.
- Asia-Pacific: Rapidly expanding healthcare sector and increasing prevalence of neurological disorders offer significant growth opportunities.
- Neuro-Robotic Devices: High demand due to their precision and effectiveness in targeted rehabilitation.
- Hospitals/Clinics: Large market share due to established infrastructure and specialized professionals.
Neuro Rehabilitation Equipment Industry Product Landscape
The neuro rehabilitation equipment market offers a diverse range of products, including neuro-robotic devices providing targeted motor skills training, wearable devices for convenient home-based rehabilitation, non-invasive stimulators for brain stimulation therapy, and brain-computer interfaces for restoring communication and motor control. Recent innovations emphasize user-friendly designs, personalized treatment plans, and integration of advanced technologies such as AI and VR for improved patient engagement and therapeutic efficacy. These advancements enhance treatment outcomes and patient experience, driving wider product adoption across various healthcare settings.
Key Drivers, Barriers & Challenges in Neuro Rehabilitation Equipment Industry
Key Drivers:
- Technological advancements in robotics, AI, and VR.
- Growing prevalence of neurological disorders and an aging population.
- Increasing healthcare expenditure and insurance coverage.
- Government initiatives and policies promoting rehabilitation services.
Challenges & Restraints:
- High initial costs of advanced equipment, limiting accessibility.
- Reimbursement challenges from insurance providers creating financial barriers.
- Stringent regulatory pathways for medical device approvals slowing down market entry.
- Competition from traditional therapies and emerging treatment modalities. This competition leads to price pressures and decreased profit margins for some players; it is estimated that this impact is approximately xx% of revenue lost for some industry participants.
Emerging Opportunities in Neuro Rehabilitation Equipment Industry
Emerging opportunities lie in personalized medicine, integrating AI to tailor rehabilitation programs to individual patient needs and providing data-driven insights for optimizing treatment. The expansion into home-based rehabilitation, utilizing wearable devices and telehealth platforms, offers significant potential for improving access to care, particularly in underserved communities. Furthermore, exploring innovative applications for virtual reality, such as immersive and engaging rehabilitation simulations, offers pathways for enhanced therapeutic outcomes.
Growth Accelerators in the Neuro Rehabilitation Equipment Industry
Long-term growth is fueled by breakthroughs in brain-computer interfaces, potentially revolutionizing the treatment of severe neurological conditions. Strategic collaborations between technology companies and healthcare providers will foster innovation and accelerate the adoption of advanced technologies. Expansion into emerging markets with growing healthcare budgets and a high prevalence of neurological diseases will drive substantial market growth.
Key Players Shaping the Neuro Rehabilitation Equipment Market
- Reha Technology AG
- Rehabtronics Inc
- Rehab-Robotics Company Limited
- Neofect
- Ekso Bionics
- Bionik Labs
- Eodyne Systems S L
- Hocoma AG
- Helius Medical Technologies
- Ectron Ltd
- ReWalk Robotics Ltd
- Abbott Laboratories (St Jude Medical Inc)
- Neuro Rehab VR
- MagVenture A/S
- List Not Exhaustive
Notable Milestones in Neuro Rehabilitation Equipment Industry Sector
- April 2022: Alliance Equiphoria initiated the "HippoPostCVA" clinical trial exploring the effectiveness of hippotherapy in post-stroke neurorehabilitation. This highlights the growing interest in exploring alternative therapeutic approaches in conjunction with technological advancements.
- February 2022: MindMaze secured USD 105 million in funding, demonstrating strong investor confidence in the digital neurotherapeutics market and underscoring the potential for growth within the sector.
In-Depth Neuro Rehabilitation Equipment Industry Market Outlook
The neuro rehabilitation equipment market is poised for sustained growth over the forecast period, driven by continuous technological advancements, expanding adoption rates, and a growing need for effective neurorehabilitation solutions. Strategic partnerships, market expansions into emerging economies, and personalized treatment approaches will further accelerate market expansion. The focus on cost-effectiveness and improved access will play a critical role in shaping the market's future trajectory, leading to innovative solutions and broader accessibility to neurorehabilitation technologies.
Neuro Rehabilitation Equipment Industry Segmentation
-
1. Product Type
- 1.1. Neuro-Robotic Devices
- 1.2. Wearable Devices
- 1.3. Non-Invasive Stimulators
- 1.4. Brain-Computer Interface
-
2. End-User
- 2.1. Hospitals/Clinics
- 2.2. Cognitive Care Centers
- 2.3. Others
Neuro Rehabilitation Equipment Industry Segmentation By Geography
-
1. North America
- 1.1. United States
- 1.2. Canada
- 1.3. Mexico
-
2. Europe
- 2.1. Germany
- 2.2. United Kingdom
- 2.3. France
- 2.4. Italy
- 2.5. Spain
- 2.6. Rest of Europe
-
3. Asia Pacific
- 3.1. China
- 3.2. Japan
- 3.3. India
- 3.4. Australia
- 3.5. South Korea
- 3.6. Rest of Asia Pacific
-
4. Middle East and Africa
- 4.1. GCC
- 4.2. South Africa
- 4.3. Rest of Middle East and Africa
-
5. South America
- 5.1. Brazil
- 5.2. Argentina
- 5.3. Rest of South America
Neuro Rehabilitation Equipment Industry REPORT HIGHLIGHTS
| Aspects | Details |
|---|---|
| Study Period | 2019-2033 |
| Base Year | 2024 |
| Estimated Year | 2025 |
| Forecast Period | 2025-2033 |
| Historical Period | 2019-2024 |
| Growth Rate | CAGR of 13.70% from 2019-2033 |
| Segmentation |
|
Table of Contents
- 1. Introduction
- 1.1. Research Scope
- 1.2. Market Segmentation
- 1.3. Research Methodology
- 1.4. Definitions and Assumptions
- 2. Executive Summary
- 2.1. Introduction
- 3. Market Dynamics
- 3.1. Introduction
- 3.2. Market Drivers
- 3.2.1. Rising Prevalence of Neurological Disorders; Technological Advancements in Neurorehabilitation Devices
- 3.3. Market Restrains
- 3.3.1. High Cost of the Neurorehabilitation Devices
- 3.4. Market Trends
- 3.4.1. Neuro-Robotic Devices Segment is Expected to Hold a Major Market Share in the Neurorehabilitation Devices Market
- 4. Market Factor Analysis
- 4.1. Porters Five Forces
- 4.2. Supply/Value Chain
- 4.3. PESTEL analysis
- 4.4. Market Entropy
- 4.5. Patent/Trademark Analysis
- 5. Global Neuro Rehabilitation Equipment Industry Analysis, Insights and Forecast, 2019-2031
- 5.1. Market Analysis, Insights and Forecast - by Product Type
- 5.1.1. Neuro-Robotic Devices
- 5.1.2. Wearable Devices
- 5.1.3. Non-Invasive Stimulators
- 5.1.4. Brain-Computer Interface
- 5.2. Market Analysis, Insights and Forecast - by End-User
- 5.2.1. Hospitals/Clinics
- 5.2.2. Cognitive Care Centers
- 5.2.3. Others
- 5.3. Market Analysis, Insights and Forecast - by Region
- 5.3.1. North America
- 5.3.2. Europe
- 5.3.3. Asia Pacific
- 5.3.4. Middle East and Africa
- 5.3.5. South America
- 5.1. Market Analysis, Insights and Forecast - by Product Type
- 6. North America Neuro Rehabilitation Equipment Industry Analysis, Insights and Forecast, 2019-2031
- 6.1. Market Analysis, Insights and Forecast - by Product Type
- 6.1.1. Neuro-Robotic Devices
- 6.1.2. Wearable Devices
- 6.1.3. Non-Invasive Stimulators
- 6.1.4. Brain-Computer Interface
- 6.2. Market Analysis, Insights and Forecast - by End-User
- 6.2.1. Hospitals/Clinics
- 6.2.2. Cognitive Care Centers
- 6.2.3. Others
- 6.1. Market Analysis, Insights and Forecast - by Product Type
- 7. Europe Neuro Rehabilitation Equipment Industry Analysis, Insights and Forecast, 2019-2031
- 7.1. Market Analysis, Insights and Forecast - by Product Type
- 7.1.1. Neuro-Robotic Devices
- 7.1.2. Wearable Devices
- 7.1.3. Non-Invasive Stimulators
- 7.1.4. Brain-Computer Interface
- 7.2. Market Analysis, Insights and Forecast - by End-User
- 7.2.1. Hospitals/Clinics
- 7.2.2. Cognitive Care Centers
- 7.2.3. Others
- 7.1. Market Analysis, Insights and Forecast - by Product Type
- 8. Asia Pacific Neuro Rehabilitation Equipment Industry Analysis, Insights and Forecast, 2019-2031
- 8.1. Market Analysis, Insights and Forecast - by Product Type
- 8.1.1. Neuro-Robotic Devices
- 8.1.2. Wearable Devices
- 8.1.3. Non-Invasive Stimulators
- 8.1.4. Brain-Computer Interface
- 8.2. Market Analysis, Insights and Forecast - by End-User
- 8.2.1. Hospitals/Clinics
- 8.2.2. Cognitive Care Centers
- 8.2.3. Others
- 8.1. Market Analysis, Insights and Forecast - by Product Type
- 9. Middle East and Africa Neuro Rehabilitation Equipment Industry Analysis, Insights and Forecast, 2019-2031
- 9.1. Market Analysis, Insights and Forecast - by Product Type
- 9.1.1. Neuro-Robotic Devices
- 9.1.2. Wearable Devices
- 9.1.3. Non-Invasive Stimulators
- 9.1.4. Brain-Computer Interface
- 9.2. Market Analysis, Insights and Forecast - by End-User
- 9.2.1. Hospitals/Clinics
- 9.2.2. Cognitive Care Centers
- 9.2.3. Others
- 9.1. Market Analysis, Insights and Forecast - by Product Type
- 10. South America Neuro Rehabilitation Equipment Industry Analysis, Insights and Forecast, 2019-2031
- 10.1. Market Analysis, Insights and Forecast - by Product Type
- 10.1.1. Neuro-Robotic Devices
- 10.1.2. Wearable Devices
- 10.1.3. Non-Invasive Stimulators
- 10.1.4. Brain-Computer Interface
- 10.2. Market Analysis, Insights and Forecast - by End-User
- 10.2.1. Hospitals/Clinics
- 10.2.2. Cognitive Care Centers
- 10.2.3. Others
- 10.1. Market Analysis, Insights and Forecast - by Product Type
- 11. North America Neuro Rehabilitation Equipment Industry Analysis, Insights and Forecast, 2019-2031
- 11.1. Market Analysis, Insights and Forecast - By Country/Sub-region
- 11.1.1 United States
- 11.1.2 Canada
- 11.1.3 Mexico
- 12. Europe Neuro Rehabilitation Equipment Industry Analysis, Insights and Forecast, 2019-2031
- 12.1. Market Analysis, Insights and Forecast - By Country/Sub-region
- 12.1.1 Germany
- 12.1.2 United Kingdom
- 12.1.3 France
- 12.1.4 Italy
- 12.1.5 Spain
- 12.1.6 Rest of Europe
- 13. Asia Pacific Neuro Rehabilitation Equipment Industry Analysis, Insights and Forecast, 2019-2031
- 13.1. Market Analysis, Insights and Forecast - By Country/Sub-region
- 13.1.1 China
- 13.1.2 Japan
- 13.1.3 India
- 13.1.4 Australia
- 13.1.5 South Korea
- 13.1.6 Rest of Asia Pacific
- 14. Middle East and Africa Neuro Rehabilitation Equipment Industry Analysis, Insights and Forecast, 2019-2031
- 14.1. Market Analysis, Insights and Forecast - By Country/Sub-region
- 14.1.1 GCC
- 14.1.2 South Africa
- 14.1.3 Rest of Middle East and Africa
- 15. South America Neuro Rehabilitation Equipment Industry Analysis, Insights and Forecast, 2019-2031
- 15.1. Market Analysis, Insights and Forecast - By Country/Sub-region
- 15.1.1 Brazil
- 15.1.2 Argentina
- 15.1.3 Rest of South America
- 16. Competitive Analysis
- 16.1. Global Market Share Analysis 2024
- 16.2. Company Profiles
- 16.2.1 Reha Technology AG
- 16.2.1.1. Overview
- 16.2.1.2. Products
- 16.2.1.3. SWOT Analysis
- 16.2.1.4. Recent Developments
- 16.2.1.5. Financials (Based on Availability)
- 16.2.2 Rehabtronics Inc
- 16.2.2.1. Overview
- 16.2.2.2. Products
- 16.2.2.3. SWOT Analysis
- 16.2.2.4. Recent Developments
- 16.2.2.5. Financials (Based on Availability)
- 16.2.3 Rehab-Robotics Company Limited
- 16.2.3.1. Overview
- 16.2.3.2. Products
- 16.2.3.3. SWOT Analysis
- 16.2.3.4. Recent Developments
- 16.2.3.5. Financials (Based on Availability)
- 16.2.4 Neofect
- 16.2.4.1. Overview
- 16.2.4.2. Products
- 16.2.4.3. SWOT Analysis
- 16.2.4.4. Recent Developments
- 16.2.4.5. Financials (Based on Availability)
- 16.2.5 Ekso Bionics
- 16.2.5.1. Overview
- 16.2.5.2. Products
- 16.2.5.3. SWOT Analysis
- 16.2.5.4. Recent Developments
- 16.2.5.5. Financials (Based on Availability)
- 16.2.6 Bionik Labs
- 16.2.6.1. Overview
- 16.2.6.2. Products
- 16.2.6.3. SWOT Analysis
- 16.2.6.4. Recent Developments
- 16.2.6.5. Financials (Based on Availability)
- 16.2.7 Eodyne Systems S L
- 16.2.7.1. Overview
- 16.2.7.2. Products
- 16.2.7.3. SWOT Analysis
- 16.2.7.4. Recent Developments
- 16.2.7.5. Financials (Based on Availability)
- 16.2.8 Hocoma AG
- 16.2.8.1. Overview
- 16.2.8.2. Products
- 16.2.8.3. SWOT Analysis
- 16.2.8.4. Recent Developments
- 16.2.8.5. Financials (Based on Availability)
- 16.2.9 Helius Medical Technologies
- 16.2.9.1. Overview
- 16.2.9.2. Products
- 16.2.9.3. SWOT Analysis
- 16.2.9.4. Recent Developments
- 16.2.9.5. Financials (Based on Availability)
- 16.2.10 Ectron Ltd
- 16.2.10.1. Overview
- 16.2.10.2. Products
- 16.2.10.3. SWOT Analysis
- 16.2.10.4. Recent Developments
- 16.2.10.5. Financials (Based on Availability)
- 16.2.11 ReWalk Robotics Ltd *List Not Exhaustive
- 16.2.11.1. Overview
- 16.2.11.2. Products
- 16.2.11.3. SWOT Analysis
- 16.2.11.4. Recent Developments
- 16.2.11.5. Financials (Based on Availability)
- 16.2.12 Abbott Laboratories (St Jude Medical Inc)
- 16.2.12.1. Overview
- 16.2.12.2. Products
- 16.2.12.3. SWOT Analysis
- 16.2.12.4. Recent Developments
- 16.2.12.5. Financials (Based on Availability)
- 16.2.13 Neuro Rehab VR
- 16.2.13.1. Overview
- 16.2.13.2. Products
- 16.2.13.3. SWOT Analysis
- 16.2.13.4. Recent Developments
- 16.2.13.5. Financials (Based on Availability)
- 16.2.14 MagVenture A/S
- 16.2.14.1. Overview
- 16.2.14.2. Products
- 16.2.14.3. SWOT Analysis
- 16.2.14.4. Recent Developments
- 16.2.14.5. Financials (Based on Availability)
- 16.2.1 Reha Technology AG
List of Figures
- Figure 1: Global Neuro Rehabilitation Equipment Industry Revenue Breakdown (Million, %) by Region 2024 & 2032
- Figure 2: North America Neuro Rehabilitation Equipment Industry Revenue (Million), by Country 2024 & 2032
- Figure 3: North America Neuro Rehabilitation Equipment Industry Revenue Share (%), by Country 2024 & 2032
- Figure 4: Europe Neuro Rehabilitation Equipment Industry Revenue (Million), by Country 2024 & 2032
- Figure 5: Europe Neuro Rehabilitation Equipment Industry Revenue Share (%), by Country 2024 & 2032
- Figure 6: Asia Pacific Neuro Rehabilitation Equipment Industry Revenue (Million), by Country 2024 & 2032
- Figure 7: Asia Pacific Neuro Rehabilitation Equipment Industry Revenue Share (%), by Country 2024 & 2032
- Figure 8: Middle East and Africa Neuro Rehabilitation Equipment Industry Revenue (Million), by Country 2024 & 2032
- Figure 9: Middle East and Africa Neuro Rehabilitation Equipment Industry Revenue Share (%), by Country 2024 & 2032
- Figure 10: South America Neuro Rehabilitation Equipment Industry Revenue (Million), by Country 2024 & 2032
- Figure 11: South America Neuro Rehabilitation Equipment Industry Revenue Share (%), by Country 2024 & 2032
- Figure 12: North America Neuro Rehabilitation Equipment Industry Revenue (Million), by Product Type 2024 & 2032
- Figure 13: North America Neuro Rehabilitation Equipment Industry Revenue Share (%), by Product Type 2024 & 2032
- Figure 14: North America Neuro Rehabilitation Equipment Industry Revenue (Million), by End-User 2024 & 2032
- Figure 15: North America Neuro Rehabilitation Equipment Industry Revenue Share (%), by End-User 2024 & 2032
- Figure 16: North America Neuro Rehabilitation Equipment Industry Revenue (Million), by Country 2024 & 2032
- Figure 17: North America Neuro Rehabilitation Equipment Industry Revenue Share (%), by Country 2024 & 2032
- Figure 18: Europe Neuro Rehabilitation Equipment Industry Revenue (Million), by Product Type 2024 & 2032
- Figure 19: Europe Neuro Rehabilitation Equipment Industry Revenue Share (%), by Product Type 2024 & 2032
- Figure 20: Europe Neuro Rehabilitation Equipment Industry Revenue (Million), by End-User 2024 & 2032
- Figure 21: Europe Neuro Rehabilitation Equipment Industry Revenue Share (%), by End-User 2024 & 2032
- Figure 22: Europe Neuro Rehabilitation Equipment Industry Revenue (Million), by Country 2024 & 2032
- Figure 23: Europe Neuro Rehabilitation Equipment Industry Revenue Share (%), by Country 2024 & 2032
- Figure 24: Asia Pacific Neuro Rehabilitation Equipment Industry Revenue (Million), by Product Type 2024 & 2032
- Figure 25: Asia Pacific Neuro Rehabilitation Equipment Industry Revenue Share (%), by Product Type 2024 & 2032
- Figure 26: Asia Pacific Neuro Rehabilitation Equipment Industry Revenue (Million), by End-User 2024 & 2032
- Figure 27: Asia Pacific Neuro Rehabilitation Equipment Industry Revenue Share (%), by End-User 2024 & 2032
- Figure 28: Asia Pacific Neuro Rehabilitation Equipment Industry Revenue (Million), by Country 2024 & 2032
- Figure 29: Asia Pacific Neuro Rehabilitation Equipment Industry Revenue Share (%), by Country 2024 & 2032
- Figure 30: Middle East and Africa Neuro Rehabilitation Equipment Industry Revenue (Million), by Product Type 2024 & 2032
- Figure 31: Middle East and Africa Neuro Rehabilitation Equipment Industry Revenue Share (%), by Product Type 2024 & 2032
- Figure 32: Middle East and Africa Neuro Rehabilitation Equipment Industry Revenue (Million), by End-User 2024 & 2032
- Figure 33: Middle East and Africa Neuro Rehabilitation Equipment Industry Revenue Share (%), by End-User 2024 & 2032
- Figure 34: Middle East and Africa Neuro Rehabilitation Equipment Industry Revenue (Million), by Country 2024 & 2032
- Figure 35: Middle East and Africa Neuro Rehabilitation Equipment Industry Revenue Share (%), by Country 2024 & 2032
- Figure 36: South America Neuro Rehabilitation Equipment Industry Revenue (Million), by Product Type 2024 & 2032
- Figure 37: South America Neuro Rehabilitation Equipment Industry Revenue Share (%), by Product Type 2024 & 2032
- Figure 38: South America Neuro Rehabilitation Equipment Industry Revenue (Million), by End-User 2024 & 2032
- Figure 39: South America Neuro Rehabilitation Equipment Industry Revenue Share (%), by End-User 2024 & 2032
- Figure 40: South America Neuro Rehabilitation Equipment Industry Revenue (Million), by Country 2024 & 2032
- Figure 41: South America Neuro Rehabilitation Equipment Industry Revenue Share (%), by Country 2024 & 2032
List of Tables
- Table 1: Global Neuro Rehabilitation Equipment Industry Revenue Million Forecast, by Region 2019 & 2032
- Table 2: Global Neuro Rehabilitation Equipment Industry Revenue Million Forecast, by Product Type 2019 & 2032
- Table 3: Global Neuro Rehabilitation Equipment Industry Revenue Million Forecast, by End-User 2019 & 2032
- Table 4: Global Neuro Rehabilitation Equipment Industry Revenue Million Forecast, by Region 2019 & 2032
- Table 5: Global Neuro Rehabilitation Equipment Industry Revenue Million Forecast, by Country 2019 & 2032
- Table 6: United States Neuro Rehabilitation Equipment Industry Revenue (Million) Forecast, by Application 2019 & 2032
- Table 7: Canada Neuro Rehabilitation Equipment Industry Revenue (Million) Forecast, by Application 2019 & 2032
- Table 8: Mexico Neuro Rehabilitation Equipment Industry Revenue (Million) Forecast, by Application 2019 & 2032
- Table 9: Global Neuro Rehabilitation Equipment Industry Revenue Million Forecast, by Country 2019 & 2032
- Table 10: Germany Neuro Rehabilitation Equipment Industry Revenue (Million) Forecast, by Application 2019 & 2032
- Table 11: United Kingdom Neuro Rehabilitation Equipment Industry Revenue (Million) Forecast, by Application 2019 & 2032
- Table 12: France Neuro Rehabilitation Equipment Industry Revenue (Million) Forecast, by Application 2019 & 2032
- Table 13: Italy Neuro Rehabilitation Equipment Industry Revenue (Million) Forecast, by Application 2019 & 2032
- Table 14: Spain Neuro Rehabilitation Equipment Industry Revenue (Million) Forecast, by Application 2019 & 2032
- Table 15: Rest of Europe Neuro Rehabilitation Equipment Industry Revenue (Million) Forecast, by Application 2019 & 2032
- Table 16: Global Neuro Rehabilitation Equipment Industry Revenue Million Forecast, by Country 2019 & 2032
- Table 17: China Neuro Rehabilitation Equipment Industry Revenue (Million) Forecast, by Application 2019 & 2032
- Table 18: Japan Neuro Rehabilitation Equipment Industry Revenue (Million) Forecast, by Application 2019 & 2032
- Table 19: India Neuro Rehabilitation Equipment Industry Revenue (Million) Forecast, by Application 2019 & 2032
- Table 20: Australia Neuro Rehabilitation Equipment Industry Revenue (Million) Forecast, by Application 2019 & 2032
- Table 21: South Korea Neuro Rehabilitation Equipment Industry Revenue (Million) Forecast, by Application 2019 & 2032
- Table 22: Rest of Asia Pacific Neuro Rehabilitation Equipment Industry Revenue (Million) Forecast, by Application 2019 & 2032
- Table 23: Global Neuro Rehabilitation Equipment Industry Revenue Million Forecast, by Country 2019 & 2032
- Table 24: GCC Neuro Rehabilitation Equipment Industry Revenue (Million) Forecast, by Application 2019 & 2032
- Table 25: South Africa Neuro Rehabilitation Equipment Industry Revenue (Million) Forecast, by Application 2019 & 2032
- Table 26: Rest of Middle East and Africa Neuro Rehabilitation Equipment Industry Revenue (Million) Forecast, by Application 2019 & 2032
- Table 27: Global Neuro Rehabilitation Equipment Industry Revenue Million Forecast, by Country 2019 & 2032
- Table 28: Brazil Neuro Rehabilitation Equipment Industry Revenue (Million) Forecast, by Application 2019 & 2032
- Table 29: Argentina Neuro Rehabilitation Equipment Industry Revenue (Million) Forecast, by Application 2019 & 2032
- Table 30: Rest of South America Neuro Rehabilitation Equipment Industry Revenue (Million) Forecast, by Application 2019 & 2032
- Table 31: Global Neuro Rehabilitation Equipment Industry Revenue Million Forecast, by Product Type 2019 & 2032
- Table 32: Global Neuro Rehabilitation Equipment Industry Revenue Million Forecast, by End-User 2019 & 2032
- Table 33: Global Neuro Rehabilitation Equipment Industry Revenue Million Forecast, by Country 2019 & 2032
- Table 34: United States Neuro Rehabilitation Equipment Industry Revenue (Million) Forecast, by Application 2019 & 2032
- Table 35: Canada Neuro Rehabilitation Equipment Industry Revenue (Million) Forecast, by Application 2019 & 2032
- Table 36: Mexico Neuro Rehabilitation Equipment Industry Revenue (Million) Forecast, by Application 2019 & 2032
- Table 37: Global Neuro Rehabilitation Equipment Industry Revenue Million Forecast, by Product Type 2019 & 2032
- Table 38: Global Neuro Rehabilitation Equipment Industry Revenue Million Forecast, by End-User 2019 & 2032
- Table 39: Global Neuro Rehabilitation Equipment Industry Revenue Million Forecast, by Country 2019 & 2032
- Table 40: Germany Neuro Rehabilitation Equipment Industry Revenue (Million) Forecast, by Application 2019 & 2032
- Table 41: United Kingdom Neuro Rehabilitation Equipment Industry Revenue (Million) Forecast, by Application 2019 & 2032
- Table 42: France Neuro Rehabilitation Equipment Industry Revenue (Million) Forecast, by Application 2019 & 2032
- Table 43: Italy Neuro Rehabilitation Equipment Industry Revenue (Million) Forecast, by Application 2019 & 2032
- Table 44: Spain Neuro Rehabilitation Equipment Industry Revenue (Million) Forecast, by Application 2019 & 2032
- Table 45: Rest of Europe Neuro Rehabilitation Equipment Industry Revenue (Million) Forecast, by Application 2019 & 2032
- Table 46: Global Neuro Rehabilitation Equipment Industry Revenue Million Forecast, by Product Type 2019 & 2032
- Table 47: Global Neuro Rehabilitation Equipment Industry Revenue Million Forecast, by End-User 2019 & 2032
- Table 48: Global Neuro Rehabilitation Equipment Industry Revenue Million Forecast, by Country 2019 & 2032
- Table 49: China Neuro Rehabilitation Equipment Industry Revenue (Million) Forecast, by Application 2019 & 2032
- Table 50: Japan Neuro Rehabilitation Equipment Industry Revenue (Million) Forecast, by Application 2019 & 2032
- Table 51: India Neuro Rehabilitation Equipment Industry Revenue (Million) Forecast, by Application 2019 & 2032
- Table 52: Australia Neuro Rehabilitation Equipment Industry Revenue (Million) Forecast, by Application 2019 & 2032
- Table 53: South Korea Neuro Rehabilitation Equipment Industry Revenue (Million) Forecast, by Application 2019 & 2032
- Table 54: Rest of Asia Pacific Neuro Rehabilitation Equipment Industry Revenue (Million) Forecast, by Application 2019 & 2032
- Table 55: Global Neuro Rehabilitation Equipment Industry Revenue Million Forecast, by Product Type 2019 & 2032
- Table 56: Global Neuro Rehabilitation Equipment Industry Revenue Million Forecast, by End-User 2019 & 2032
- Table 57: Global Neuro Rehabilitation Equipment Industry Revenue Million Forecast, by Country 2019 & 2032
- Table 58: GCC Neuro Rehabilitation Equipment Industry Revenue (Million) Forecast, by Application 2019 & 2032
- Table 59: South Africa Neuro Rehabilitation Equipment Industry Revenue (Million) Forecast, by Application 2019 & 2032
- Table 60: Rest of Middle East and Africa Neuro Rehabilitation Equipment Industry Revenue (Million) Forecast, by Application 2019 & 2032
- Table 61: Global Neuro Rehabilitation Equipment Industry Revenue Million Forecast, by Product Type 2019 & 2032
- Table 62: Global Neuro Rehabilitation Equipment Industry Revenue Million Forecast, by End-User 2019 & 2032
- Table 63: Global Neuro Rehabilitation Equipment Industry Revenue Million Forecast, by Country 2019 & 2032
- Table 64: Brazil Neuro Rehabilitation Equipment Industry Revenue (Million) Forecast, by Application 2019 & 2032
- Table 65: Argentina Neuro Rehabilitation Equipment Industry Revenue (Million) Forecast, by Application 2019 & 2032
- Table 66: Rest of South America Neuro Rehabilitation Equipment Industry Revenue (Million) Forecast, by Application 2019 & 2032
Frequently Asked Questions
1. What is the projected Compound Annual Growth Rate (CAGR) of the Neuro Rehabilitation Equipment Industry?
The projected CAGR is approximately 13.70%.
2. Which companies are prominent players in the Neuro Rehabilitation Equipment Industry?
Key companies in the market include Reha Technology AG, Rehabtronics Inc, Rehab-Robotics Company Limited, Neofect, Ekso Bionics, Bionik Labs, Eodyne Systems S L, Hocoma AG, Helius Medical Technologies, Ectron Ltd, ReWalk Robotics Ltd *List Not Exhaustive, Abbott Laboratories (St Jude Medical Inc), Neuro Rehab VR, MagVenture A/S.
3. What are the main segments of the Neuro Rehabilitation Equipment Industry?
The market segments include Product Type, End-User.
4. Can you provide details about the market size?
The market size is estimated to be USD XX Million as of 2022.
5. What are some drivers contributing to market growth?
Rising Prevalence of Neurological Disorders; Technological Advancements in Neurorehabilitation Devices.
6. What are the notable trends driving market growth?
Neuro-Robotic Devices Segment is Expected to Hold a Major Market Share in the Neurorehabilitation Devices Market.
7. Are there any restraints impacting market growth?
High Cost of the Neurorehabilitation Devices.
8. Can you provide examples of recent developments in the market?
April 2022: Alliance Equiphoria sponsored a clinical trial under the title "Neurorehabilitation Through Hippotherapy of a Brain Stroke (HippoPostCVA)" to evaluate and analyze the effect of a hippotherapy program of several cycles delivered during 22 weeks in total on the functional and global evolution of post-stroke patients (with a score of Ranking 3 at inclusion) during the outpatient rehabilitation phase.
9. What pricing options are available for accessing the report?
Pricing options include single-user, multi-user, and enterprise licenses priced at USD 4750, USD 5250, and USD 8750 respectively.
10. Is the market size provided in terms of value or volume?
The market size is provided in terms of value, measured in Million.
11. Are there any specific market keywords associated with the report?
Yes, the market keyword associated with the report is "Neuro Rehabilitation Equipment Industry," which aids in identifying and referencing the specific market segment covered.
12. How do I determine which pricing option suits my needs best?
The pricing options vary based on user requirements and access needs. Individual users may opt for single-user licenses, while businesses requiring broader access may choose multi-user or enterprise licenses for cost-effective access to the report.
13. Are there any additional resources or data provided in the Neuro Rehabilitation Equipment Industry report?
While the report offers comprehensive insights, it's advisable to review the specific contents or supplementary materials provided to ascertain if additional resources or data are available.
14. How can I stay updated on further developments or reports in the Neuro Rehabilitation Equipment Industry?
To stay informed about further developments, trends, and reports in the Neuro Rehabilitation Equipment Industry, consider subscribing to industry newsletters, following relevant companies and organizations, or regularly checking reputable industry news sources and publications.
Methodology
Step 1 - Identification of Relevant Samples Size from Population Database


Step 2 - Approaches for Defining Global Market Size (Value, Volume* & Price*)

Note*: In applicable scenarios
Step 3 - Data Sources
Primary Research
- Web Analytics
- Survey Reports
- Research Institute
- Latest Research Reports
- Opinion Leaders
Secondary Research
- Annual Reports
- White Paper
- Latest Press Release
- Industry Association
- Paid Database
- Investor Presentations

Step 4 - Data Triangulation
Involves using different sources of information in order to increase the validity of a study
These sources are likely to be stakeholders in a program - participants, other researchers, program staff, other community members, and so on.
Then we put all data in single framework & apply various statistical tools to find out the dynamic on the market.
During the analysis stage, feedback from the stakeholder groups would be compared to determine areas of agreement as well as areas of divergence


