
Key Insights
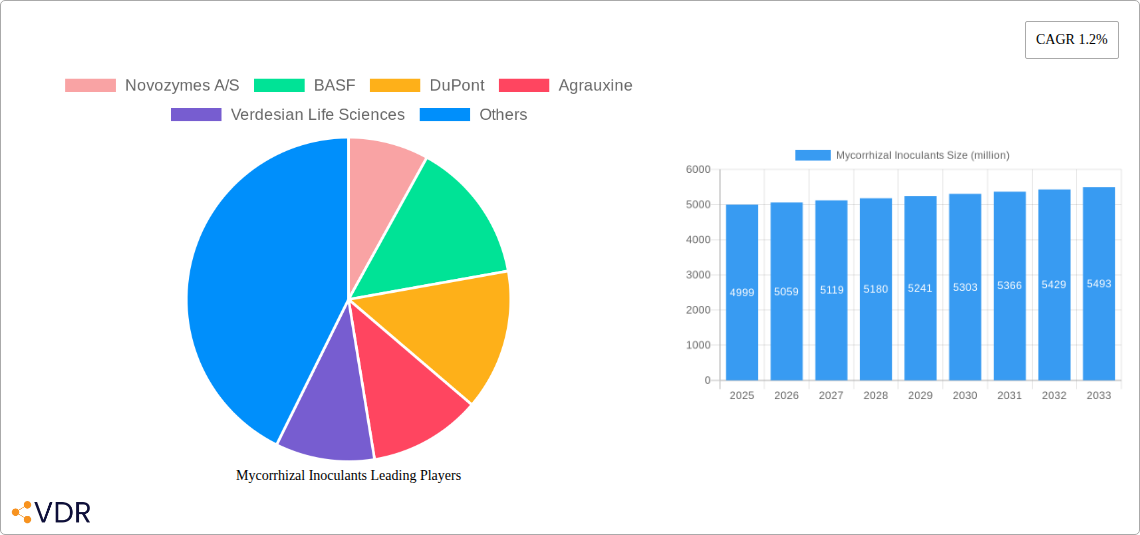
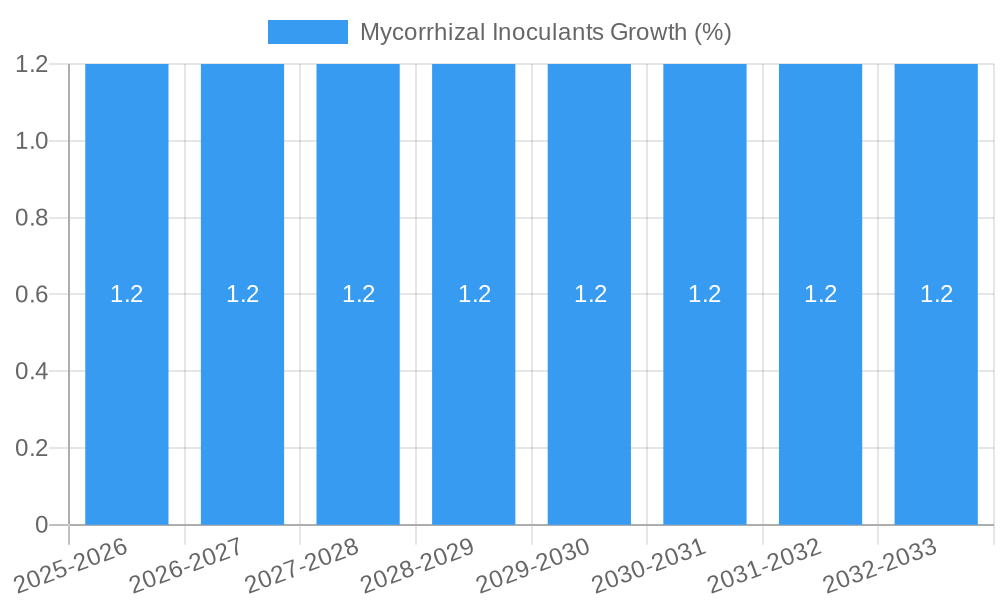
The global Mycorrhizal Inoculants market is projected to reach a substantial size, driven by the increasing demand for sustainable agricultural practices and the recognition of their profound benefits in enhancing crop yield and plant health. With a current market size of approximately $4,999 million in 2025, the market is set to witness steady but moderate growth at a Compound Annual Growth Rate (CAGR) of 1.2% throughout the forecast period of 2025-2033. This growth, while modest, reflects the mature stage of some segments and the ongoing efforts to overcome adoption barriers in certain regions. The primary drivers for this market expansion include the escalating global population, necessitating increased food production with reduced environmental impact, and the growing consumer preference for organic and sustainably produced food. Mycorrhizal inoculants, by improving nutrient uptake (especially phosphorus and nitrogen), enhancing drought tolerance, and reducing the need for synthetic fertilizers and pesticides, directly address these critical agricultural challenges. Furthermore, government initiatives promoting eco-friendly farming and subsidies for bio-fertilizer use are acting as significant catalysts.
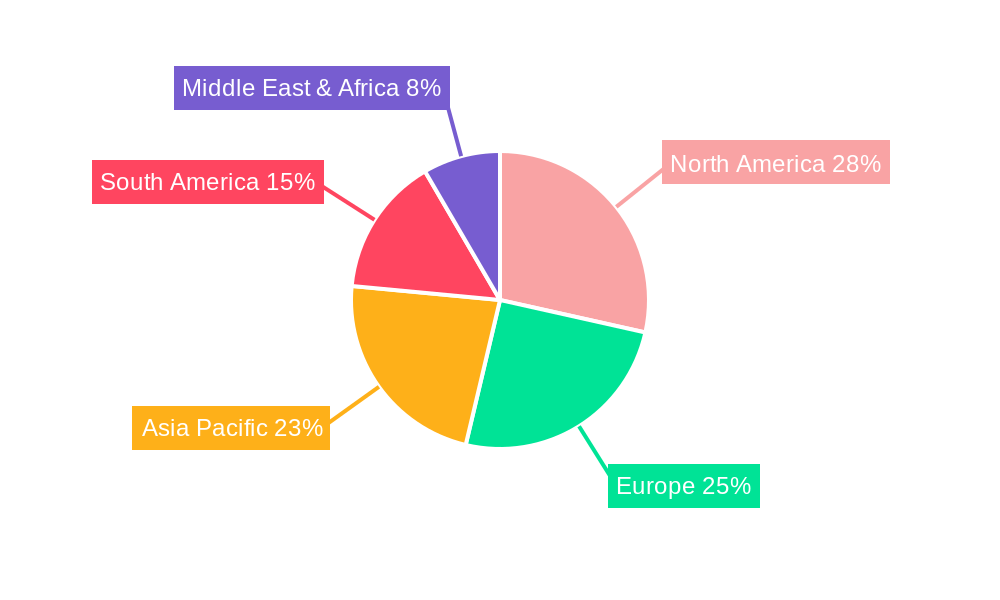
The market segmentation offers a comprehensive view of its diverse applications and product forms. The "Oilseeds and Pulses" segment is anticipated to hold a significant share due to the inherent nitrogen-fixing capabilities amplified by mycorrhizal associations. Similarly, "Cereals" and "Fruits and Vegetables" are substantial segments, benefiting from improved growth and stress resilience. The "Other" applications will encompass niche markets and emerging uses. In terms of types, both "Liquid" and "Dry Preparation" formulations are vital, catering to different application methods and farmer preferences. The liquid form offers ease of application and rapid colonization, while dry formulations provide extended shelf life and compatibility with seed coatings. Leading companies such as Novozymes A/S, BASF, DuPont, and Bayer are at the forefront of innovation, developing advanced inoculant technologies and expanding their market reach. Geographically, North America and Europe are mature markets with high adoption rates, while Asia Pacific, particularly China and India, presents the most significant growth potential due to large agricultural bases and increasing awareness of biological solutions.
This report offers an in-depth analysis of the global Mycorrhizal Inoculants market, providing critical insights for industry stakeholders. Covering the historical period from 2019 to 2024 and projecting growth through 2033, with a base and estimated year of 2025, this comprehensive study delves into market dynamics, growth trends, regional dominance, product innovation, key drivers, barriers, emerging opportunities, growth accelerators, key players, notable milestones, and a conclusive market outlook. With a focus on both parent and child markets, this report leverages high-traffic keywords to maximize search engine visibility for professionals in agriculture, biotechnology, and sustainable farming.
Mycorrhizal Inoculants Market Dynamics & Structure
The global Mycorrhizal Inoculants market exhibits a moderately concentrated structure, with a few key players holding significant market share, alongside a growing number of specialized and regional manufacturers. Technological innovation is primarily driven by advancements in microbial strain selection, fermentation technologies, and formulation techniques that enhance shelf-life and efficacy. Regulatory frameworks are evolving, with increasing emphasis on biological inputs and sustainable agriculture practices, particularly in North America and Europe. Competitive product substitutes include synthetic fertilizers and other biostimulants, though mycorrhizal inoculants offer distinct benefits in nutrient uptake and plant resilience. End-user demographics are shifting towards a younger generation of farmers and horticulture professionals embracing precision agriculture and eco-friendly solutions. Merger & Acquisition (M&A) trends are observed as larger agricultural input companies seek to expand their bio-solutions portfolios, indicated by approximately 15-20 M&A deals annually in the broader bio-fertilizer and biostimulant space during the historical period. Innovation barriers include the long lead times for product development and field validation, the need for consistent microbial viability, and consumer education regarding the benefits of these biological inputs.
- Market Concentration: Moderate to High, with significant presence of global players and emerging regional specialists.
- Technological Innovation Drivers: Enhanced microbial strain discovery, advanced fermentation processes, improved delivery systems.
- Regulatory Landscape: Increasingly favorable towards biological inputs, supporting sustainable agriculture initiatives.
- Competitive Landscape: Dominated by synthetic fertilizers, but with growing competition from other biostimulants.
- End-User Profile: Rising adoption by progressive farmers, organic growers, and the horticulture sector.
- M&A Activity: Consistent activity, driven by consolidation and portfolio expansion in the bio-solutions sector.
- Innovation Barriers: R&D investment, shelf-life optimization, market acceptance, and farmer education.
Mycorrhizal Inoculants Growth Trends & Insights
The Mycorrhizal Inoculants market is poised for robust growth, driven by the escalating demand for sustainable agricultural practices and the inherent benefits of these beneficial fungi. Market size is projected to expand from an estimated $550 million in 2024 to over $1.2 billion by 2033, exhibiting a Compound Annual Growth Rate (CAGR) of approximately 9-11% during the forecast period. Adoption rates are steadily increasing as farmers recognize the potential of mycorrhizal inoculants to enhance crop yields, improve nutrient utilization (especially phosphorus and nitrogen), and increase plant tolerance to biotic and abiotic stresses. Technological disruptions, such as the development of more resilient and application-specific microbial strains and advanced liquid and dry formulations, are further accelerating market penetration. Consumer behavior shifts, influenced by growing awareness of environmental issues and a desire for healthier food products, are compelling growers to seek out sustainable input solutions. The market penetration of mycorrhizal inoculants, currently estimated at around 15% in key developed agricultural economies, is expected to rise significantly. This growth is further fueled by government initiatives promoting organic farming and reducing reliance on synthetic chemicals. The increasing focus on soil health as a critical component of modern agriculture is a major underpinning of this upward trajectory, making mycorrhizal inoculants a cornerstone of regenerative farming systems.
Dominant Regions, Countries, or Segments in Mycorrhizal Inoculants
The Fruits and Vegetables segment, within the Application category, is emerging as a dominant force in the global Mycorrhizal Inoculants market. This segment is projected to account for approximately 35-40% of the total market revenue by 2033. The high value of specialty crops, coupled with the growing demand for premium quality and residue-free produce, incentivizes growers to adopt advanced biological inputs that enhance plant health and fruit development. Furthermore, the Liquid Preparation type is witnessing substantial growth, driven by its ease of application, precise dosing capabilities, and enhanced bioavailability of mycorrhizal spores. This segment is expected to capture around 55-60% of the market share by the forecast end-year.
Key drivers for the dominance of Fruits and Vegetables and Liquid Preparations include:
- Economic Policies: Government subsidies and incentives supporting organic farming and the adoption of sustainable agricultural inputs in major fruit and vegetable producing nations.
- Infrastructure: Development of specialized application equipment for liquid inoculants, facilitating widespread adoption in intensive farming systems.
- Consumer Demand: Increasing consumer preference for organically grown and high-quality fruits and vegetables, leading growers to invest in solutions that improve crop quality and yield.
- Technological Advancements: Continuous innovation in liquid formulation technologies ensuring higher spore viability and efficacy in diverse environmental conditions.
- Market Share & Growth Potential: The high-value nature of fruits and vegetables allows for greater investment in advanced inputs, while the ease of use of liquid inoculants ensures broader accessibility and adoption across various scales of farming operations. The market is estimated to see a CAGR of over 12% for the Fruits and Vegetables segment during the forecast period.
Mycorrhizal Inoculants Product Landscape
The Mycorrhizal Inoculants product landscape is characterized by continuous innovation focused on enhancing microbial efficacy and application convenience. Innovations include the development of highly specific endomycorrhizal and ectomycorrhizal strains tailored to particular crop types and soil conditions, as well as symbiotic formulations combining mycorrhizae with other beneficial microbes like plant growth-promoting rhizobacteria (PGPR). Advanced encapsulation and coating technologies are improving the shelf-life and field performance of dry inoculants, while novel liquid formulations offer superior spore dispersion and root colonization. Unique selling propositions center on improved nutrient uptake efficiency (particularly phosphorus), enhanced drought and stress tolerance, and reduced reliance on synthetic fertilizers.
Key Drivers, Barriers & Challenges in Mycorrhizal Inoculants
Key Drivers:
- Growing Demand for Sustainable Agriculture: Increasing global focus on eco-friendly farming methods and reduced chemical inputs.
- Enhancement of Crop Yields and Quality: Proven benefits in improving nutrient absorption, plant vigor, and resilience.
- Government Support and Regulations: Favorable policies promoting organic and biological farming practices worldwide.
- Technological Advancements: Development of more effective and stable microbial formulations.
- Soil Health Awareness: Recognition of mycorrhizae's role in improving soil structure and microbial diversity.
Barriers & Challenges:
- Farmer Education and Awareness: Overcoming skepticism and lack of knowledge regarding biological inputs.
- Shelf-Life and Viability Concerns: Ensuring consistent microbial efficacy from production to application.
- Cost-Effectiveness Perception: Demonstrating a clear return on investment compared to traditional inputs.
- Regulatory Hurdles: Navigating diverse and evolving registration processes in different regions.
- Supply Chain Complexity: Maintaining the integrity of biological products during transportation and storage. The estimated impact of these challenges could lead to a potential loss of 5-8% in market penetration if not adequately addressed.
Emerging Opportunities in Mycorrhizal Inoculants
Emerging opportunities in the Mycorrhizal Inoculants market lie in the expansion into urban agriculture and vertical farming, where controlled environments can optimize the performance of these bio-fertilizers. The development of customized inoculant blends for specific crop rotations and regional soil types presents a significant untapped market. Furthermore, the integration of mycorrhizal inoculants into precision agriculture technologies, such as sensor-based nutrient management, offers innovative application pathways. Growing consumer demand for natural and organic food products is driving expansion into niche markets and direct-to-consumer sales channels. The potential for carbon sequestration benefits associated with improved soil health is also an emerging area for market differentiation and growth.
Growth Accelerators in the Mycorrhizal Inoculants Industry
Catalysts driving long-term growth in the Mycorrhizal Inoculants industry are multifaceted. Breakthroughs in genetic engineering and microbial selection are continuously yielding more potent and resilient strains. Strategic partnerships between research institutions and private companies are accelerating product development and market entry. Furthermore, global expansion strategies, particularly into emerging economies with vast agricultural potential and a growing need for sustainable solutions, are significant growth accelerators. Increased investment in education and extension services to farmers will foster wider adoption and understanding of the technology's benefits, solidifying its role in modern agriculture.
Key Players Shaping the Mycorrhizal Inoculants Market
- Novozymes A/S
- BASF
- DuPont
- Agrauxine
- Verdesian Life Sciences
- Brettyoung
- Bayer
- Vittia
- Rizobacter
- KALO
- Loveland Products
- Mycorrhizal Applications
- Premier Tech
- Yigeda Bio-Technology
- Xitebio Technologies
- Agnition
- Horticultural Alliance
- New Edge Microbials
- Legume Technology
- Syngenta
- Alosca Technologies
- Groundwork BioAg
- Zhongnong Fuyuan
Notable Milestones in Mycorrhizal Inoculants Sector
- 2019: Launch of novel ectomycorrhizal formulations for forestry applications by a leading player.
- 2020: Significant investment in R&D by major agricultural companies into microbial solutions, including mycorrhizae.
- 2021: Emergence of new biological input companies focusing on specific crop segments and niche markets.
- 2022: Increased regulatory approvals for mycorrhizal inoculants in key agricultural regions, easing market entry.
- 2023: Growing adoption of liquid mycorrhizal inoculants due to ease of application and improved efficacy.
- 2024: Announcement of strategic collaborations to develop integrated bio-fertilizer and bio-stimulant packages.
In-Depth Mycorrhizal Inoculants Market Outlook
The future market potential for Mycorrhizal Inoculants is exceptionally strong, driven by the inexorable shift towards sustainable and regenerative agriculture. Growth accelerators, including technological breakthroughs in strain development and formulation, coupled with increasing farmer education and favorable regulatory environments, will propel market expansion. Strategic opportunities lie in penetrating untapped geographical regions, developing specialized products for high-value crops, and integrating these bio-solutions into advanced precision farming systems. The market is projected to experience sustained growth as global food security and environmental stewardship become paramount.
Mycorrhizal Inoculants Segmentation
-
1. Application
- 1.1. Oilseeds and Pulses
- 1.2. Cereals
- 1.3. Fruits and Vegetables
- 1.4. Other
-
2. Types
- 2.1. Liquid
- 2.2. Dry Preparation
Mycorrhizal Inoculants Segmentation By Geography
-
1. North America
- 1.1. United States
- 1.2. Canada
- 1.3. Mexico
-
2. South America
- 2.1. Brazil
- 2.2. Argentina
- 2.3. Rest of South America
-
3. Europe
- 3.1. United Kingdom
- 3.2. Germany
- 3.3. France
- 3.4. Italy
- 3.5. Spain
- 3.6. Russia
- 3.7. Benelux
- 3.8. Nordics
- 3.9. Rest of Europe
-
4. Middle East & Africa
- 4.1. Turkey
- 4.2. Israel
- 4.3. GCC
- 4.4. North Africa
- 4.5. South Africa
- 4.6. Rest of Middle East & Africa
-
5. Asia Pacific
- 5.1. China
- 5.2. India
- 5.3. Japan
- 5.4. South Korea
- 5.5. ASEAN
- 5.6. Oceania
- 5.7. Rest of Asia Pacific
Mycorrhizal Inoculants REPORT HIGHLIGHTS
| Aspects | Details |
|---|---|
| Study Period | 2019-2033 |
| Base Year | 2024 |
| Estimated Year | 2025 |
| Forecast Period | 2025-2033 |
| Historical Period | 2019-2024 |
| Growth Rate | CAGR of 1.2% from 2019-2033 |
| Segmentation |
|
Table of Contents
- 1. Introduction
- 1.1. Research Scope
- 1.2. Market Segmentation
- 1.3. Research Methodology
- 1.4. Definitions and Assumptions
- 2. Executive Summary
- 2.1. Introduction
- 3. Market Dynamics
- 3.1. Introduction
- 3.2. Market Drivers
- 3.3. Market Restrains
- 3.4. Market Trends
- 4. Market Factor Analysis
- 4.1. Porters Five Forces
- 4.2. Supply/Value Chain
- 4.3. PESTEL analysis
- 4.4. Market Entropy
- 4.5. Patent/Trademark Analysis
- 5. Global Mycorrhizal Inoculants Analysis, Insights and Forecast, 2019-2031
- 5.1. Market Analysis, Insights and Forecast - by Application
- 5.1.1. Oilseeds and Pulses
- 5.1.2. Cereals
- 5.1.3. Fruits and Vegetables
- 5.1.4. Other
- 5.2. Market Analysis, Insights and Forecast - by Types
- 5.2.1. Liquid
- 5.2.2. Dry Preparation
- 5.3. Market Analysis, Insights and Forecast - by Region
- 5.3.1. North America
- 5.3.2. South America
- 5.3.3. Europe
- 5.3.4. Middle East & Africa
- 5.3.5. Asia Pacific
- 5.1. Market Analysis, Insights and Forecast - by Application
- 6. North America Mycorrhizal Inoculants Analysis, Insights and Forecast, 2019-2031
- 6.1. Market Analysis, Insights and Forecast - by Application
- 6.1.1. Oilseeds and Pulses
- 6.1.2. Cereals
- 6.1.3. Fruits and Vegetables
- 6.1.4. Other
- 6.2. Market Analysis, Insights and Forecast - by Types
- 6.2.1. Liquid
- 6.2.2. Dry Preparation
- 6.1. Market Analysis, Insights and Forecast - by Application
- 7. South America Mycorrhizal Inoculants Analysis, Insights and Forecast, 2019-2031
- 7.1. Market Analysis, Insights and Forecast - by Application
- 7.1.1. Oilseeds and Pulses
- 7.1.2. Cereals
- 7.1.3. Fruits and Vegetables
- 7.1.4. Other
- 7.2. Market Analysis, Insights and Forecast - by Types
- 7.2.1. Liquid
- 7.2.2. Dry Preparation
- 7.1. Market Analysis, Insights and Forecast - by Application
- 8. Europe Mycorrhizal Inoculants Analysis, Insights and Forecast, 2019-2031
- 8.1. Market Analysis, Insights and Forecast - by Application
- 8.1.1. Oilseeds and Pulses
- 8.1.2. Cereals
- 8.1.3. Fruits and Vegetables
- 8.1.4. Other
- 8.2. Market Analysis, Insights and Forecast - by Types
- 8.2.1. Liquid
- 8.2.2. Dry Preparation
- 8.1. Market Analysis, Insights and Forecast - by Application
- 9. Middle East & Africa Mycorrhizal Inoculants Analysis, Insights and Forecast, 2019-2031
- 9.1. Market Analysis, Insights and Forecast - by Application
- 9.1.1. Oilseeds and Pulses
- 9.1.2. Cereals
- 9.1.3. Fruits and Vegetables
- 9.1.4. Other
- 9.2. Market Analysis, Insights and Forecast - by Types
- 9.2.1. Liquid
- 9.2.2. Dry Preparation
- 9.1. Market Analysis, Insights and Forecast - by Application
- 10. Asia Pacific Mycorrhizal Inoculants Analysis, Insights and Forecast, 2019-2031
- 10.1. Market Analysis, Insights and Forecast - by Application
- 10.1.1. Oilseeds and Pulses
- 10.1.2. Cereals
- 10.1.3. Fruits and Vegetables
- 10.1.4. Other
- 10.2. Market Analysis, Insights and Forecast - by Types
- 10.2.1. Liquid
- 10.2.2. Dry Preparation
- 10.1. Market Analysis, Insights and Forecast - by Application
- 11. Competitive Analysis
- 11.1. Global Market Share Analysis 2024
- 11.2. Company Profiles
- 11.2.1 Novozymes A/S
- 11.2.1.1. Overview
- 11.2.1.2. Products
- 11.2.1.3. SWOT Analysis
- 11.2.1.4. Recent Developments
- 11.2.1.5. Financials (Based on Availability)
- 11.2.2 BASF
- 11.2.2.1. Overview
- 11.2.2.2. Products
- 11.2.2.3. SWOT Analysis
- 11.2.2.4. Recent Developments
- 11.2.2.5. Financials (Based on Availability)
- 11.2.3 DuPont
- 11.2.3.1. Overview
- 11.2.3.2. Products
- 11.2.3.3. SWOT Analysis
- 11.2.3.4. Recent Developments
- 11.2.3.5. Financials (Based on Availability)
- 11.2.4 Agrauxine
- 11.2.4.1. Overview
- 11.2.4.2. Products
- 11.2.4.3. SWOT Analysis
- 11.2.4.4. Recent Developments
- 11.2.4.5. Financials (Based on Availability)
- 11.2.5 Verdesian Life Sciences
- 11.2.5.1. Overview
- 11.2.5.2. Products
- 11.2.5.3. SWOT Analysis
- 11.2.5.4. Recent Developments
- 11.2.5.5. Financials (Based on Availability)
- 11.2.6 Brettyoung
- 11.2.6.1. Overview
- 11.2.6.2. Products
- 11.2.6.3. SWOT Analysis
- 11.2.6.4. Recent Developments
- 11.2.6.5. Financials (Based on Availability)
- 11.2.7 Bayer
- 11.2.7.1. Overview
- 11.2.7.2. Products
- 11.2.7.3. SWOT Analysis
- 11.2.7.4. Recent Developments
- 11.2.7.5. Financials (Based on Availability)
- 11.2.8 Vittia
- 11.2.8.1. Overview
- 11.2.8.2. Products
- 11.2.8.3. SWOT Analysis
- 11.2.8.4. Recent Developments
- 11.2.8.5. Financials (Based on Availability)
- 11.2.9 Rizobacter
- 11.2.9.1. Overview
- 11.2.9.2. Products
- 11.2.9.3. SWOT Analysis
- 11.2.9.4. Recent Developments
- 11.2.9.5. Financials (Based on Availability)
- 11.2.10 KALO
- 11.2.10.1. Overview
- 11.2.10.2. Products
- 11.2.10.3. SWOT Analysis
- 11.2.10.4. Recent Developments
- 11.2.10.5. Financials (Based on Availability)
- 11.2.11 Loveland Products
- 11.2.11.1. Overview
- 11.2.11.2. Products
- 11.2.11.3. SWOT Analysis
- 11.2.11.4. Recent Developments
- 11.2.11.5. Financials (Based on Availability)
- 11.2.12 Mycorrhizal Applications
- 11.2.12.1. Overview
- 11.2.12.2. Products
- 11.2.12.3. SWOT Analysis
- 11.2.12.4. Recent Developments
- 11.2.12.5. Financials (Based on Availability)
- 11.2.13 Premier Tech
- 11.2.13.1. Overview
- 11.2.13.2. Products
- 11.2.13.3. SWOT Analysis
- 11.2.13.4. Recent Developments
- 11.2.13.5. Financials (Based on Availability)
- 11.2.14 Yigeda Bio-Technology
- 11.2.14.1. Overview
- 11.2.14.2. Products
- 11.2.14.3. SWOT Analysis
- 11.2.14.4. Recent Developments
- 11.2.14.5. Financials (Based on Availability)
- 11.2.15 Xitebio Technologies
- 11.2.15.1. Overview
- 11.2.15.2. Products
- 11.2.15.3. SWOT Analysis
- 11.2.15.4. Recent Developments
- 11.2.15.5. Financials (Based on Availability)
- 11.2.16 Agnition
- 11.2.16.1. Overview
- 11.2.16.2. Products
- 11.2.16.3. SWOT Analysis
- 11.2.16.4. Recent Developments
- 11.2.16.5. Financials (Based on Availability)
- 11.2.17 Horticultural Alliance
- 11.2.17.1. Overview
- 11.2.17.2. Products
- 11.2.17.3. SWOT Analysis
- 11.2.17.4. Recent Developments
- 11.2.17.5. Financials (Based on Availability)
- 11.2.18 New Edge Microbials
- 11.2.18.1. Overview
- 11.2.18.2. Products
- 11.2.18.3. SWOT Analysis
- 11.2.18.4. Recent Developments
- 11.2.18.5. Financials (Based on Availability)
- 11.2.19 Legume Technology
- 11.2.19.1. Overview
- 11.2.19.2. Products
- 11.2.19.3. SWOT Analysis
- 11.2.19.4. Recent Developments
- 11.2.19.5. Financials (Based on Availability)
- 11.2.20 Syngenta
- 11.2.20.1. Overview
- 11.2.20.2. Products
- 11.2.20.3. SWOT Analysis
- 11.2.20.4. Recent Developments
- 11.2.20.5. Financials (Based on Availability)
- 11.2.21 Alosca Technologies
- 11.2.21.1. Overview
- 11.2.21.2. Products
- 11.2.21.3. SWOT Analysis
- 11.2.21.4. Recent Developments
- 11.2.21.5. Financials (Based on Availability)
- 11.2.22 Groundwork BioAg
- 11.2.22.1. Overview
- 11.2.22.2. Products
- 11.2.22.3. SWOT Analysis
- 11.2.22.4. Recent Developments
- 11.2.22.5. Financials (Based on Availability)
- 11.2.23 Zhongnong Fuyuan
- 11.2.23.1. Overview
- 11.2.23.2. Products
- 11.2.23.3. SWOT Analysis
- 11.2.23.4. Recent Developments
- 11.2.23.5. Financials (Based on Availability)
- 11.2.1 Novozymes A/S
List of Figures
- Figure 1: Global Mycorrhizal Inoculants Revenue Breakdown (million, %) by Region 2024 & 2032
- Figure 2: Global Mycorrhizal Inoculants Volume Breakdown (K, %) by Region 2024 & 2032
- Figure 3: North America Mycorrhizal Inoculants Revenue (million), by Application 2024 & 2032
- Figure 4: North America Mycorrhizal Inoculants Volume (K), by Application 2024 & 2032
- Figure 5: North America Mycorrhizal Inoculants Revenue Share (%), by Application 2024 & 2032
- Figure 6: North America Mycorrhizal Inoculants Volume Share (%), by Application 2024 & 2032
- Figure 7: North America Mycorrhizal Inoculants Revenue (million), by Types 2024 & 2032
- Figure 8: North America Mycorrhizal Inoculants Volume (K), by Types 2024 & 2032
- Figure 9: North America Mycorrhizal Inoculants Revenue Share (%), by Types 2024 & 2032
- Figure 10: North America Mycorrhizal Inoculants Volume Share (%), by Types 2024 & 2032
- Figure 11: North America Mycorrhizal Inoculants Revenue (million), by Country 2024 & 2032
- Figure 12: North America Mycorrhizal Inoculants Volume (K), by Country 2024 & 2032
- Figure 13: North America Mycorrhizal Inoculants Revenue Share (%), by Country 2024 & 2032
- Figure 14: North America Mycorrhizal Inoculants Volume Share (%), by Country 2024 & 2032
- Figure 15: South America Mycorrhizal Inoculants Revenue (million), by Application 2024 & 2032
- Figure 16: South America Mycorrhizal Inoculants Volume (K), by Application 2024 & 2032
- Figure 17: South America Mycorrhizal Inoculants Revenue Share (%), by Application 2024 & 2032
- Figure 18: South America Mycorrhizal Inoculants Volume Share (%), by Application 2024 & 2032
- Figure 19: South America Mycorrhizal Inoculants Revenue (million), by Types 2024 & 2032
- Figure 20: South America Mycorrhizal Inoculants Volume (K), by Types 2024 & 2032
- Figure 21: South America Mycorrhizal Inoculants Revenue Share (%), by Types 2024 & 2032
- Figure 22: South America Mycorrhizal Inoculants Volume Share (%), by Types 2024 & 2032
- Figure 23: South America Mycorrhizal Inoculants Revenue (million), by Country 2024 & 2032
- Figure 24: South America Mycorrhizal Inoculants Volume (K), by Country 2024 & 2032
- Figure 25: South America Mycorrhizal Inoculants Revenue Share (%), by Country 2024 & 2032
- Figure 26: South America Mycorrhizal Inoculants Volume Share (%), by Country 2024 & 2032
- Figure 27: Europe Mycorrhizal Inoculants Revenue (million), by Application 2024 & 2032
- Figure 28: Europe Mycorrhizal Inoculants Volume (K), by Application 2024 & 2032
- Figure 29: Europe Mycorrhizal Inoculants Revenue Share (%), by Application 2024 & 2032
- Figure 30: Europe Mycorrhizal Inoculants Volume Share (%), by Application 2024 & 2032
- Figure 31: Europe Mycorrhizal Inoculants Revenue (million), by Types 2024 & 2032
- Figure 32: Europe Mycorrhizal Inoculants Volume (K), by Types 2024 & 2032
- Figure 33: Europe Mycorrhizal Inoculants Revenue Share (%), by Types 2024 & 2032
- Figure 34: Europe Mycorrhizal Inoculants Volume Share (%), by Types 2024 & 2032
- Figure 35: Europe Mycorrhizal Inoculants Revenue (million), by Country 2024 & 2032
- Figure 36: Europe Mycorrhizal Inoculants Volume (K), by Country 2024 & 2032
- Figure 37: Europe Mycorrhizal Inoculants Revenue Share (%), by Country 2024 & 2032
- Figure 38: Europe Mycorrhizal Inoculants Volume Share (%), by Country 2024 & 2032
- Figure 39: Middle East & Africa Mycorrhizal Inoculants Revenue (million), by Application 2024 & 2032
- Figure 40: Middle East & Africa Mycorrhizal Inoculants Volume (K), by Application 2024 & 2032
- Figure 41: Middle East & Africa Mycorrhizal Inoculants Revenue Share (%), by Application 2024 & 2032
- Figure 42: Middle East & Africa Mycorrhizal Inoculants Volume Share (%), by Application 2024 & 2032
- Figure 43: Middle East & Africa Mycorrhizal Inoculants Revenue (million), by Types 2024 & 2032
- Figure 44: Middle East & Africa Mycorrhizal Inoculants Volume (K), by Types 2024 & 2032
- Figure 45: Middle East & Africa Mycorrhizal Inoculants Revenue Share (%), by Types 2024 & 2032
- Figure 46: Middle East & Africa Mycorrhizal Inoculants Volume Share (%), by Types 2024 & 2032
- Figure 47: Middle East & Africa Mycorrhizal Inoculants Revenue (million), by Country 2024 & 2032
- Figure 48: Middle East & Africa Mycorrhizal Inoculants Volume (K), by Country 2024 & 2032
- Figure 49: Middle East & Africa Mycorrhizal Inoculants Revenue Share (%), by Country 2024 & 2032
- Figure 50: Middle East & Africa Mycorrhizal Inoculants Volume Share (%), by Country 2024 & 2032
- Figure 51: Asia Pacific Mycorrhizal Inoculants Revenue (million), by Application 2024 & 2032
- Figure 52: Asia Pacific Mycorrhizal Inoculants Volume (K), by Application 2024 & 2032
- Figure 53: Asia Pacific Mycorrhizal Inoculants Revenue Share (%), by Application 2024 & 2032
- Figure 54: Asia Pacific Mycorrhizal Inoculants Volume Share (%), by Application 2024 & 2032
- Figure 55: Asia Pacific Mycorrhizal Inoculants Revenue (million), by Types 2024 & 2032
- Figure 56: Asia Pacific Mycorrhizal Inoculants Volume (K), by Types 2024 & 2032
- Figure 57: Asia Pacific Mycorrhizal Inoculants Revenue Share (%), by Types 2024 & 2032
- Figure 58: Asia Pacific Mycorrhizal Inoculants Volume Share (%), by Types 2024 & 2032
- Figure 59: Asia Pacific Mycorrhizal Inoculants Revenue (million), by Country 2024 & 2032
- Figure 60: Asia Pacific Mycorrhizal Inoculants Volume (K), by Country 2024 & 2032
- Figure 61: Asia Pacific Mycorrhizal Inoculants Revenue Share (%), by Country 2024 & 2032
- Figure 62: Asia Pacific Mycorrhizal Inoculants Volume Share (%), by Country 2024 & 2032
List of Tables
- Table 1: Global Mycorrhizal Inoculants Revenue million Forecast, by Region 2019 & 2032
- Table 2: Global Mycorrhizal Inoculants Volume K Forecast, by Region 2019 & 2032
- Table 3: Global Mycorrhizal Inoculants Revenue million Forecast, by Application 2019 & 2032
- Table 4: Global Mycorrhizal Inoculants Volume K Forecast, by Application 2019 & 2032
- Table 5: Global Mycorrhizal Inoculants Revenue million Forecast, by Types 2019 & 2032
- Table 6: Global Mycorrhizal Inoculants Volume K Forecast, by Types 2019 & 2032
- Table 7: Global Mycorrhizal Inoculants Revenue million Forecast, by Region 2019 & 2032
- Table 8: Global Mycorrhizal Inoculants Volume K Forecast, by Region 2019 & 2032
- Table 9: Global Mycorrhizal Inoculants Revenue million Forecast, by Application 2019 & 2032
- Table 10: Global Mycorrhizal Inoculants Volume K Forecast, by Application 2019 & 2032
- Table 11: Global Mycorrhizal Inoculants Revenue million Forecast, by Types 2019 & 2032
- Table 12: Global Mycorrhizal Inoculants Volume K Forecast, by Types 2019 & 2032
- Table 13: Global Mycorrhizal Inoculants Revenue million Forecast, by Country 2019 & 2032
- Table 14: Global Mycorrhizal Inoculants Volume K Forecast, by Country 2019 & 2032
- Table 15: United States Mycorrhizal Inoculants Revenue (million) Forecast, by Application 2019 & 2032
- Table 16: United States Mycorrhizal Inoculants Volume (K) Forecast, by Application 2019 & 2032
- Table 17: Canada Mycorrhizal Inoculants Revenue (million) Forecast, by Application 2019 & 2032
- Table 18: Canada Mycorrhizal Inoculants Volume (K) Forecast, by Application 2019 & 2032
- Table 19: Mexico Mycorrhizal Inoculants Revenue (million) Forecast, by Application 2019 & 2032
- Table 20: Mexico Mycorrhizal Inoculants Volume (K) Forecast, by Application 2019 & 2032
- Table 21: Global Mycorrhizal Inoculants Revenue million Forecast, by Application 2019 & 2032
- Table 22: Global Mycorrhizal Inoculants Volume K Forecast, by Application 2019 & 2032
- Table 23: Global Mycorrhizal Inoculants Revenue million Forecast, by Types 2019 & 2032
- Table 24: Global Mycorrhizal Inoculants Volume K Forecast, by Types 2019 & 2032
- Table 25: Global Mycorrhizal Inoculants Revenue million Forecast, by Country 2019 & 2032
- Table 26: Global Mycorrhizal Inoculants Volume K Forecast, by Country 2019 & 2032
- Table 27: Brazil Mycorrhizal Inoculants Revenue (million) Forecast, by Application 2019 & 2032
- Table 28: Brazil Mycorrhizal Inoculants Volume (K) Forecast, by Application 2019 & 2032
- Table 29: Argentina Mycorrhizal Inoculants Revenue (million) Forecast, by Application 2019 & 2032
- Table 30: Argentina Mycorrhizal Inoculants Volume (K) Forecast, by Application 2019 & 2032
- Table 31: Rest of South America Mycorrhizal Inoculants Revenue (million) Forecast, by Application 2019 & 2032
- Table 32: Rest of South America Mycorrhizal Inoculants Volume (K) Forecast, by Application 2019 & 2032
- Table 33: Global Mycorrhizal Inoculants Revenue million Forecast, by Application 2019 & 2032
- Table 34: Global Mycorrhizal Inoculants Volume K Forecast, by Application 2019 & 2032
- Table 35: Global Mycorrhizal Inoculants Revenue million Forecast, by Types 2019 & 2032
- Table 36: Global Mycorrhizal Inoculants Volume K Forecast, by Types 2019 & 2032
- Table 37: Global Mycorrhizal Inoculants Revenue million Forecast, by Country 2019 & 2032
- Table 38: Global Mycorrhizal Inoculants Volume K Forecast, by Country 2019 & 2032
- Table 39: United Kingdom Mycorrhizal Inoculants Revenue (million) Forecast, by Application 2019 & 2032
- Table 40: United Kingdom Mycorrhizal Inoculants Volume (K) Forecast, by Application 2019 & 2032
- Table 41: Germany Mycorrhizal Inoculants Revenue (million) Forecast, by Application 2019 & 2032
- Table 42: Germany Mycorrhizal Inoculants Volume (K) Forecast, by Application 2019 & 2032
- Table 43: France Mycorrhizal Inoculants Revenue (million) Forecast, by Application 2019 & 2032
- Table 44: France Mycorrhizal Inoculants Volume (K) Forecast, by Application 2019 & 2032
- Table 45: Italy Mycorrhizal Inoculants Revenue (million) Forecast, by Application 2019 & 2032
- Table 46: Italy Mycorrhizal Inoculants Volume (K) Forecast, by Application 2019 & 2032
- Table 47: Spain Mycorrhizal Inoculants Revenue (million) Forecast, by Application 2019 & 2032
- Table 48: Spain Mycorrhizal Inoculants Volume (K) Forecast, by Application 2019 & 2032
- Table 49: Russia Mycorrhizal Inoculants Revenue (million) Forecast, by Application 2019 & 2032
- Table 50: Russia Mycorrhizal Inoculants Volume (K) Forecast, by Application 2019 & 2032
- Table 51: Benelux Mycorrhizal Inoculants Revenue (million) Forecast, by Application 2019 & 2032
- Table 52: Benelux Mycorrhizal Inoculants Volume (K) Forecast, by Application 2019 & 2032
- Table 53: Nordics Mycorrhizal Inoculants Revenue (million) Forecast, by Application 2019 & 2032
- Table 54: Nordics Mycorrhizal Inoculants Volume (K) Forecast, by Application 2019 & 2032
- Table 55: Rest of Europe Mycorrhizal Inoculants Revenue (million) Forecast, by Application 2019 & 2032
- Table 56: Rest of Europe Mycorrhizal Inoculants Volume (K) Forecast, by Application 2019 & 2032
- Table 57: Global Mycorrhizal Inoculants Revenue million Forecast, by Application 2019 & 2032
- Table 58: Global Mycorrhizal Inoculants Volume K Forecast, by Application 2019 & 2032
- Table 59: Global Mycorrhizal Inoculants Revenue million Forecast, by Types 2019 & 2032
- Table 60: Global Mycorrhizal Inoculants Volume K Forecast, by Types 2019 & 2032
- Table 61: Global Mycorrhizal Inoculants Revenue million Forecast, by Country 2019 & 2032
- Table 62: Global Mycorrhizal Inoculants Volume K Forecast, by Country 2019 & 2032
- Table 63: Turkey Mycorrhizal Inoculants Revenue (million) Forecast, by Application 2019 & 2032
- Table 64: Turkey Mycorrhizal Inoculants Volume (K) Forecast, by Application 2019 & 2032
- Table 65: Israel Mycorrhizal Inoculants Revenue (million) Forecast, by Application 2019 & 2032
- Table 66: Israel Mycorrhizal Inoculants Volume (K) Forecast, by Application 2019 & 2032
- Table 67: GCC Mycorrhizal Inoculants Revenue (million) Forecast, by Application 2019 & 2032
- Table 68: GCC Mycorrhizal Inoculants Volume (K) Forecast, by Application 2019 & 2032
- Table 69: North Africa Mycorrhizal Inoculants Revenue (million) Forecast, by Application 2019 & 2032
- Table 70: North Africa Mycorrhizal Inoculants Volume (K) Forecast, by Application 2019 & 2032
- Table 71: South Africa Mycorrhizal Inoculants Revenue (million) Forecast, by Application 2019 & 2032
- Table 72: South Africa Mycorrhizal Inoculants Volume (K) Forecast, by Application 2019 & 2032
- Table 73: Rest of Middle East & Africa Mycorrhizal Inoculants Revenue (million) Forecast, by Application 2019 & 2032
- Table 74: Rest of Middle East & Africa Mycorrhizal Inoculants Volume (K) Forecast, by Application 2019 & 2032
- Table 75: Global Mycorrhizal Inoculants Revenue million Forecast, by Application 2019 & 2032
- Table 76: Global Mycorrhizal Inoculants Volume K Forecast, by Application 2019 & 2032
- Table 77: Global Mycorrhizal Inoculants Revenue million Forecast, by Types 2019 & 2032
- Table 78: Global Mycorrhizal Inoculants Volume K Forecast, by Types 2019 & 2032
- Table 79: Global Mycorrhizal Inoculants Revenue million Forecast, by Country 2019 & 2032
- Table 80: Global Mycorrhizal Inoculants Volume K Forecast, by Country 2019 & 2032
- Table 81: China Mycorrhizal Inoculants Revenue (million) Forecast, by Application 2019 & 2032
- Table 82: China Mycorrhizal Inoculants Volume (K) Forecast, by Application 2019 & 2032
- Table 83: India Mycorrhizal Inoculants Revenue (million) Forecast, by Application 2019 & 2032
- Table 84: India Mycorrhizal Inoculants Volume (K) Forecast, by Application 2019 & 2032
- Table 85: Japan Mycorrhizal Inoculants Revenue (million) Forecast, by Application 2019 & 2032
- Table 86: Japan Mycorrhizal Inoculants Volume (K) Forecast, by Application 2019 & 2032
- Table 87: South Korea Mycorrhizal Inoculants Revenue (million) Forecast, by Application 2019 & 2032
- Table 88: South Korea Mycorrhizal Inoculants Volume (K) Forecast, by Application 2019 & 2032
- Table 89: ASEAN Mycorrhizal Inoculants Revenue (million) Forecast, by Application 2019 & 2032
- Table 90: ASEAN Mycorrhizal Inoculants Volume (K) Forecast, by Application 2019 & 2032
- Table 91: Oceania Mycorrhizal Inoculants Revenue (million) Forecast, by Application 2019 & 2032
- Table 92: Oceania Mycorrhizal Inoculants Volume (K) Forecast, by Application 2019 & 2032
- Table 93: Rest of Asia Pacific Mycorrhizal Inoculants Revenue (million) Forecast, by Application 2019 & 2032
- Table 94: Rest of Asia Pacific Mycorrhizal Inoculants Volume (K) Forecast, by Application 2019 & 2032
Frequently Asked Questions
1. What is the projected Compound Annual Growth Rate (CAGR) of the Mycorrhizal Inoculants?
The projected CAGR is approximately 1.2%.
2. Which companies are prominent players in the Mycorrhizal Inoculants?
Key companies in the market include Novozymes A/S, BASF, DuPont, Agrauxine, Verdesian Life Sciences, Brettyoung, Bayer, Vittia, Rizobacter, KALO, Loveland Products, Mycorrhizal Applications, Premier Tech, Yigeda Bio-Technology, Xitebio Technologies, Agnition, Horticultural Alliance, New Edge Microbials, Legume Technology, Syngenta, Alosca Technologies, Groundwork BioAg, Zhongnong Fuyuan.
3. What are the main segments of the Mycorrhizal Inoculants?
The market segments include Application, Types.
4. Can you provide details about the market size?
The market size is estimated to be USD 4999 million as of 2022.
5. What are some drivers contributing to market growth?
N/A
6. What are the notable trends driving market growth?
N/A
7. Are there any restraints impacting market growth?
N/A
8. Can you provide examples of recent developments in the market?
N/A
9. What pricing options are available for accessing the report?
Pricing options include single-user, multi-user, and enterprise licenses priced at USD 3950.00, USD 5925.00, and USD 7900.00 respectively.
10. Is the market size provided in terms of value or volume?
The market size is provided in terms of value, measured in million and volume, measured in K.
11. Are there any specific market keywords associated with the report?
Yes, the market keyword associated with the report is "Mycorrhizal Inoculants," which aids in identifying and referencing the specific market segment covered.
12. How do I determine which pricing option suits my needs best?
The pricing options vary based on user requirements and access needs. Individual users may opt for single-user licenses, while businesses requiring broader access may choose multi-user or enterprise licenses for cost-effective access to the report.
13. Are there any additional resources or data provided in the Mycorrhizal Inoculants report?
While the report offers comprehensive insights, it's advisable to review the specific contents or supplementary materials provided to ascertain if additional resources or data are available.
14. How can I stay updated on further developments or reports in the Mycorrhizal Inoculants?
To stay informed about further developments, trends, and reports in the Mycorrhizal Inoculants, consider subscribing to industry newsletters, following relevant companies and organizations, or regularly checking reputable industry news sources and publications.
Methodology
Step 1 - Identification of Relevant Samples Size from Population Database


Step 2 - Approaches for Defining Global Market Size (Value, Volume* & Price*)

Note*: In applicable scenarios
Step 3 - Data Sources
Primary Research
- Web Analytics
- Survey Reports
- Research Institute
- Latest Research Reports
- Opinion Leaders
Secondary Research
- Annual Reports
- White Paper
- Latest Press Release
- Industry Association
- Paid Database
- Investor Presentations

Step 4 - Data Triangulation
Involves using different sources of information in order to increase the validity of a study
These sources are likely to be stakeholders in a program - participants, other researchers, program staff, other community members, and so on.
Then we put all data in single framework & apply various statistical tools to find out the dynamic on the market.
During the analysis stage, feedback from the stakeholder groups would be compared to determine areas of agreement as well as areas of divergence


