
Key Insights
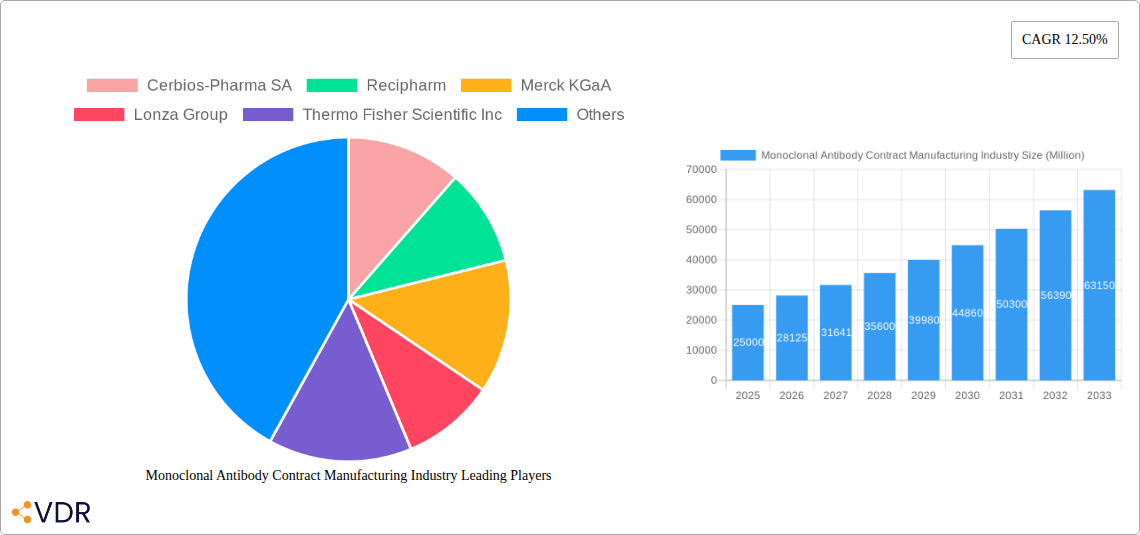
The global monoclonal antibody (mAb) contract manufacturing market is experiencing robust growth, driven by the increasing demand for biologics, particularly in the treatment of cancers like myeloma, lymphoma, and breast cancer. The market's Compound Annual Growth Rate (CAGR) of 12.50% from 2019-2024 suggests a significant expansion, projected to continue through 2033. This growth is fueled by several factors: the rising prevalence of chronic diseases requiring mAb therapies, the increasing outsourcing of manufacturing by pharmaceutical companies to focus on R&D, and the continuous technological advancements in mAb production processes, leading to higher efficiency and lower costs. The market is segmented by linker type (cleavable and non-cleavable), application (cancer types and other therapeutic areas), and manufacturing phase (clinical and commercial). The dominance of specific segments will shift over time as new therapeutic areas emerge and manufacturing processes evolve, creating opportunities for contract manufacturers specializing in niche areas.
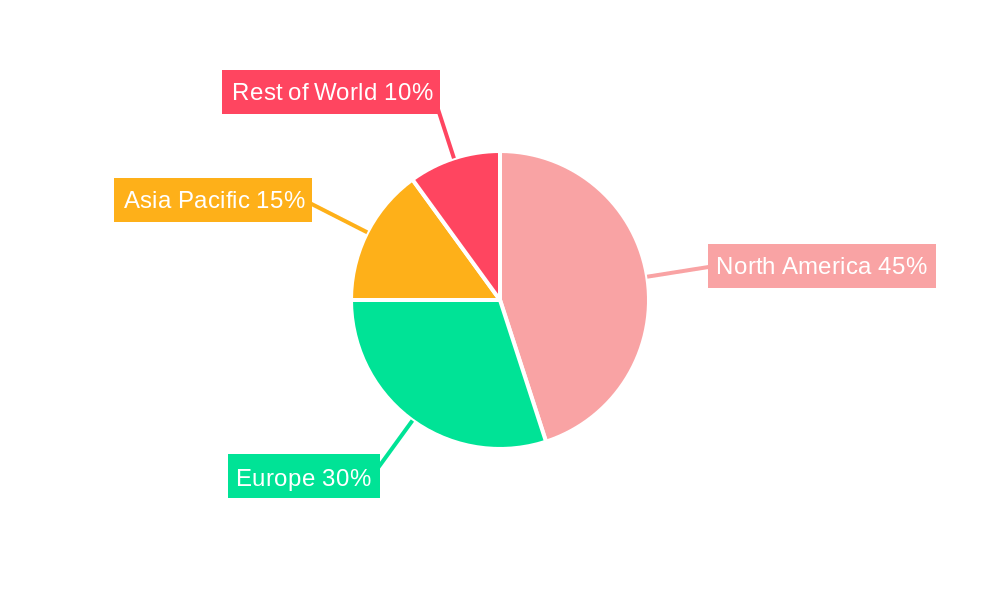
Major players like Cerbios-Pharma SA, Recipharm, Merck KGaA, and Lonza Group are key contributors to this dynamic market. Their capabilities in handling complex mAb manufacturing processes, combined with their established global presence, contribute significantly to market share. However, the market's future also depends on factors such as regulatory hurdles, pricing pressures, and the emergence of novel manufacturing technologies. The North American market currently holds a substantial share, but the Asia-Pacific region is expected to exhibit significant growth due to increasing investments in healthcare infrastructure and growing demand for biologics. The market’s evolution will be closely intertwined with advancements in personalized medicine and the development of next-generation mAb therapies. Companies are increasingly focusing on developing innovative solutions and strengthening their capabilities to meet the growing demands of a rapidly evolving market.
Monoclonal Antibody Contract Manufacturing Industry Market Report: 2019-2033
This comprehensive report provides a detailed analysis of the Monoclonal Antibody Contract Manufacturing industry, encompassing market dynamics, growth trends, regional segmentation, product landscape, and key players. The study period covers 2019-2033, with a base year of 2025 and a forecast period of 2025-2033. This report is invaluable for industry professionals, investors, and researchers seeking insights into this rapidly evolving market.
Keywords: Monoclonal Antibody Contract Manufacturing, Antibody-Drug Conjugates (ADCs), Cleavable Linker, Non-Cleavable Linker, Myeloma, Lymphoma, Breast Cancer, Clinical Phase, Commercial Phase, Contract Manufacturing Organizations (CMOs), Pharmaceutical Manufacturing, Lonza, Thermo Fisher Scientific, Piramal Pharma Solutions, Market Size, Market Share, CAGR, Market Analysis, Industry Trends, Market Forecast
Monoclonal Antibody Contract Manufacturing Industry Market Dynamics & Structure
The monoclonal antibody contract manufacturing market is characterized by moderate concentration, with several large players and numerous smaller specialized CMOs. Technological innovation, particularly in ADC development and manufacturing, is a key driver. Stringent regulatory frameworks govern manufacturing processes and product quality, influencing market entry barriers and driving consolidation through M&A activities. Competitive substitutes include alternative drug delivery methods and therapies. End-user demographics primarily consist of biopharmaceutical companies developing and commercializing monoclonal antibody-based therapies. The historical period (2019-2024) witnessed significant M&A activity, with xx deals valued at approximately xx million USD.
- Market Concentration: Moderately concentrated, with top 5 players holding approximately xx% market share in 2024.
- Technological Innovation: Focus on automation, process intensification, and single-use technologies driving efficiency and reducing costs.
- Regulatory Framework: Stringent GMP (Good Manufacturing Practices) requirements and regulatory approvals influencing timelines and costs.
- Competitive Substitutes: Growing competition from alternative therapies and drug delivery systems impacting market growth.
- M&A Activity: xx deals between 2019 and 2024, primarily driven by expansion and technological acquisition.
Monoclonal Antibody Contract Manufacturing Industry Growth Trends & Insights
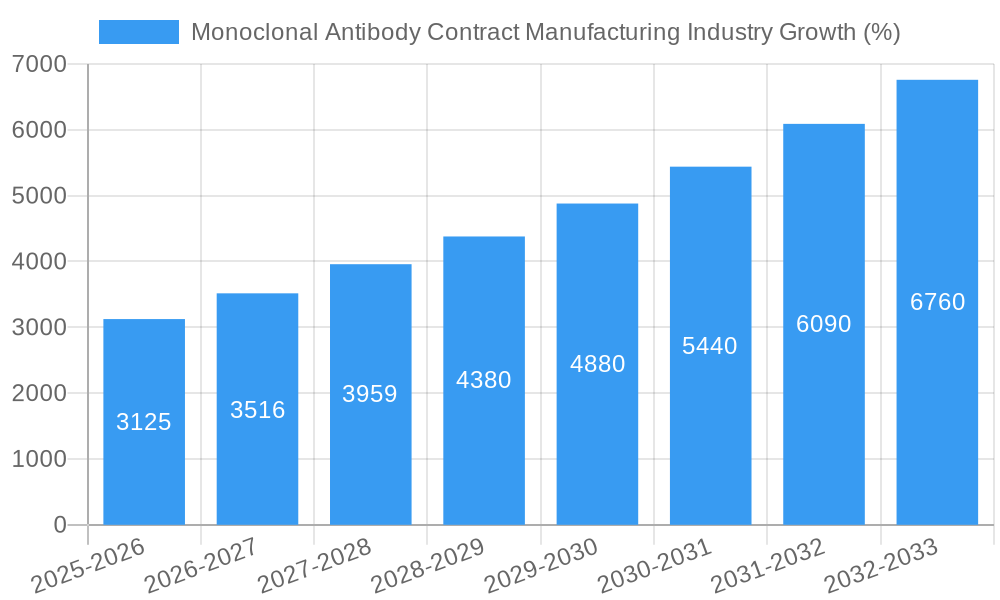
The global monoclonal antibody contract manufacturing market exhibited robust growth during the historical period (2019-2024), driven by the increasing prevalence of chronic diseases and the growing demand for biologics. The market size expanded from xx million USD in 2019 to xx million USD in 2024, reflecting a CAGR of xx%. This growth is further fueled by technological advancements in ADC manufacturing, leading to higher adoption rates and increased market penetration. The market is projected to continue its expansion throughout the forecast period (2025-2033), with a projected CAGR of xx%, reaching xx million USD by 2033. This sustained growth reflects the continuous innovation in monoclonal antibody therapies and the increasing outsourcing of manufacturing by pharmaceutical companies. Consumer behavior shifts towards personalized medicine and targeted therapies are also contributing to market expansion.
Dominant Regions, Countries, or Segments in Monoclonal Antibody Contract Manufacturing Industry
North America currently holds the largest market share in the monoclonal antibody contract manufacturing industry, driven by a strong biopharmaceutical industry presence, robust R&D investment, and advanced manufacturing infrastructure. Europe follows closely, with significant growth potential in Asia-Pacific. Within the segments, the demand for ADCs is significantly driving market expansion. The Cleavable Linker segment commands a larger market share than Non-Cleavable Linker due to its superior efficacy in targeted drug delivery. Applications like Myeloma and Lymphoma contribute significantly to the market size, followed by Breast Cancer and other applications. The Commercial phase holds a higher market share compared to the Clinical phase, reflecting the increasing number of approved monoclonal antibody therapies.
- Key Drivers: Strong R&D investment (North America), favorable regulatory environments (Europe), emerging economies and growing healthcare spending (Asia-Pacific).
- Dominant Segments: ADCs (Cleavable Linkers > Non-Cleavable Linkers), Myeloma, Lymphoma, and Breast Cancer applications.
- Market Share: North America (xx%), Europe (xx%), Asia-Pacific (xx%), Rest of World (xx%).
Monoclonal Antibody Contract Manufacturing Industry Product Landscape
The monoclonal antibody contract manufacturing market features a range of services, including process development, formulation, fill-finish, and analytical testing. Continuous advancements in manufacturing technologies, such as single-use systems and continuous processing, are enhancing efficiency and reducing production costs. Key innovations include advanced ADC conjugation techniques and improved purification methods. The unique selling proposition of CMOs lies in their expertise, specialized infrastructure, and regulatory compliance, enabling cost-effective and efficient manufacturing.
Key Drivers, Barriers & Challenges in Monoclonal Antibody Contract Manufacturing Industry
Key Drivers:
- The rising prevalence of chronic diseases fuels the demand for monoclonal antibody therapies.
- Technological advancements in ADC manufacturing are improving efficacy and adoption rates.
- Increasing outsourcing by pharmaceutical companies to focus on R&D.
Key Barriers & Challenges:
- Stringent regulatory requirements increase manufacturing complexities and costs.
- Capacity constraints and supply chain disruptions impacting production timelines and efficiency.
- Intense competition among CMOs necessitates continuous innovation and cost optimization. The estimated impact of supply chain disruptions on revenue is xx million USD annually.
Emerging Opportunities in Monoclonal Antibody Contract Manufacturing Industry
- Untapped markets in emerging economies present significant growth potential.
- Innovation in ADC payload technology and conjugation methods will drive market expansion.
- Development of novel monoclonal antibody therapies for emerging diseases offers significant opportunity.
Growth Accelerators in the Monoclonal Antibody Contract Manufacturing Industry Industry
Technological breakthroughs in continuous manufacturing and process automation are significantly accelerating market growth. Strategic partnerships between CMOs and biopharmaceutical companies are streamlining the drug development and manufacturing process. The expansion of manufacturing facilities into emerging markets is also a key growth accelerator.
Key Players Shaping the Monoclonal Antibody Contract Manufacturing Industry Market
- Cerbios-Pharma SA
- Recipharm
- Merck KGaA
- Lonza Group
- Thermo Fisher Scientific Inc
- Piramal Pharma Solutions
- Abbvie Inc
- Sterling Pharma Solutions
- Novasep
- Cambrex Corporation
Notable Milestones in Monoclonal Antibody Contract Manufacturing Industry Sector
- July 2022: WuXi XDC and AbTis partnered to develop and manufacture antibody-drug conjugates. This collaboration enhances the ADC manufacturing capacity and expands the market reach of both companies.
- February 2022: Piramal Pharma invested over USD 53.42 million to expand its ADC capabilities in Scotland and invest in new API infrastructure in England. This signifies a substantial investment in the ADC market and indicates a strong market outlook.
In-Depth Monoclonal Antibody Contract Manufacturing Industry Market Outlook
The monoclonal antibody contract manufacturing market is poised for continued robust growth, driven by the increasing demand for biologics and technological advancements. Strategic partnerships, capacity expansions, and innovation in ADC technologies will be crucial for success in this competitive market. The long-term outlook remains positive, with significant opportunities for both established players and new entrants to capitalize on the expanding market potential.
Monoclonal Antibody Contract Manufacturing Industry Segmentation
-
1. Linker
- 1.1. Cleavable Linker
- 1.2. Non-Cleavable Linker
-
2. Application
- 2.1. Myeloma
- 2.2. Lymphoma
- 2.3. Breast cancer
- 2.4. Other Applications
-
3. Phase
- 3.1. Clinical
- 3.2. Commercial
Monoclonal Antibody Contract Manufacturing Industry Segmentation By Geography
-
1. North America
- 1.1. United States
- 1.2. Canada
- 1.3. Mexico
-
2. Europe
- 2.1. Germany
- 2.2. United Kingdom
- 2.3. France
- 2.4. Italy
- 2.5. Spain
- 2.6. Rest of Europe
-
3. Asia Pacific
- 3.1. China
- 3.2. Japan
- 3.3. India
- 3.4. Australia
- 3.5. South Korea
- 3.6. Rest of Asia Pacific
-
4. Middle East and Africa
- 4.1. GCC
- 4.2. South Africa
- 4.3. Rest of Middle East and Africa
-
5. South America
- 5.1. Brazil
- 5.2. Argentina
- 5.3. Rest of South America
Monoclonal Antibody Contract Manufacturing Industry REPORT HIGHLIGHTS
| Aspects | Details |
|---|---|
| Study Period | 2019-2033 |
| Base Year | 2024 |
| Estimated Year | 2025 |
| Forecast Period | 2025-2033 |
| Historical Period | 2019-2024 |
| Growth Rate | CAGR of 12.50% from 2019-2033 |
| Segmentation |
|
Table of Contents
- 1. Introduction
- 1.1. Research Scope
- 1.2. Market Segmentation
- 1.3. Research Methodology
- 1.4. Definitions and Assumptions
- 2. Executive Summary
- 2.1. Introduction
- 3. Market Dynamics
- 3.1. Introduction
- 3.2. Market Drivers
- 3.2.1. Increasing burden of Cancer Cases; Increasing R&D Activities Pertaining to Antibody Drug Conjugates; Growing Demand for Biologic Therapy
- 3.3. Market Restrains
- 3.3.1. R&D and Production Challenges
- 3.4. Market Trends
- 3.4.1. The Cleavable Linker Segment is Expected to Hold a Major Market Share in the Antibody-Drug Conjugates Contract Manufacturing Market
- 4. Market Factor Analysis
- 4.1. Porters Five Forces
- 4.2. Supply/Value Chain
- 4.3. PESTEL analysis
- 4.4. Market Entropy
- 4.5. Patent/Trademark Analysis
- 5. Global Monoclonal Antibody Contract Manufacturing Industry Analysis, Insights and Forecast, 2019-2031
- 5.1. Market Analysis, Insights and Forecast - by Linker
- 5.1.1. Cleavable Linker
- 5.1.2. Non-Cleavable Linker
- 5.2. Market Analysis, Insights and Forecast - by Application
- 5.2.1. Myeloma
- 5.2.2. Lymphoma
- 5.2.3. Breast cancer
- 5.2.4. Other Applications
- 5.3. Market Analysis, Insights and Forecast - by Phase
- 5.3.1. Clinical
- 5.3.2. Commercial
- 5.4. Market Analysis, Insights and Forecast - by Region
- 5.4.1. North America
- 5.4.2. Europe
- 5.4.3. Asia Pacific
- 5.4.4. Middle East and Africa
- 5.4.5. South America
- 5.1. Market Analysis, Insights and Forecast - by Linker
- 6. North America Monoclonal Antibody Contract Manufacturing Industry Analysis, Insights and Forecast, 2019-2031
- 6.1. Market Analysis, Insights and Forecast - by Linker
- 6.1.1. Cleavable Linker
- 6.1.2. Non-Cleavable Linker
- 6.2. Market Analysis, Insights and Forecast - by Application
- 6.2.1. Myeloma
- 6.2.2. Lymphoma
- 6.2.3. Breast cancer
- 6.2.4. Other Applications
- 6.3. Market Analysis, Insights and Forecast - by Phase
- 6.3.1. Clinical
- 6.3.2. Commercial
- 6.1. Market Analysis, Insights and Forecast - by Linker
- 7. Europe Monoclonal Antibody Contract Manufacturing Industry Analysis, Insights and Forecast, 2019-2031
- 7.1. Market Analysis, Insights and Forecast - by Linker
- 7.1.1. Cleavable Linker
- 7.1.2. Non-Cleavable Linker
- 7.2. Market Analysis, Insights and Forecast - by Application
- 7.2.1. Myeloma
- 7.2.2. Lymphoma
- 7.2.3. Breast cancer
- 7.2.4. Other Applications
- 7.3. Market Analysis, Insights and Forecast - by Phase
- 7.3.1. Clinical
- 7.3.2. Commercial
- 7.1. Market Analysis, Insights and Forecast - by Linker
- 8. Asia Pacific Monoclonal Antibody Contract Manufacturing Industry Analysis, Insights and Forecast, 2019-2031
- 8.1. Market Analysis, Insights and Forecast - by Linker
- 8.1.1. Cleavable Linker
- 8.1.2. Non-Cleavable Linker
- 8.2. Market Analysis, Insights and Forecast - by Application
- 8.2.1. Myeloma
- 8.2.2. Lymphoma
- 8.2.3. Breast cancer
- 8.2.4. Other Applications
- 8.3. Market Analysis, Insights and Forecast - by Phase
- 8.3.1. Clinical
- 8.3.2. Commercial
- 8.1. Market Analysis, Insights and Forecast - by Linker
- 9. Middle East and Africa Monoclonal Antibody Contract Manufacturing Industry Analysis, Insights and Forecast, 2019-2031
- 9.1. Market Analysis, Insights and Forecast - by Linker
- 9.1.1. Cleavable Linker
- 9.1.2. Non-Cleavable Linker
- 9.2. Market Analysis, Insights and Forecast - by Application
- 9.2.1. Myeloma
- 9.2.2. Lymphoma
- 9.2.3. Breast cancer
- 9.2.4. Other Applications
- 9.3. Market Analysis, Insights and Forecast - by Phase
- 9.3.1. Clinical
- 9.3.2. Commercial
- 9.1. Market Analysis, Insights and Forecast - by Linker
- 10. South America Monoclonal Antibody Contract Manufacturing Industry Analysis, Insights and Forecast, 2019-2031
- 10.1. Market Analysis, Insights and Forecast - by Linker
- 10.1.1. Cleavable Linker
- 10.1.2. Non-Cleavable Linker
- 10.2. Market Analysis, Insights and Forecast - by Application
- 10.2.1. Myeloma
- 10.2.2. Lymphoma
- 10.2.3. Breast cancer
- 10.2.4. Other Applications
- 10.3. Market Analysis, Insights and Forecast - by Phase
- 10.3.1. Clinical
- 10.3.2. Commercial
- 10.1. Market Analysis, Insights and Forecast - by Linker
- 11. North America Monoclonal Antibody Contract Manufacturing Industry Analysis, Insights and Forecast, 2019-2031
- 11.1. Market Analysis, Insights and Forecast - By Country/Sub-region
- 11.1.1. undefined
- 12. Europe Monoclonal Antibody Contract Manufacturing Industry Analysis, Insights and Forecast, 2019-2031
- 12.1. Market Analysis, Insights and Forecast - By Country/Sub-region
- 12.1.1. undefined
- 13. Asia Pacific Monoclonal Antibody Contract Manufacturing Industry Analysis, Insights and Forecast, 2019-2031
- 13.1. Market Analysis, Insights and Forecast - By Country/Sub-region
- 13.1.1. undefined
- 14. Middle East and Africa Monoclonal Antibody Contract Manufacturing Industry Analysis, Insights and Forecast, 2019-2031
- 14.1. Market Analysis, Insights and Forecast - By Country/Sub-region
- 14.1.1. undefined
- 15. South America Monoclonal Antibody Contract Manufacturing Industry Analysis, Insights and Forecast, 2019-2031
- 15.1. Market Analysis, Insights and Forecast - By Country/Sub-region
- 15.1.1. undefined
- 16. Competitive Analysis
- 16.1. Global Market Share Analysis 2024
- 16.2. Company Profiles
- 16.2.1 Cerbios-Pharma SA
- 16.2.1.1. Overview
- 16.2.1.2. Products
- 16.2.1.3. SWOT Analysis
- 16.2.1.4. Recent Developments
- 16.2.1.5. Financials (Based on Availability)
- 16.2.2 Recipharm
- 16.2.2.1. Overview
- 16.2.2.2. Products
- 16.2.2.3. SWOT Analysis
- 16.2.2.4. Recent Developments
- 16.2.2.5. Financials (Based on Availability)
- 16.2.3 Merck KGaA
- 16.2.3.1. Overview
- 16.2.3.2. Products
- 16.2.3.3. SWOT Analysis
- 16.2.3.4. Recent Developments
- 16.2.3.5. Financials (Based on Availability)
- 16.2.4 Lonza Group
- 16.2.4.1. Overview
- 16.2.4.2. Products
- 16.2.4.3. SWOT Analysis
- 16.2.4.4. Recent Developments
- 16.2.4.5. Financials (Based on Availability)
- 16.2.5 Thermo Fisher Scientific Inc
- 16.2.5.1. Overview
- 16.2.5.2. Products
- 16.2.5.3. SWOT Analysis
- 16.2.5.4. Recent Developments
- 16.2.5.5. Financials (Based on Availability)
- 16.2.6 Piramal Pharma Solutions
- 16.2.6.1. Overview
- 16.2.6.2. Products
- 16.2.6.3. SWOT Analysis
- 16.2.6.4. Recent Developments
- 16.2.6.5. Financials (Based on Availability)
- 16.2.7 Abbvie Inc
- 16.2.7.1. Overview
- 16.2.7.2. Products
- 16.2.7.3. SWOT Analysis
- 16.2.7.4. Recent Developments
- 16.2.7.5. Financials (Based on Availability)
- 16.2.8 Sterling Pharma Solutions
- 16.2.8.1. Overview
- 16.2.8.2. Products
- 16.2.8.3. SWOT Analysis
- 16.2.8.4. Recent Developments
- 16.2.8.5. Financials (Based on Availability)
- 16.2.9 Novasep
- 16.2.9.1. Overview
- 16.2.9.2. Products
- 16.2.9.3. SWOT Analysis
- 16.2.9.4. Recent Developments
- 16.2.9.5. Financials (Based on Availability)
- 16.2.10 Cambrex Corporation
- 16.2.10.1. Overview
- 16.2.10.2. Products
- 16.2.10.3. SWOT Analysis
- 16.2.10.4. Recent Developments
- 16.2.10.5. Financials (Based on Availability)
- 16.2.1 Cerbios-Pharma SA
List of Figures
- Figure 1: Global Monoclonal Antibody Contract Manufacturing Industry Revenue Breakdown (Million, %) by Region 2024 & 2032
- Figure 2: Global Monoclonal Antibody Contract Manufacturing Industry Volume Breakdown (K Unit, %) by Region 2024 & 2032
- Figure 3: North America Monoclonal Antibody Contract Manufacturing Industry Revenue (Million), by Country 2024 & 2032
- Figure 4: North America Monoclonal Antibody Contract Manufacturing Industry Volume (K Unit), by Country 2024 & 2032
- Figure 5: North America Monoclonal Antibody Contract Manufacturing Industry Revenue Share (%), by Country 2024 & 2032
- Figure 6: North America Monoclonal Antibody Contract Manufacturing Industry Volume Share (%), by Country 2024 & 2032
- Figure 7: Europe Monoclonal Antibody Contract Manufacturing Industry Revenue (Million), by Country 2024 & 2032
- Figure 8: Europe Monoclonal Antibody Contract Manufacturing Industry Volume (K Unit), by Country 2024 & 2032
- Figure 9: Europe Monoclonal Antibody Contract Manufacturing Industry Revenue Share (%), by Country 2024 & 2032
- Figure 10: Europe Monoclonal Antibody Contract Manufacturing Industry Volume Share (%), by Country 2024 & 2032
- Figure 11: Asia Pacific Monoclonal Antibody Contract Manufacturing Industry Revenue (Million), by Country 2024 & 2032
- Figure 12: Asia Pacific Monoclonal Antibody Contract Manufacturing Industry Volume (K Unit), by Country 2024 & 2032
- Figure 13: Asia Pacific Monoclonal Antibody Contract Manufacturing Industry Revenue Share (%), by Country 2024 & 2032
- Figure 14: Asia Pacific Monoclonal Antibody Contract Manufacturing Industry Volume Share (%), by Country 2024 & 2032
- Figure 15: Middle East and Africa Monoclonal Antibody Contract Manufacturing Industry Revenue (Million), by Country 2024 & 2032
- Figure 16: Middle East and Africa Monoclonal Antibody Contract Manufacturing Industry Volume (K Unit), by Country 2024 & 2032
- Figure 17: Middle East and Africa Monoclonal Antibody Contract Manufacturing Industry Revenue Share (%), by Country 2024 & 2032
- Figure 18: Middle East and Africa Monoclonal Antibody Contract Manufacturing Industry Volume Share (%), by Country 2024 & 2032
- Figure 19: South America Monoclonal Antibody Contract Manufacturing Industry Revenue (Million), by Country 2024 & 2032
- Figure 20: South America Monoclonal Antibody Contract Manufacturing Industry Volume (K Unit), by Country 2024 & 2032
- Figure 21: South America Monoclonal Antibody Contract Manufacturing Industry Revenue Share (%), by Country 2024 & 2032
- Figure 22: South America Monoclonal Antibody Contract Manufacturing Industry Volume Share (%), by Country 2024 & 2032
- Figure 23: North America Monoclonal Antibody Contract Manufacturing Industry Revenue (Million), by Linker 2024 & 2032
- Figure 24: North America Monoclonal Antibody Contract Manufacturing Industry Volume (K Unit), by Linker 2024 & 2032
- Figure 25: North America Monoclonal Antibody Contract Manufacturing Industry Revenue Share (%), by Linker 2024 & 2032
- Figure 26: North America Monoclonal Antibody Contract Manufacturing Industry Volume Share (%), by Linker 2024 & 2032
- Figure 27: North America Monoclonal Antibody Contract Manufacturing Industry Revenue (Million), by Application 2024 & 2032
- Figure 28: North America Monoclonal Antibody Contract Manufacturing Industry Volume (K Unit), by Application 2024 & 2032
- Figure 29: North America Monoclonal Antibody Contract Manufacturing Industry Revenue Share (%), by Application 2024 & 2032
- Figure 30: North America Monoclonal Antibody Contract Manufacturing Industry Volume Share (%), by Application 2024 & 2032
- Figure 31: North America Monoclonal Antibody Contract Manufacturing Industry Revenue (Million), by Phase 2024 & 2032
- Figure 32: North America Monoclonal Antibody Contract Manufacturing Industry Volume (K Unit), by Phase 2024 & 2032
- Figure 33: North America Monoclonal Antibody Contract Manufacturing Industry Revenue Share (%), by Phase 2024 & 2032
- Figure 34: North America Monoclonal Antibody Contract Manufacturing Industry Volume Share (%), by Phase 2024 & 2032
- Figure 35: North America Monoclonal Antibody Contract Manufacturing Industry Revenue (Million), by Country 2024 & 2032
- Figure 36: North America Monoclonal Antibody Contract Manufacturing Industry Volume (K Unit), by Country 2024 & 2032
- Figure 37: North America Monoclonal Antibody Contract Manufacturing Industry Revenue Share (%), by Country 2024 & 2032
- Figure 38: North America Monoclonal Antibody Contract Manufacturing Industry Volume Share (%), by Country 2024 & 2032
- Figure 39: Europe Monoclonal Antibody Contract Manufacturing Industry Revenue (Million), by Linker 2024 & 2032
- Figure 40: Europe Monoclonal Antibody Contract Manufacturing Industry Volume (K Unit), by Linker 2024 & 2032
- Figure 41: Europe Monoclonal Antibody Contract Manufacturing Industry Revenue Share (%), by Linker 2024 & 2032
- Figure 42: Europe Monoclonal Antibody Contract Manufacturing Industry Volume Share (%), by Linker 2024 & 2032
- Figure 43: Europe Monoclonal Antibody Contract Manufacturing Industry Revenue (Million), by Application 2024 & 2032
- Figure 44: Europe Monoclonal Antibody Contract Manufacturing Industry Volume (K Unit), by Application 2024 & 2032
- Figure 45: Europe Monoclonal Antibody Contract Manufacturing Industry Revenue Share (%), by Application 2024 & 2032
- Figure 46: Europe Monoclonal Antibody Contract Manufacturing Industry Volume Share (%), by Application 2024 & 2032
- Figure 47: Europe Monoclonal Antibody Contract Manufacturing Industry Revenue (Million), by Phase 2024 & 2032
- Figure 48: Europe Monoclonal Antibody Contract Manufacturing Industry Volume (K Unit), by Phase 2024 & 2032
- Figure 49: Europe Monoclonal Antibody Contract Manufacturing Industry Revenue Share (%), by Phase 2024 & 2032
- Figure 50: Europe Monoclonal Antibody Contract Manufacturing Industry Volume Share (%), by Phase 2024 & 2032
- Figure 51: Europe Monoclonal Antibody Contract Manufacturing Industry Revenue (Million), by Country 2024 & 2032
- Figure 52: Europe Monoclonal Antibody Contract Manufacturing Industry Volume (K Unit), by Country 2024 & 2032
- Figure 53: Europe Monoclonal Antibody Contract Manufacturing Industry Revenue Share (%), by Country 2024 & 2032
- Figure 54: Europe Monoclonal Antibody Contract Manufacturing Industry Volume Share (%), by Country 2024 & 2032
- Figure 55: Asia Pacific Monoclonal Antibody Contract Manufacturing Industry Revenue (Million), by Linker 2024 & 2032
- Figure 56: Asia Pacific Monoclonal Antibody Contract Manufacturing Industry Volume (K Unit), by Linker 2024 & 2032
- Figure 57: Asia Pacific Monoclonal Antibody Contract Manufacturing Industry Revenue Share (%), by Linker 2024 & 2032
- Figure 58: Asia Pacific Monoclonal Antibody Contract Manufacturing Industry Volume Share (%), by Linker 2024 & 2032
- Figure 59: Asia Pacific Monoclonal Antibody Contract Manufacturing Industry Revenue (Million), by Application 2024 & 2032
- Figure 60: Asia Pacific Monoclonal Antibody Contract Manufacturing Industry Volume (K Unit), by Application 2024 & 2032
- Figure 61: Asia Pacific Monoclonal Antibody Contract Manufacturing Industry Revenue Share (%), by Application 2024 & 2032
- Figure 62: Asia Pacific Monoclonal Antibody Contract Manufacturing Industry Volume Share (%), by Application 2024 & 2032
- Figure 63: Asia Pacific Monoclonal Antibody Contract Manufacturing Industry Revenue (Million), by Phase 2024 & 2032
- Figure 64: Asia Pacific Monoclonal Antibody Contract Manufacturing Industry Volume (K Unit), by Phase 2024 & 2032
- Figure 65: Asia Pacific Monoclonal Antibody Contract Manufacturing Industry Revenue Share (%), by Phase 2024 & 2032
- Figure 66: Asia Pacific Monoclonal Antibody Contract Manufacturing Industry Volume Share (%), by Phase 2024 & 2032
- Figure 67: Asia Pacific Monoclonal Antibody Contract Manufacturing Industry Revenue (Million), by Country 2024 & 2032
- Figure 68: Asia Pacific Monoclonal Antibody Contract Manufacturing Industry Volume (K Unit), by Country 2024 & 2032
- Figure 69: Asia Pacific Monoclonal Antibody Contract Manufacturing Industry Revenue Share (%), by Country 2024 & 2032
- Figure 70: Asia Pacific Monoclonal Antibody Contract Manufacturing Industry Volume Share (%), by Country 2024 & 2032
- Figure 71: Middle East and Africa Monoclonal Antibody Contract Manufacturing Industry Revenue (Million), by Linker 2024 & 2032
- Figure 72: Middle East and Africa Monoclonal Antibody Contract Manufacturing Industry Volume (K Unit), by Linker 2024 & 2032
- Figure 73: Middle East and Africa Monoclonal Antibody Contract Manufacturing Industry Revenue Share (%), by Linker 2024 & 2032
- Figure 74: Middle East and Africa Monoclonal Antibody Contract Manufacturing Industry Volume Share (%), by Linker 2024 & 2032
- Figure 75: Middle East and Africa Monoclonal Antibody Contract Manufacturing Industry Revenue (Million), by Application 2024 & 2032
- Figure 76: Middle East and Africa Monoclonal Antibody Contract Manufacturing Industry Volume (K Unit), by Application 2024 & 2032
- Figure 77: Middle East and Africa Monoclonal Antibody Contract Manufacturing Industry Revenue Share (%), by Application 2024 & 2032
- Figure 78: Middle East and Africa Monoclonal Antibody Contract Manufacturing Industry Volume Share (%), by Application 2024 & 2032
- Figure 79: Middle East and Africa Monoclonal Antibody Contract Manufacturing Industry Revenue (Million), by Phase 2024 & 2032
- Figure 80: Middle East and Africa Monoclonal Antibody Contract Manufacturing Industry Volume (K Unit), by Phase 2024 & 2032
- Figure 81: Middle East and Africa Monoclonal Antibody Contract Manufacturing Industry Revenue Share (%), by Phase 2024 & 2032
- Figure 82: Middle East and Africa Monoclonal Antibody Contract Manufacturing Industry Volume Share (%), by Phase 2024 & 2032
- Figure 83: Middle East and Africa Monoclonal Antibody Contract Manufacturing Industry Revenue (Million), by Country 2024 & 2032
- Figure 84: Middle East and Africa Monoclonal Antibody Contract Manufacturing Industry Volume (K Unit), by Country 2024 & 2032
- Figure 85: Middle East and Africa Monoclonal Antibody Contract Manufacturing Industry Revenue Share (%), by Country 2024 & 2032
- Figure 86: Middle East and Africa Monoclonal Antibody Contract Manufacturing Industry Volume Share (%), by Country 2024 & 2032
- Figure 87: South America Monoclonal Antibody Contract Manufacturing Industry Revenue (Million), by Linker 2024 & 2032
- Figure 88: South America Monoclonal Antibody Contract Manufacturing Industry Volume (K Unit), by Linker 2024 & 2032
- Figure 89: South America Monoclonal Antibody Contract Manufacturing Industry Revenue Share (%), by Linker 2024 & 2032
- Figure 90: South America Monoclonal Antibody Contract Manufacturing Industry Volume Share (%), by Linker 2024 & 2032
- Figure 91: South America Monoclonal Antibody Contract Manufacturing Industry Revenue (Million), by Application 2024 & 2032
- Figure 92: South America Monoclonal Antibody Contract Manufacturing Industry Volume (K Unit), by Application 2024 & 2032
- Figure 93: South America Monoclonal Antibody Contract Manufacturing Industry Revenue Share (%), by Application 2024 & 2032
- Figure 94: South America Monoclonal Antibody Contract Manufacturing Industry Volume Share (%), by Application 2024 & 2032
- Figure 95: South America Monoclonal Antibody Contract Manufacturing Industry Revenue (Million), by Phase 2024 & 2032
- Figure 96: South America Monoclonal Antibody Contract Manufacturing Industry Volume (K Unit), by Phase 2024 & 2032
- Figure 97: South America Monoclonal Antibody Contract Manufacturing Industry Revenue Share (%), by Phase 2024 & 2032
- Figure 98: South America Monoclonal Antibody Contract Manufacturing Industry Volume Share (%), by Phase 2024 & 2032
- Figure 99: South America Monoclonal Antibody Contract Manufacturing Industry Revenue (Million), by Country 2024 & 2032
- Figure 100: South America Monoclonal Antibody Contract Manufacturing Industry Volume (K Unit), by Country 2024 & 2032
- Figure 101: South America Monoclonal Antibody Contract Manufacturing Industry Revenue Share (%), by Country 2024 & 2032
- Figure 102: South America Monoclonal Antibody Contract Manufacturing Industry Volume Share (%), by Country 2024 & 2032
List of Tables
- Table 1: Global Monoclonal Antibody Contract Manufacturing Industry Revenue Million Forecast, by Region 2019 & 2032
- Table 2: Global Monoclonal Antibody Contract Manufacturing Industry Volume K Unit Forecast, by Region 2019 & 2032
- Table 3: Global Monoclonal Antibody Contract Manufacturing Industry Revenue Million Forecast, by Linker 2019 & 2032
- Table 4: Global Monoclonal Antibody Contract Manufacturing Industry Volume K Unit Forecast, by Linker 2019 & 2032
- Table 5: Global Monoclonal Antibody Contract Manufacturing Industry Revenue Million Forecast, by Application 2019 & 2032
- Table 6: Global Monoclonal Antibody Contract Manufacturing Industry Volume K Unit Forecast, by Application 2019 & 2032
- Table 7: Global Monoclonal Antibody Contract Manufacturing Industry Revenue Million Forecast, by Phase 2019 & 2032
- Table 8: Global Monoclonal Antibody Contract Manufacturing Industry Volume K Unit Forecast, by Phase 2019 & 2032
- Table 9: Global Monoclonal Antibody Contract Manufacturing Industry Revenue Million Forecast, by Region 2019 & 2032
- Table 10: Global Monoclonal Antibody Contract Manufacturing Industry Volume K Unit Forecast, by Region 2019 & 2032
- Table 11: Global Monoclonal Antibody Contract Manufacturing Industry Revenue Million Forecast, by Country 2019 & 2032
- Table 12: Global Monoclonal Antibody Contract Manufacturing Industry Volume K Unit Forecast, by Country 2019 & 2032
- Table 13: Global Monoclonal Antibody Contract Manufacturing Industry Revenue Million Forecast, by Country 2019 & 2032
- Table 14: Global Monoclonal Antibody Contract Manufacturing Industry Volume K Unit Forecast, by Country 2019 & 2032
- Table 15: Global Monoclonal Antibody Contract Manufacturing Industry Revenue Million Forecast, by Country 2019 & 2032
- Table 16: Global Monoclonal Antibody Contract Manufacturing Industry Volume K Unit Forecast, by Country 2019 & 2032
- Table 17: Global Monoclonal Antibody Contract Manufacturing Industry Revenue Million Forecast, by Country 2019 & 2032
- Table 18: Global Monoclonal Antibody Contract Manufacturing Industry Volume K Unit Forecast, by Country 2019 & 2032
- Table 19: Global Monoclonal Antibody Contract Manufacturing Industry Revenue Million Forecast, by Country 2019 & 2032
- Table 20: Global Monoclonal Antibody Contract Manufacturing Industry Volume K Unit Forecast, by Country 2019 & 2032
- Table 21: Global Monoclonal Antibody Contract Manufacturing Industry Revenue Million Forecast, by Linker 2019 & 2032
- Table 22: Global Monoclonal Antibody Contract Manufacturing Industry Volume K Unit Forecast, by Linker 2019 & 2032
- Table 23: Global Monoclonal Antibody Contract Manufacturing Industry Revenue Million Forecast, by Application 2019 & 2032
- Table 24: Global Monoclonal Antibody Contract Manufacturing Industry Volume K Unit Forecast, by Application 2019 & 2032
- Table 25: Global Monoclonal Antibody Contract Manufacturing Industry Revenue Million Forecast, by Phase 2019 & 2032
- Table 26: Global Monoclonal Antibody Contract Manufacturing Industry Volume K Unit Forecast, by Phase 2019 & 2032
- Table 27: Global Monoclonal Antibody Contract Manufacturing Industry Revenue Million Forecast, by Country 2019 & 2032
- Table 28: Global Monoclonal Antibody Contract Manufacturing Industry Volume K Unit Forecast, by Country 2019 & 2032
- Table 29: United States Monoclonal Antibody Contract Manufacturing Industry Revenue (Million) Forecast, by Application 2019 & 2032
- Table 30: United States Monoclonal Antibody Contract Manufacturing Industry Volume (K Unit) Forecast, by Application 2019 & 2032
- Table 31: Canada Monoclonal Antibody Contract Manufacturing Industry Revenue (Million) Forecast, by Application 2019 & 2032
- Table 32: Canada Monoclonal Antibody Contract Manufacturing Industry Volume (K Unit) Forecast, by Application 2019 & 2032
- Table 33: Mexico Monoclonal Antibody Contract Manufacturing Industry Revenue (Million) Forecast, by Application 2019 & 2032
- Table 34: Mexico Monoclonal Antibody Contract Manufacturing Industry Volume (K Unit) Forecast, by Application 2019 & 2032
- Table 35: Global Monoclonal Antibody Contract Manufacturing Industry Revenue Million Forecast, by Linker 2019 & 2032
- Table 36: Global Monoclonal Antibody Contract Manufacturing Industry Volume K Unit Forecast, by Linker 2019 & 2032
- Table 37: Global Monoclonal Antibody Contract Manufacturing Industry Revenue Million Forecast, by Application 2019 & 2032
- Table 38: Global Monoclonal Antibody Contract Manufacturing Industry Volume K Unit Forecast, by Application 2019 & 2032
- Table 39: Global Monoclonal Antibody Contract Manufacturing Industry Revenue Million Forecast, by Phase 2019 & 2032
- Table 40: Global Monoclonal Antibody Contract Manufacturing Industry Volume K Unit Forecast, by Phase 2019 & 2032
- Table 41: Global Monoclonal Antibody Contract Manufacturing Industry Revenue Million Forecast, by Country 2019 & 2032
- Table 42: Global Monoclonal Antibody Contract Manufacturing Industry Volume K Unit Forecast, by Country 2019 & 2032
- Table 43: Germany Monoclonal Antibody Contract Manufacturing Industry Revenue (Million) Forecast, by Application 2019 & 2032
- Table 44: Germany Monoclonal Antibody Contract Manufacturing Industry Volume (K Unit) Forecast, by Application 2019 & 2032
- Table 45: United Kingdom Monoclonal Antibody Contract Manufacturing Industry Revenue (Million) Forecast, by Application 2019 & 2032
- Table 46: United Kingdom Monoclonal Antibody Contract Manufacturing Industry Volume (K Unit) Forecast, by Application 2019 & 2032
- Table 47: France Monoclonal Antibody Contract Manufacturing Industry Revenue (Million) Forecast, by Application 2019 & 2032
- Table 48: France Monoclonal Antibody Contract Manufacturing Industry Volume (K Unit) Forecast, by Application 2019 & 2032
- Table 49: Italy Monoclonal Antibody Contract Manufacturing Industry Revenue (Million) Forecast, by Application 2019 & 2032
- Table 50: Italy Monoclonal Antibody Contract Manufacturing Industry Volume (K Unit) Forecast, by Application 2019 & 2032
- Table 51: Spain Monoclonal Antibody Contract Manufacturing Industry Revenue (Million) Forecast, by Application 2019 & 2032
- Table 52: Spain Monoclonal Antibody Contract Manufacturing Industry Volume (K Unit) Forecast, by Application 2019 & 2032
- Table 53: Rest of Europe Monoclonal Antibody Contract Manufacturing Industry Revenue (Million) Forecast, by Application 2019 & 2032
- Table 54: Rest of Europe Monoclonal Antibody Contract Manufacturing Industry Volume (K Unit) Forecast, by Application 2019 & 2032
- Table 55: Global Monoclonal Antibody Contract Manufacturing Industry Revenue Million Forecast, by Linker 2019 & 2032
- Table 56: Global Monoclonal Antibody Contract Manufacturing Industry Volume K Unit Forecast, by Linker 2019 & 2032
- Table 57: Global Monoclonal Antibody Contract Manufacturing Industry Revenue Million Forecast, by Application 2019 & 2032
- Table 58: Global Monoclonal Antibody Contract Manufacturing Industry Volume K Unit Forecast, by Application 2019 & 2032
- Table 59: Global Monoclonal Antibody Contract Manufacturing Industry Revenue Million Forecast, by Phase 2019 & 2032
- Table 60: Global Monoclonal Antibody Contract Manufacturing Industry Volume K Unit Forecast, by Phase 2019 & 2032
- Table 61: Global Monoclonal Antibody Contract Manufacturing Industry Revenue Million Forecast, by Country 2019 & 2032
- Table 62: Global Monoclonal Antibody Contract Manufacturing Industry Volume K Unit Forecast, by Country 2019 & 2032
- Table 63: China Monoclonal Antibody Contract Manufacturing Industry Revenue (Million) Forecast, by Application 2019 & 2032
- Table 64: China Monoclonal Antibody Contract Manufacturing Industry Volume (K Unit) Forecast, by Application 2019 & 2032
- Table 65: Japan Monoclonal Antibody Contract Manufacturing Industry Revenue (Million) Forecast, by Application 2019 & 2032
- Table 66: Japan Monoclonal Antibody Contract Manufacturing Industry Volume (K Unit) Forecast, by Application 2019 & 2032
- Table 67: India Monoclonal Antibody Contract Manufacturing Industry Revenue (Million) Forecast, by Application 2019 & 2032
- Table 68: India Monoclonal Antibody Contract Manufacturing Industry Volume (K Unit) Forecast, by Application 2019 & 2032
- Table 69: Australia Monoclonal Antibody Contract Manufacturing Industry Revenue (Million) Forecast, by Application 2019 & 2032
- Table 70: Australia Monoclonal Antibody Contract Manufacturing Industry Volume (K Unit) Forecast, by Application 2019 & 2032
- Table 71: South Korea Monoclonal Antibody Contract Manufacturing Industry Revenue (Million) Forecast, by Application 2019 & 2032
- Table 72: South Korea Monoclonal Antibody Contract Manufacturing Industry Volume (K Unit) Forecast, by Application 2019 & 2032
- Table 73: Rest of Asia Pacific Monoclonal Antibody Contract Manufacturing Industry Revenue (Million) Forecast, by Application 2019 & 2032
- Table 74: Rest of Asia Pacific Monoclonal Antibody Contract Manufacturing Industry Volume (K Unit) Forecast, by Application 2019 & 2032
- Table 75: Global Monoclonal Antibody Contract Manufacturing Industry Revenue Million Forecast, by Linker 2019 & 2032
- Table 76: Global Monoclonal Antibody Contract Manufacturing Industry Volume K Unit Forecast, by Linker 2019 & 2032
- Table 77: Global Monoclonal Antibody Contract Manufacturing Industry Revenue Million Forecast, by Application 2019 & 2032
- Table 78: Global Monoclonal Antibody Contract Manufacturing Industry Volume K Unit Forecast, by Application 2019 & 2032
- Table 79: Global Monoclonal Antibody Contract Manufacturing Industry Revenue Million Forecast, by Phase 2019 & 2032
- Table 80: Global Monoclonal Antibody Contract Manufacturing Industry Volume K Unit Forecast, by Phase 2019 & 2032
- Table 81: Global Monoclonal Antibody Contract Manufacturing Industry Revenue Million Forecast, by Country 2019 & 2032
- Table 82: Global Monoclonal Antibody Contract Manufacturing Industry Volume K Unit Forecast, by Country 2019 & 2032
- Table 83: GCC Monoclonal Antibody Contract Manufacturing Industry Revenue (Million) Forecast, by Application 2019 & 2032
- Table 84: GCC Monoclonal Antibody Contract Manufacturing Industry Volume (K Unit) Forecast, by Application 2019 & 2032
- Table 85: South Africa Monoclonal Antibody Contract Manufacturing Industry Revenue (Million) Forecast, by Application 2019 & 2032
- Table 86: South Africa Monoclonal Antibody Contract Manufacturing Industry Volume (K Unit) Forecast, by Application 2019 & 2032
- Table 87: Rest of Middle East and Africa Monoclonal Antibody Contract Manufacturing Industry Revenue (Million) Forecast, by Application 2019 & 2032
- Table 88: Rest of Middle East and Africa Monoclonal Antibody Contract Manufacturing Industry Volume (K Unit) Forecast, by Application 2019 & 2032
- Table 89: Global Monoclonal Antibody Contract Manufacturing Industry Revenue Million Forecast, by Linker 2019 & 2032
- Table 90: Global Monoclonal Antibody Contract Manufacturing Industry Volume K Unit Forecast, by Linker 2019 & 2032
- Table 91: Global Monoclonal Antibody Contract Manufacturing Industry Revenue Million Forecast, by Application 2019 & 2032
- Table 92: Global Monoclonal Antibody Contract Manufacturing Industry Volume K Unit Forecast, by Application 2019 & 2032
- Table 93: Global Monoclonal Antibody Contract Manufacturing Industry Revenue Million Forecast, by Phase 2019 & 2032
- Table 94: Global Monoclonal Antibody Contract Manufacturing Industry Volume K Unit Forecast, by Phase 2019 & 2032
- Table 95: Global Monoclonal Antibody Contract Manufacturing Industry Revenue Million Forecast, by Country 2019 & 2032
- Table 96: Global Monoclonal Antibody Contract Manufacturing Industry Volume K Unit Forecast, by Country 2019 & 2032
- Table 97: Brazil Monoclonal Antibody Contract Manufacturing Industry Revenue (Million) Forecast, by Application 2019 & 2032
- Table 98: Brazil Monoclonal Antibody Contract Manufacturing Industry Volume (K Unit) Forecast, by Application 2019 & 2032
- Table 99: Argentina Monoclonal Antibody Contract Manufacturing Industry Revenue (Million) Forecast, by Application 2019 & 2032
- Table 100: Argentina Monoclonal Antibody Contract Manufacturing Industry Volume (K Unit) Forecast, by Application 2019 & 2032
- Table 101: Rest of South America Monoclonal Antibody Contract Manufacturing Industry Revenue (Million) Forecast, by Application 2019 & 2032
- Table 102: Rest of South America Monoclonal Antibody Contract Manufacturing Industry Volume (K Unit) Forecast, by Application 2019 & 2032
Frequently Asked Questions
1. What is the projected Compound Annual Growth Rate (CAGR) of the Monoclonal Antibody Contract Manufacturing Industry?
The projected CAGR is approximately 12.50%.
2. Which companies are prominent players in the Monoclonal Antibody Contract Manufacturing Industry?
Key companies in the market include Cerbios-Pharma SA, Recipharm, Merck KGaA, Lonza Group, Thermo Fisher Scientific Inc, Piramal Pharma Solutions, Abbvie Inc, Sterling Pharma Solutions, Novasep, Cambrex Corporation.
3. What are the main segments of the Monoclonal Antibody Contract Manufacturing Industry?
The market segments include Linker, Application, Phase.
4. Can you provide details about the market size?
The market size is estimated to be USD XX Million as of 2022.
5. What are some drivers contributing to market growth?
Increasing burden of Cancer Cases; Increasing R&D Activities Pertaining to Antibody Drug Conjugates; Growing Demand for Biologic Therapy.
6. What are the notable trends driving market growth?
The Cleavable Linker Segment is Expected to Hold a Major Market Share in the Antibody-Drug Conjugates Contract Manufacturing Market.
7. Are there any restraints impacting market growth?
R&D and Production Challenges.
8. Can you provide examples of recent developments in the market?
July 2022: WuXi XDC and AbTis signed a memorandum of understanding to form a partnership to develop and manufacture antibody-drug conjugates.
9. What pricing options are available for accessing the report?
Pricing options include single-user, multi-user, and enterprise licenses priced at USD 4750, USD 5250, and USD 8750 respectively.
10. Is the market size provided in terms of value or volume?
The market size is provided in terms of value, measured in Million and volume, measured in K Unit.
11. Are there any specific market keywords associated with the report?
Yes, the market keyword associated with the report is "Monoclonal Antibody Contract Manufacturing Industry," which aids in identifying and referencing the specific market segment covered.
12. How do I determine which pricing option suits my needs best?
The pricing options vary based on user requirements and access needs. Individual users may opt for single-user licenses, while businesses requiring broader access may choose multi-user or enterprise licenses for cost-effective access to the report.
13. Are there any additional resources or data provided in the Monoclonal Antibody Contract Manufacturing Industry report?
While the report offers comprehensive insights, it's advisable to review the specific contents or supplementary materials provided to ascertain if additional resources or data are available.
14. How can I stay updated on further developments or reports in the Monoclonal Antibody Contract Manufacturing Industry?
To stay informed about further developments, trends, and reports in the Monoclonal Antibody Contract Manufacturing Industry, consider subscribing to industry newsletters, following relevant companies and organizations, or regularly checking reputable industry news sources and publications.
Methodology
Step 1 - Identification of Relevant Samples Size from Population Database


Step 2 - Approaches for Defining Global Market Size (Value, Volume* & Price*)

Note*: In applicable scenarios
Step 3 - Data Sources
Primary Research
- Web Analytics
- Survey Reports
- Research Institute
- Latest Research Reports
- Opinion Leaders
Secondary Research
- Annual Reports
- White Paper
- Latest Press Release
- Industry Association
- Paid Database
- Investor Presentations

Step 4 - Data Triangulation
Involves using different sources of information in order to increase the validity of a study
These sources are likely to be stakeholders in a program - participants, other researchers, program staff, other community members, and so on.
Then we put all data in single framework & apply various statistical tools to find out the dynamic on the market.
During the analysis stage, feedback from the stakeholder groups would be compared to determine areas of agreement as well as areas of divergence


