
Key Insights
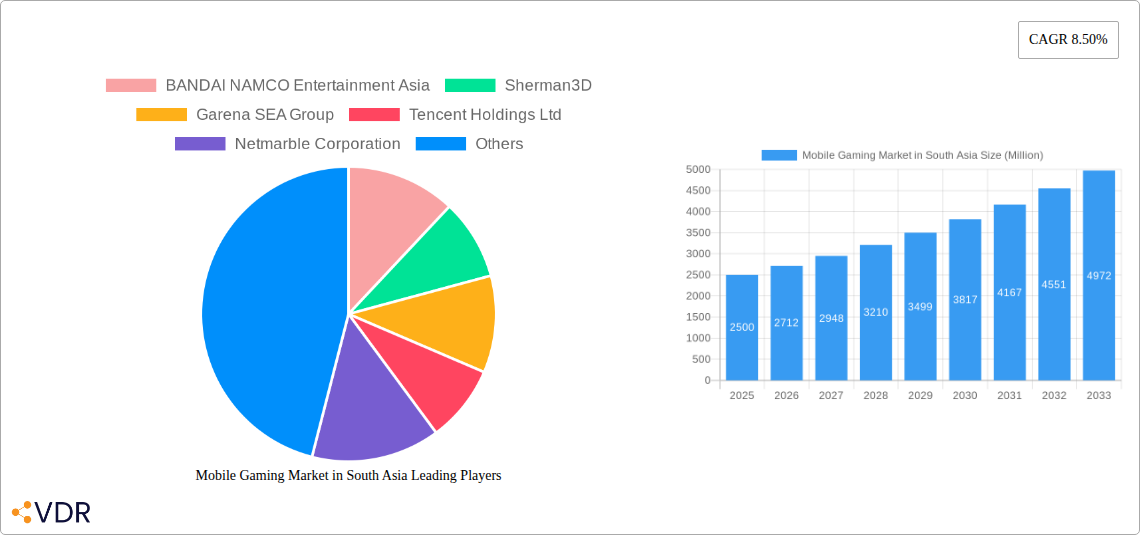
The South Asian mobile gaming market is experiencing robust growth, fueled by increasing smartphone penetration, affordable data plans, and a burgeoning young population eager to engage with interactive entertainment. While precise market size figures for South Asia aren't provided, we can extrapolate based on the global CAGR of 8.5% and regional growth patterns. Considering the significant growth potential in countries like India, the market is likely experiencing a higher CAGR than the global average, potentially reaching a valuation in the billions within the forecast period (2025-2033). Key drivers include the rising popularity of esports, the localization of games for diverse regional preferences, and the increasing adoption of in-app purchases. Trends suggest a shift towards casual and hyper-casual games, alongside the continued popularity of battle royale and massively multiplayer online (MMO) titles. However, challenges remain, including infrastructure limitations in certain areas, concerns about game addiction, and competition from other entertainment forms. The segment dominated by Android devices due to its affordability and accessibility across South Asia, though the iOS segment is also witnessing a steady increase as disposable income grows. Prominent players like Tencent, Netmarble, and Garena are strategically investing in the region, leveraging their global expertise to cater to the unique demands of the South Asian market. This competition fosters innovation and pushes boundaries in game development, user experience, and monetization strategies.
The competitive landscape includes both international giants and regional players, indicating a dynamic market with opportunities for both established companies and emerging startups. Further growth hinges on addressing infrastructural challenges, promoting responsible gaming practices, and catering to evolving consumer preferences. The diverse linguistic and cultural landscape of South Asia presents unique opportunities for game developers to create localized experiences that resonate with the region's diverse population, driving even stronger market expansion in the coming years. Continued investment in high-quality, culturally relevant games will be crucial for continued success.
Mobile Gaming Market in South Asia: A Comprehensive Market Report (2019-2033)
This in-depth report provides a comprehensive analysis of the rapidly expanding mobile gaming market in South Asia, covering market dynamics, growth trends, dominant segments, and key players. The study period spans from 2019 to 2033, with 2025 serving as the base and estimated year. The forecast period covers 2025-2033, and the historical period encompasses 2019-2024. This report is invaluable for industry professionals, investors, and strategic decision-makers seeking to understand and capitalize on the immense opportunities within this dynamic market.
Mobile Gaming Market in South Asia Market Dynamics & Structure
The South Asian mobile gaming market is characterized by high growth potential, driven by increasing smartphone penetration, affordable data plans, and a burgeoning young population. Market concentration is moderate, with a few dominant players and numerous smaller, regional competitors. Technological innovation, particularly in areas like augmented reality (AR) and cloud gaming, is a significant driver. Regulatory frameworks vary across countries, impacting market access and content moderation. Competitive product substitutes, such as other forms of entertainment and social media, pose a challenge. End-user demographics skew towards younger age groups, with a significant male majority. M&A activity has been steadily increasing, as larger companies seek to consolidate their market share.
- Market Concentration: Moderate, with a few dominant players holding approximately xx% of the market share.
- Technological Innovation: AR/VR integration, cloud gaming, and improved graphics are key drivers.
- Regulatory Frameworks: Vary across countries, impacting game approvals and content restrictions.
- Competitive Substitutes: Social media, streaming services, and traditional gaming consoles.
- End-User Demographics: Predominantly young adults (18-35), with a higher male-to-female ratio (xx:xx).
- M&A Trends: Increasing consolidation, with xx major deals recorded in the past five years.
Mobile Gaming Market in South Asia Growth Trends & Insights
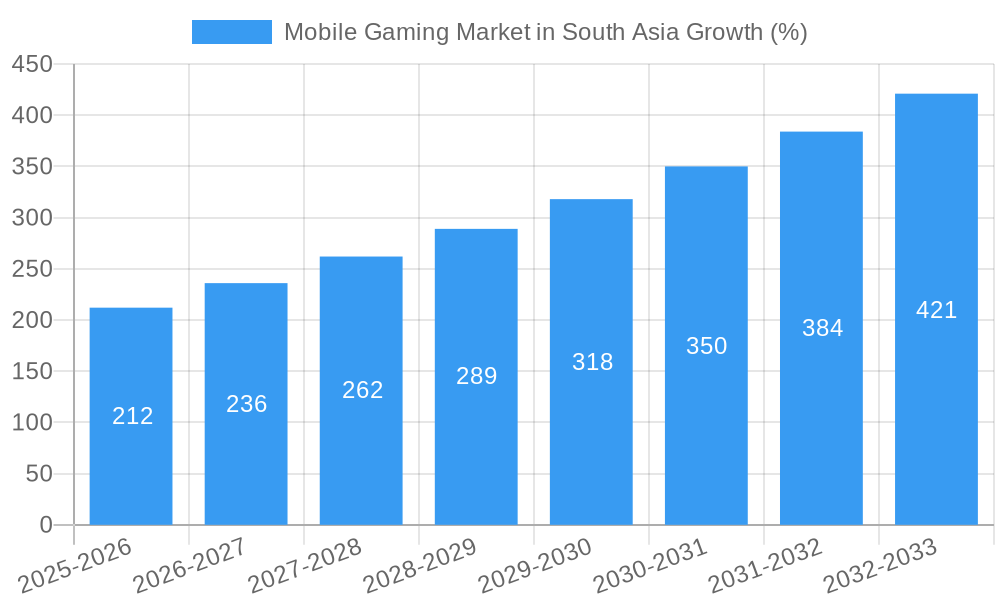
The South Asian mobile gaming market has experienced significant growth in the past few years and is projected to continue this trajectory. Driven by rising smartphone penetration, increasing internet access, and a burgeoning young population, the market is exhibiting a Compound Annual Growth Rate (CAGR) of xx% from 2019 to 2024. Market penetration is currently at xx%, with significant potential for further growth. Technological disruptions, such as the introduction of 5G and improved mobile hardware, are fueling innovation and enhancing the gaming experience. Consumer behavior is shifting towards more casual and mobile-first gaming experiences, reflecting evolving preferences and lifestyles. The market size is estimated at xx million units in 2025, projected to reach xx million units by 2033. Increased engagement in esports also contributes significantly to market growth.
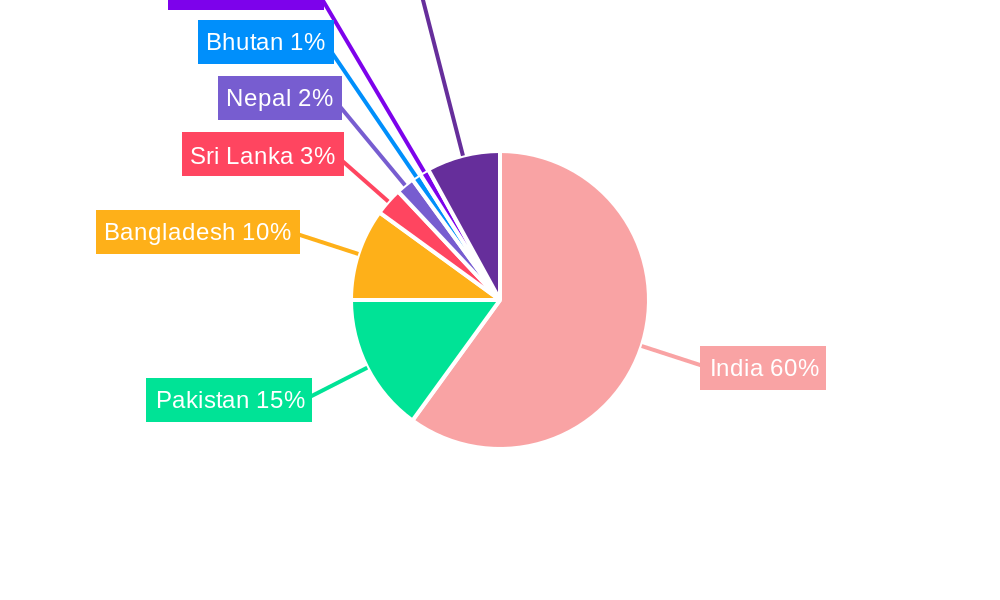
Dominant Regions, Countries, or Segments in Mobile Gaming Market in South Asia
India, Indonesia, and the Philippines are the leading markets within South Asia, collectively contributing xx% of the total market revenue in 2024. Within the platform segment, Android dominates, holding xx% market share, owing to its wider affordability and availability.
- India: Large population, increasing smartphone penetration, and growing internet access.
- Indonesia: High mobile game adoption rates, vibrant esports scene, and favourable regulatory environment.
- Philippines: Strong mobile gaming culture, active participation in esports competitions (e.g., SEA Games 2022), and growing regional game development.
- Platform Dominance: Android leads due to cost-effectiveness and widespread accessibility.
- Growth Drivers: Government initiatives promoting digital economy, improving infrastructure (broadband access), and rising disposable incomes.
Mobile Gaming Market in South Asia Product Landscape
The South Asian mobile gaming market features a diverse range of products, from casual games to complex multiplayer online battle arenas (MOBAs). Hyper-casual games remain highly popular, alongside titles leveraging popular IPs and local cultural elements. Game developers are increasingly integrating social features and in-app purchases to enhance engagement and revenue generation. Technological advancements in graphics and gameplay are constantly evolving the user experience.
Key Drivers, Barriers & Challenges in Mobile Gaming Market in South Asia
Key Drivers:
- Rising Smartphone Penetration: The rapid increase in smartphone ownership is a primary driver.
- Affordable Data Plans: Lower data costs enhance accessibility for a broader user base.
- Growing Young Population: A large young population is highly receptive to mobile gaming.
- Increasing Internet Access: Expanding internet coverage fuels growth.
Key Challenges:
- High Competition: Intense competition from both domestic and international players.
- Regulatory Hurdles: Varying regulations across countries create complexities for developers.
- Piracy: Illegal downloads negatively affect revenue generation for game developers.
- Infrastructure Gaps: Uneven internet penetration creates market disparities.
Emerging Opportunities in Mobile Gaming Market in South Asia
- Hyper-casual Game Development: The continued popularity of easily accessible games presents a strong opportunity.
- Esports Growth: Investment in and expansion of esports leagues and competitions.
- Cloud Gaming Adoption: This technology can overcome hardware limitations and expand access.
- Localized Content: Creating games tailored to local cultural preferences and languages.
Growth Accelerators in the Mobile Gaming Market in South Asia Industry
The market will benefit from continued improvements in mobile infrastructure, increased access to affordable data, the expansion of 5G technology, and the growth of the esports ecosystem. Strategic partnerships between international and local developers will also significantly influence market growth.
Key Players Shaping the Mobile Gaming Market in South Asia Market
- BANDAI NAMCO Entertainment Asia
- Sherman3D
- Garena SEA Group
- Tencent Holdings Ltd
- Netmarble Corporation
- IGG Inc
- Sony Corporation
- Asiasoft Corporation Public Company Limited
- Nintendo Co Ltd
Notable Milestones in Mobile Gaming Market in South Asia Sector
- Dec 2021: Toge Productions launched a funding initiative for South Asian game creators, boosting local development.
- May 2022: The Philippines' gold medal win in the SEA Games Wild Rift tournament highlighted the growing esports sector.
In-Depth Mobile Gaming Market in South Asia Market Outlook
The South Asian mobile gaming market is poised for continued robust growth, driven by sustained increases in smartphone adoption, expanding internet access, and a flourishing esports scene. Strategic investments in local game development, coupled with the expansion of 5G technology and cloud gaming, will present significant opportunities for both established and emerging players. The market's long-term potential is substantial, promising high returns for businesses effectively navigating the competitive landscape and capitalizing on evolving consumer preferences.
Mobile Gaming Market in South Asia Segmentation
-
1. Platform
- 1.1. Android
- 1.2. iOS
Mobile Gaming Market in South Asia Segmentation By Geography
-
1. North America
- 1.1. United States
- 1.2. Canada
- 1.3. Mexico
-
2. South America
- 2.1. Brazil
- 2.2. Argentina
- 2.3. Rest of South America
-
3. Europe
- 3.1. United Kingdom
- 3.2. Germany
- 3.3. France
- 3.4. Italy
- 3.5. Spain
- 3.6. Russia
- 3.7. Benelux
- 3.8. Nordics
- 3.9. Rest of Europe
-
4. Middle East & Africa
- 4.1. Turkey
- 4.2. Israel
- 4.3. GCC
- 4.4. North Africa
- 4.5. South Africa
- 4.6. Rest of Middle East & Africa
-
5. Asia Pacific
- 5.1. China
- 5.2. India
- 5.3. Japan
- 5.4. South Korea
- 5.5. ASEAN
- 5.6. Oceania
- 5.7. Rest of Asia Pacific
Mobile Gaming Market in South Asia REPORT HIGHLIGHTS
| Aspects | Details |
|---|---|
| Study Period | 2019-2033 |
| Base Year | 2024 |
| Estimated Year | 2025 |
| Forecast Period | 2025-2033 |
| Historical Period | 2019-2024 |
| Growth Rate | CAGR of 8.50% from 2019-2033 |
| Segmentation |
|
Table of Contents
- 1. Introduction
- 1.1. Research Scope
- 1.2. Market Segmentation
- 1.3. Research Methodology
- 1.4. Definitions and Assumptions
- 2. Executive Summary
- 2.1. Introduction
- 3. Market Dynamics
- 3.1. Introduction
- 3.2. Market Drivers
- 3.2.1. The growth of eSports in the region4.2.2 5G network and increasing usage of smartphones
- 3.3. Market Restrains
- 3.3.1. User retention for mobile gaming
- 3.4. Market Trends
- 3.4.1. The growth of eSports in the region is driving the Mobile Gaming Market in South Asia Region.
- 4. Market Factor Analysis
- 4.1. Porters Five Forces
- 4.2. Supply/Value Chain
- 4.3. PESTEL analysis
- 4.4. Market Entropy
- 4.5. Patent/Trademark Analysis
- 5. Mobile Gaming Market in South Asia Analysis, Insights and Forecast, 2019-2031
- 5.1. Market Analysis, Insights and Forecast - by Platform
- 5.1.1. Android
- 5.1.2. iOS
- 5.2. Market Analysis, Insights and Forecast - by Region
- 5.2.1. North America
- 5.2.2. South America
- 5.2.3. Europe
- 5.2.4. Middle East & Africa
- 5.2.5. Asia Pacific
- 5.1. Market Analysis, Insights and Forecast - by Platform
- 6. North America Mobile Gaming Market in South Asia Analysis, Insights and Forecast, 2019-2031
- 6.1. Market Analysis, Insights and Forecast - by Platform
- 6.1.1. Android
- 6.1.2. iOS
- 6.1. Market Analysis, Insights and Forecast - by Platform
- 7. South America Mobile Gaming Market in South Asia Analysis, Insights and Forecast, 2019-2031
- 7.1. Market Analysis, Insights and Forecast - by Platform
- 7.1.1. Android
- 7.1.2. iOS
- 7.1. Market Analysis, Insights and Forecast - by Platform
- 8. Europe Mobile Gaming Market in South Asia Analysis, Insights and Forecast, 2019-2031
- 8.1. Market Analysis, Insights and Forecast - by Platform
- 8.1.1. Android
- 8.1.2. iOS
- 8.1. Market Analysis, Insights and Forecast - by Platform
- 9. Middle East & Africa Mobile Gaming Market in South Asia Analysis, Insights and Forecast, 2019-2031
- 9.1. Market Analysis, Insights and Forecast - by Platform
- 9.1.1. Android
- 9.1.2. iOS
- 9.1. Market Analysis, Insights and Forecast - by Platform
- 10. Asia Pacific Mobile Gaming Market in South Asia Analysis, Insights and Forecast, 2019-2031
- 10.1. Market Analysis, Insights and Forecast - by Platform
- 10.1.1. Android
- 10.1.2. iOS
- 10.1. Market Analysis, Insights and Forecast - by Platform
- 11. China Mobile Gaming Market in South Asia Analysis, Insights and Forecast, 2019-2031
- 12. Japan Mobile Gaming Market in South Asia Analysis, Insights and Forecast, 2019-2031
- 13. India Mobile Gaming Market in South Asia Analysis, Insights and Forecast, 2019-2031
- 14. South Korea Mobile Gaming Market in South Asia Analysis, Insights and Forecast, 2019-2031
- 15. Taiwan Mobile Gaming Market in South Asia Analysis, Insights and Forecast, 2019-2031
- 16. Australia Mobile Gaming Market in South Asia Analysis, Insights and Forecast, 2019-2031
- 17. Rest of Asia-Pacific Mobile Gaming Market in South Asia Analysis, Insights and Forecast, 2019-2031
- 18. Competitive Analysis
- 18.1. Market Share Analysis 2024
- 18.2. Company Profiles
- 18.2.1 BANDAI NAMCO Entertainment Asia
- 18.2.1.1. Overview
- 18.2.1.2. Products
- 18.2.1.3. SWOT Analysis
- 18.2.1.4. Recent Developments
- 18.2.1.5. Financials (Based on Availability)
- 18.2.2 Sherman3D
- 18.2.2.1. Overview
- 18.2.2.2. Products
- 18.2.2.3. SWOT Analysis
- 18.2.2.4. Recent Developments
- 18.2.2.5. Financials (Based on Availability)
- 18.2.3 Garena SEA Group
- 18.2.3.1. Overview
- 18.2.3.2. Products
- 18.2.3.3. SWOT Analysis
- 18.2.3.4. Recent Developments
- 18.2.3.5. Financials (Based on Availability)
- 18.2.4 Tencent Holdings Ltd
- 18.2.4.1. Overview
- 18.2.4.2. Products
- 18.2.4.3. SWOT Analysis
- 18.2.4.4. Recent Developments
- 18.2.4.5. Financials (Based on Availability)
- 18.2.5 Netmarble Corporation
- 18.2.5.1. Overview
- 18.2.5.2. Products
- 18.2.5.3. SWOT Analysis
- 18.2.5.4. Recent Developments
- 18.2.5.5. Financials (Based on Availability)
- 18.2.6 IGG Inc
- 18.2.6.1. Overview
- 18.2.6.2. Products
- 18.2.6.3. SWOT Analysis
- 18.2.6.4. Recent Developments
- 18.2.6.5. Financials (Based on Availability)
- 18.2.7 Sony Corporation
- 18.2.7.1. Overview
- 18.2.7.2. Products
- 18.2.7.3. SWOT Analysis
- 18.2.7.4. Recent Developments
- 18.2.7.5. Financials (Based on Availability)
- 18.2.8 Asiasoft Corporation Public Company Limited
- 18.2.8.1. Overview
- 18.2.8.2. Products
- 18.2.8.3. SWOT Analysis
- 18.2.8.4. Recent Developments
- 18.2.8.5. Financials (Based on Availability)
- 18.2.9 Nintendo Co Ltd
- 18.2.9.1. Overview
- 18.2.9.2. Products
- 18.2.9.3. SWOT Analysis
- 18.2.9.4. Recent Developments
- 18.2.9.5. Financials (Based on Availability)
- 18.2.1 BANDAI NAMCO Entertainment Asia
List of Figures
- Figure 1: Mobile Gaming Market in South Asia Revenue Breakdown (Million, %) by Product 2024 & 2032
- Figure 2: Mobile Gaming Market in South Asia Share (%) by Company 2024
List of Tables
- Table 1: Mobile Gaming Market in South Asia Revenue Million Forecast, by Region 2019 & 2032
- Table 2: Mobile Gaming Market in South Asia Volume K Unit Forecast, by Region 2019 & 2032
- Table 3: Mobile Gaming Market in South Asia Revenue Million Forecast, by Platform 2019 & 2032
- Table 4: Mobile Gaming Market in South Asia Volume K Unit Forecast, by Platform 2019 & 2032
- Table 5: Mobile Gaming Market in South Asia Revenue Million Forecast, by Region 2019 & 2032
- Table 6: Mobile Gaming Market in South Asia Volume K Unit Forecast, by Region 2019 & 2032
- Table 7: Mobile Gaming Market in South Asia Revenue Million Forecast, by Country 2019 & 2032
- Table 8: Mobile Gaming Market in South Asia Volume K Unit Forecast, by Country 2019 & 2032
- Table 9: China Mobile Gaming Market in South Asia Revenue (Million) Forecast, by Application 2019 & 2032
- Table 10: China Mobile Gaming Market in South Asia Volume (K Unit) Forecast, by Application 2019 & 2032
- Table 11: Japan Mobile Gaming Market in South Asia Revenue (Million) Forecast, by Application 2019 & 2032
- Table 12: Japan Mobile Gaming Market in South Asia Volume (K Unit) Forecast, by Application 2019 & 2032
- Table 13: India Mobile Gaming Market in South Asia Revenue (Million) Forecast, by Application 2019 & 2032
- Table 14: India Mobile Gaming Market in South Asia Volume (K Unit) Forecast, by Application 2019 & 2032
- Table 15: South Korea Mobile Gaming Market in South Asia Revenue (Million) Forecast, by Application 2019 & 2032
- Table 16: South Korea Mobile Gaming Market in South Asia Volume (K Unit) Forecast, by Application 2019 & 2032
- Table 17: Taiwan Mobile Gaming Market in South Asia Revenue (Million) Forecast, by Application 2019 & 2032
- Table 18: Taiwan Mobile Gaming Market in South Asia Volume (K Unit) Forecast, by Application 2019 & 2032
- Table 19: Australia Mobile Gaming Market in South Asia Revenue (Million) Forecast, by Application 2019 & 2032
- Table 20: Australia Mobile Gaming Market in South Asia Volume (K Unit) Forecast, by Application 2019 & 2032
- Table 21: Rest of Asia-Pacific Mobile Gaming Market in South Asia Revenue (Million) Forecast, by Application 2019 & 2032
- Table 22: Rest of Asia-Pacific Mobile Gaming Market in South Asia Volume (K Unit) Forecast, by Application 2019 & 2032
- Table 23: Mobile Gaming Market in South Asia Revenue Million Forecast, by Platform 2019 & 2032
- Table 24: Mobile Gaming Market in South Asia Volume K Unit Forecast, by Platform 2019 & 2032
- Table 25: Mobile Gaming Market in South Asia Revenue Million Forecast, by Country 2019 & 2032
- Table 26: Mobile Gaming Market in South Asia Volume K Unit Forecast, by Country 2019 & 2032
- Table 27: United States Mobile Gaming Market in South Asia Revenue (Million) Forecast, by Application 2019 & 2032
- Table 28: United States Mobile Gaming Market in South Asia Volume (K Unit) Forecast, by Application 2019 & 2032
- Table 29: Canada Mobile Gaming Market in South Asia Revenue (Million) Forecast, by Application 2019 & 2032
- Table 30: Canada Mobile Gaming Market in South Asia Volume (K Unit) Forecast, by Application 2019 & 2032
- Table 31: Mexico Mobile Gaming Market in South Asia Revenue (Million) Forecast, by Application 2019 & 2032
- Table 32: Mexico Mobile Gaming Market in South Asia Volume (K Unit) Forecast, by Application 2019 & 2032
- Table 33: Mobile Gaming Market in South Asia Revenue Million Forecast, by Platform 2019 & 2032
- Table 34: Mobile Gaming Market in South Asia Volume K Unit Forecast, by Platform 2019 & 2032
- Table 35: Mobile Gaming Market in South Asia Revenue Million Forecast, by Country 2019 & 2032
- Table 36: Mobile Gaming Market in South Asia Volume K Unit Forecast, by Country 2019 & 2032
- Table 37: Brazil Mobile Gaming Market in South Asia Revenue (Million) Forecast, by Application 2019 & 2032
- Table 38: Brazil Mobile Gaming Market in South Asia Volume (K Unit) Forecast, by Application 2019 & 2032
- Table 39: Argentina Mobile Gaming Market in South Asia Revenue (Million) Forecast, by Application 2019 & 2032
- Table 40: Argentina Mobile Gaming Market in South Asia Volume (K Unit) Forecast, by Application 2019 & 2032
- Table 41: Rest of South America Mobile Gaming Market in South Asia Revenue (Million) Forecast, by Application 2019 & 2032
- Table 42: Rest of South America Mobile Gaming Market in South Asia Volume (K Unit) Forecast, by Application 2019 & 2032
- Table 43: Mobile Gaming Market in South Asia Revenue Million Forecast, by Platform 2019 & 2032
- Table 44: Mobile Gaming Market in South Asia Volume K Unit Forecast, by Platform 2019 & 2032
- Table 45: Mobile Gaming Market in South Asia Revenue Million Forecast, by Country 2019 & 2032
- Table 46: Mobile Gaming Market in South Asia Volume K Unit Forecast, by Country 2019 & 2032
- Table 47: United Kingdom Mobile Gaming Market in South Asia Revenue (Million) Forecast, by Application 2019 & 2032
- Table 48: United Kingdom Mobile Gaming Market in South Asia Volume (K Unit) Forecast, by Application 2019 & 2032
- Table 49: Germany Mobile Gaming Market in South Asia Revenue (Million) Forecast, by Application 2019 & 2032
- Table 50: Germany Mobile Gaming Market in South Asia Volume (K Unit) Forecast, by Application 2019 & 2032
- Table 51: France Mobile Gaming Market in South Asia Revenue (Million) Forecast, by Application 2019 & 2032
- Table 52: France Mobile Gaming Market in South Asia Volume (K Unit) Forecast, by Application 2019 & 2032
- Table 53: Italy Mobile Gaming Market in South Asia Revenue (Million) Forecast, by Application 2019 & 2032
- Table 54: Italy Mobile Gaming Market in South Asia Volume (K Unit) Forecast, by Application 2019 & 2032
- Table 55: Spain Mobile Gaming Market in South Asia Revenue (Million) Forecast, by Application 2019 & 2032
- Table 56: Spain Mobile Gaming Market in South Asia Volume (K Unit) Forecast, by Application 2019 & 2032
- Table 57: Russia Mobile Gaming Market in South Asia Revenue (Million) Forecast, by Application 2019 & 2032
- Table 58: Russia Mobile Gaming Market in South Asia Volume (K Unit) Forecast, by Application 2019 & 2032
- Table 59: Benelux Mobile Gaming Market in South Asia Revenue (Million) Forecast, by Application 2019 & 2032
- Table 60: Benelux Mobile Gaming Market in South Asia Volume (K Unit) Forecast, by Application 2019 & 2032
- Table 61: Nordics Mobile Gaming Market in South Asia Revenue (Million) Forecast, by Application 2019 & 2032
- Table 62: Nordics Mobile Gaming Market in South Asia Volume (K Unit) Forecast, by Application 2019 & 2032
- Table 63: Rest of Europe Mobile Gaming Market in South Asia Revenue (Million) Forecast, by Application 2019 & 2032
- Table 64: Rest of Europe Mobile Gaming Market in South Asia Volume (K Unit) Forecast, by Application 2019 & 2032
- Table 65: Mobile Gaming Market in South Asia Revenue Million Forecast, by Platform 2019 & 2032
- Table 66: Mobile Gaming Market in South Asia Volume K Unit Forecast, by Platform 2019 & 2032
- Table 67: Mobile Gaming Market in South Asia Revenue Million Forecast, by Country 2019 & 2032
- Table 68: Mobile Gaming Market in South Asia Volume K Unit Forecast, by Country 2019 & 2032
- Table 69: Turkey Mobile Gaming Market in South Asia Revenue (Million) Forecast, by Application 2019 & 2032
- Table 70: Turkey Mobile Gaming Market in South Asia Volume (K Unit) Forecast, by Application 2019 & 2032
- Table 71: Israel Mobile Gaming Market in South Asia Revenue (Million) Forecast, by Application 2019 & 2032
- Table 72: Israel Mobile Gaming Market in South Asia Volume (K Unit) Forecast, by Application 2019 & 2032
- Table 73: GCC Mobile Gaming Market in South Asia Revenue (Million) Forecast, by Application 2019 & 2032
- Table 74: GCC Mobile Gaming Market in South Asia Volume (K Unit) Forecast, by Application 2019 & 2032
- Table 75: North Africa Mobile Gaming Market in South Asia Revenue (Million) Forecast, by Application 2019 & 2032
- Table 76: North Africa Mobile Gaming Market in South Asia Volume (K Unit) Forecast, by Application 2019 & 2032
- Table 77: South Africa Mobile Gaming Market in South Asia Revenue (Million) Forecast, by Application 2019 & 2032
- Table 78: South Africa Mobile Gaming Market in South Asia Volume (K Unit) Forecast, by Application 2019 & 2032
- Table 79: Rest of Middle East & Africa Mobile Gaming Market in South Asia Revenue (Million) Forecast, by Application 2019 & 2032
- Table 80: Rest of Middle East & Africa Mobile Gaming Market in South Asia Volume (K Unit) Forecast, by Application 2019 & 2032
- Table 81: Mobile Gaming Market in South Asia Revenue Million Forecast, by Platform 2019 & 2032
- Table 82: Mobile Gaming Market in South Asia Volume K Unit Forecast, by Platform 2019 & 2032
- Table 83: Mobile Gaming Market in South Asia Revenue Million Forecast, by Country 2019 & 2032
- Table 84: Mobile Gaming Market in South Asia Volume K Unit Forecast, by Country 2019 & 2032
- Table 85: China Mobile Gaming Market in South Asia Revenue (Million) Forecast, by Application 2019 & 2032
- Table 86: China Mobile Gaming Market in South Asia Volume (K Unit) Forecast, by Application 2019 & 2032
- Table 87: India Mobile Gaming Market in South Asia Revenue (Million) Forecast, by Application 2019 & 2032
- Table 88: India Mobile Gaming Market in South Asia Volume (K Unit) Forecast, by Application 2019 & 2032
- Table 89: Japan Mobile Gaming Market in South Asia Revenue (Million) Forecast, by Application 2019 & 2032
- Table 90: Japan Mobile Gaming Market in South Asia Volume (K Unit) Forecast, by Application 2019 & 2032
- Table 91: South Korea Mobile Gaming Market in South Asia Revenue (Million) Forecast, by Application 2019 & 2032
- Table 92: South Korea Mobile Gaming Market in South Asia Volume (K Unit) Forecast, by Application 2019 & 2032
- Table 93: ASEAN Mobile Gaming Market in South Asia Revenue (Million) Forecast, by Application 2019 & 2032
- Table 94: ASEAN Mobile Gaming Market in South Asia Volume (K Unit) Forecast, by Application 2019 & 2032
- Table 95: Oceania Mobile Gaming Market in South Asia Revenue (Million) Forecast, by Application 2019 & 2032
- Table 96: Oceania Mobile Gaming Market in South Asia Volume (K Unit) Forecast, by Application 2019 & 2032
- Table 97: Rest of Asia Pacific Mobile Gaming Market in South Asia Revenue (Million) Forecast, by Application 2019 & 2032
- Table 98: Rest of Asia Pacific Mobile Gaming Market in South Asia Volume (K Unit) Forecast, by Application 2019 & 2032
Frequently Asked Questions
1. What is the projected Compound Annual Growth Rate (CAGR) of the Mobile Gaming Market in South Asia?
The projected CAGR is approximately 8.50%.
2. Which companies are prominent players in the Mobile Gaming Market in South Asia?
Key companies in the market include BANDAI NAMCO Entertainment Asia, Sherman3D, Garena SEA Group, Tencent Holdings Ltd, Netmarble Corporation, IGG Inc, Sony Corporation, Asiasoft Corporation Public Company Limited, Nintendo Co Ltd.
3. What are the main segments of the Mobile Gaming Market in South Asia?
The market segments include Platform.
4. Can you provide details about the market size?
The market size is estimated to be USD XX Million as of 2022.
5. What are some drivers contributing to market growth?
The growth of eSports in the region4.2.2 5G network and increasing usage of smartphones.
6. What are the notable trends driving market growth?
The growth of eSports in the region is driving the Mobile Gaming Market in South Asia Region..
7. Are there any restraints impacting market growth?
User retention for mobile gaming.
8. Can you provide examples of recent developments in the market?
Dec 2021: Toge Productions announced a funding initiative for South Asian game creators, with the first six grantees to be announced. UNIQX Studio is the first to have their game, Ngopi, Yuk, released.
9. What pricing options are available for accessing the report?
Pricing options include single-user, multi-user, and enterprise licenses priced at USD 4750, USD 4950, and USD 6800 respectively.
10. Is the market size provided in terms of value or volume?
The market size is provided in terms of value, measured in Million and volume, measured in K Unit.
11. Are there any specific market keywords associated with the report?
Yes, the market keyword associated with the report is "Mobile Gaming Market in South Asia," which aids in identifying and referencing the specific market segment covered.
12. How do I determine which pricing option suits my needs best?
The pricing options vary based on user requirements and access needs. Individual users may opt for single-user licenses, while businesses requiring broader access may choose multi-user or enterprise licenses for cost-effective access to the report.
13. Are there any additional resources or data provided in the Mobile Gaming Market in South Asia report?
While the report offers comprehensive insights, it's advisable to review the specific contents or supplementary materials provided to ascertain if additional resources or data are available.
14. How can I stay updated on further developments or reports in the Mobile Gaming Market in South Asia?
To stay informed about further developments, trends, and reports in the Mobile Gaming Market in South Asia, consider subscribing to industry newsletters, following relevant companies and organizations, or regularly checking reputable industry news sources and publications.
Methodology
Step 1 - Identification of Relevant Samples Size from Population Database


Step 2 - Approaches for Defining Global Market Size (Value, Volume* & Price*)

Note*: In applicable scenarios
Step 3 - Data Sources
Primary Research
- Web Analytics
- Survey Reports
- Research Institute
- Latest Research Reports
- Opinion Leaders
Secondary Research
- Annual Reports
- White Paper
- Latest Press Release
- Industry Association
- Paid Database
- Investor Presentations

Step 4 - Data Triangulation
Involves using different sources of information in order to increase the validity of a study
These sources are likely to be stakeholders in a program - participants, other researchers, program staff, other community members, and so on.
Then we put all data in single framework & apply various statistical tools to find out the dynamic on the market.
During the analysis stage, feedback from the stakeholder groups would be compared to determine areas of agreement as well as areas of divergence


