
Key Insights
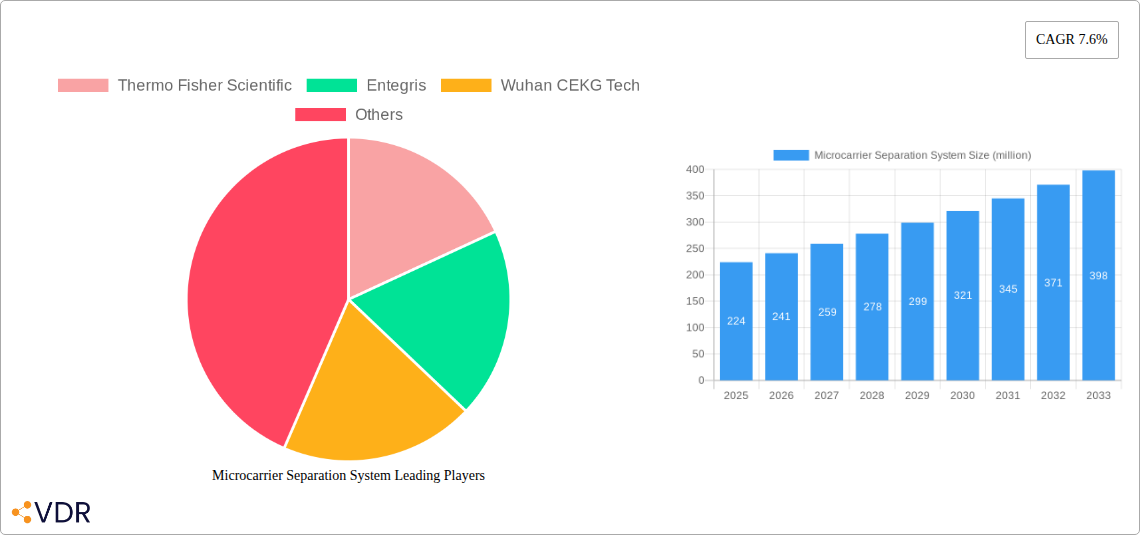
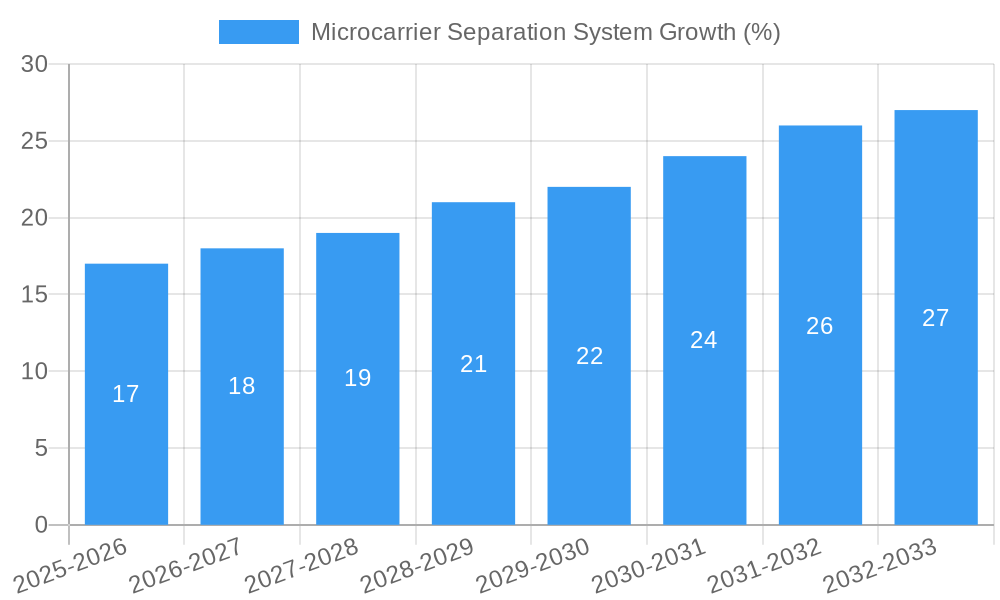
The global microcarrier separation system market is projected to reach \$224 million in 2025, exhibiting a robust Compound Annual Growth Rate (CAGR) of 7.6% from 2025 to 2033. This growth is fueled by several key factors. The increasing demand for biopharmaceuticals, coupled with advancements in cell culture technologies, is driving the adoption of efficient and scalable microcarrier separation systems. These systems offer significant advantages over traditional cell culture methods, including increased cell density, improved process control, and enhanced product yields. Furthermore, the rising prevalence of chronic diseases and the growing need for personalized medicine are contributing to the market's expansion. The development of innovative microcarrier materials and improved separation techniques further enhances the market's prospects. Major players like Thermo Fisher Scientific and Entegris are actively investing in research and development, leading to the introduction of sophisticated and high-performance systems. The competitive landscape is also characterized by the presence of regional players like Wuhan CEKG Tech, indicating a global distribution of this crucial technology.
The market segmentation, while not explicitly detailed, is likely diverse, encompassing various system types based on separation principles (e.g., centrifugation, filtration, sedimentation) and applications across different biopharmaceutical production processes. Geographic variations in market growth are expected, with regions experiencing rapid growth in the biopharmaceutical industry, such as Asia-Pacific, likely exhibiting higher-than-average CAGR. Regulatory landscape changes and technological advancements in downstream processing will influence market trajectory. Factors like the cost of equipment and specialized technical expertise required for operation could act as potential restraints, though the overall market outlook remains positive due to the strong drivers outlined above. Future growth will depend on ongoing innovation, the expansion of biomanufacturing facilities globally, and the consistent demand for advanced cell-based therapies and biologics.
Microcarrier Separation System Market Report: 2019-2033
This comprehensive report provides an in-depth analysis of the global Microcarrier Separation System market, encompassing historical data (2019-2024), current estimates (2025), and future projections (2025-2033). The report leverages extensive primary and secondary research to deliver actionable insights for industry stakeholders, including manufacturers, researchers, investors, and regulatory bodies. The global market size is expected to reach xx million units by 2033, growing at a CAGR of xx% during the forecast period. The report segments the market by technology, application, and geography, providing granular detail for informed decision-making.
Microcarrier Separation System Market Dynamics & Structure
The microcarrier separation system market is characterized by moderate concentration, with key players such as Thermo Fisher Scientific, Entegris, and Wuhan CEKG Tech holding significant market share. Technological innovation, driven by the need for higher efficiency and throughput in cell culture processes, is a primary growth driver. Stringent regulatory frameworks governing biopharmaceutical manufacturing influence market dynamics. Competitive pressure from alternative separation technologies exists, but the advantages of microcarrier systems in cell density and scalability maintain market relevance. The market has seen a moderate level of M&A activity in recent years, with xx deals recorded between 2019 and 2024, mostly focused on enhancing technological capabilities and expanding market reach.
- Market Concentration: Moderately concentrated, with the top three players holding approximately xx% of the market share in 2025.
- Technological Innovation: Focus on automation, miniaturization, and improved cell recovery rates.
- Regulatory Landscape: Stringent guidelines for biopharmaceutical manufacturing impact product development and adoption.
- Competitive Substitutes: Alternative separation techniques such as centrifugation and filtration pose competitive threats.
- End-User Demographics: Primarily biopharmaceutical companies, academic research institutions, and contract manufacturing organizations (CMOs).
- M&A Trends: Consolidation expected to continue, driven by the need for economies of scale and technological advancements.
Microcarrier Separation System Growth Trends & Insights
The microcarrier separation system market has experienced steady growth over the historical period (2019-2024), driven by increasing demand for cell-based therapies and the growing adoption of cell culture technologies across various life science applications. The market size expanded from xx million units in 2019 to xx million units in 2024, reflecting an average annual growth rate (AAGR) of xx%. Technological advancements, particularly in automation and scalability, have facilitated market penetration, especially within the biopharmaceutical sector. Shifting consumer preferences towards personalized medicine and advanced therapies further propel market growth. The forecast period (2025-2033) anticipates continued growth, driven by these factors and emerging applications in regenerative medicine and gene therapy. Market penetration is expected to increase from xx% in 2025 to xx% in 2033.
Dominant Regions, Countries, or Segments in Microcarrier Separation System
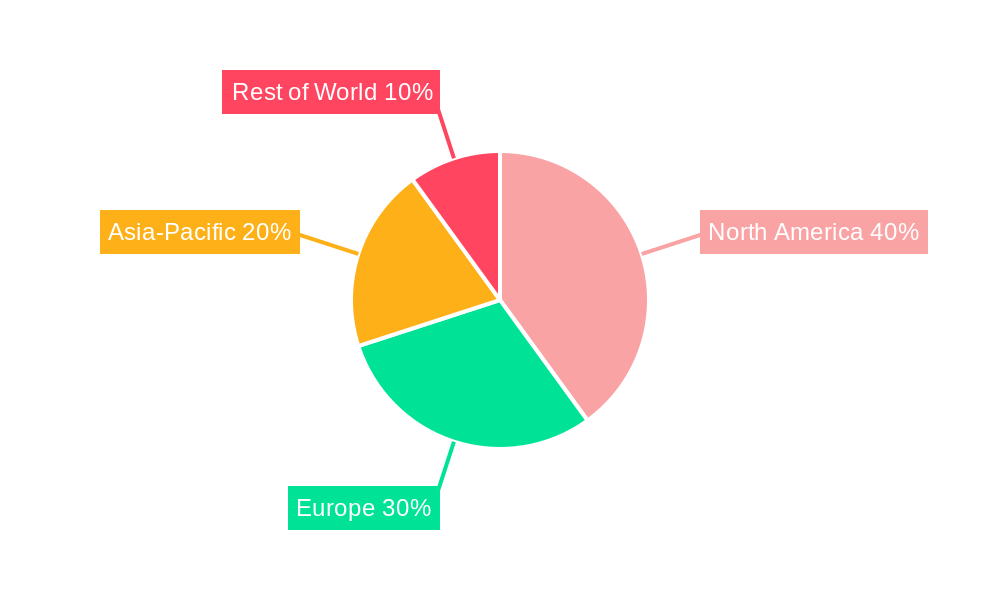
North America currently dominates the microcarrier separation system market, accounting for approximately xx% of the global market share in 2025. This dominance stems from the strong presence of key players, significant investments in life sciences research, and a robust regulatory framework supportive of biopharmaceutical innovation. Europe and Asia Pacific are also important markets, experiencing steady growth driven by increasing R&D investments and rising demand for cell-based therapies. The biopharmaceutical segment holds the largest market share, owing to the extensive applications of microcarrier systems in large-scale cell culture for drug production.
- North America: Strong presence of major players, high R&D spending, favorable regulatory environment.
- Europe: Growing adoption of advanced cell therapies and increasing investments in biotechnology.
- Asia Pacific: Rapid expansion of the biopharmaceutical industry and increasing government support for life science research.
- Biopharmaceutical Segment: Largest market share due to the high demand for scalable cell culture technologies in drug manufacturing.
Microcarrier Separation System Product Landscape
Microcarrier separation systems are available in various configurations, from benchtop units suitable for research applications to large-scale industrial systems designed for high-throughput manufacturing. Innovations focus on improving cell recovery rates, reducing processing time, and enhancing scalability. Unique selling propositions include automated operation, closed-system designs for sterility, and high cell viability post-separation. Recent technological advancements encompass the integration of advanced sensors for real-time process monitoring and sophisticated control algorithms for optimized separation parameters.
Key Drivers, Barriers & Challenges in Microcarrier Separation System
Key Drivers: Increasing demand for cell-based therapies, growing adoption of cell culture technologies in biopharmaceutical manufacturing, technological advancements leading to improved efficiency and scalability, rising investments in life sciences research.
Challenges: High initial investment costs, stringent regulatory compliance requirements, potential supply chain disruptions impacting the availability of components, and intense competition from alternative cell separation technologies. The impact of supply chain disruptions on the market is estimated to be approximately xx million units annually.
Emerging Opportunities in Microcarrier Separation System
Untapped market segments include personalized medicine, regenerative medicine, and gene therapy, all of which heavily rely on efficient cell culture and separation techniques. Emerging opportunities lie in developing miniaturized systems for point-of-care diagnostics, integrating advanced analytics for real-time process monitoring, and exploring novel materials to improve cell compatibility and recovery rates.
Growth Accelerators in the Microcarrier Separation System Industry
Technological breakthroughs in microfluidic devices and automation are accelerating market growth. Strategic partnerships between equipment manufacturers and biopharmaceutical companies are fostering innovation and market expansion. Government initiatives to promote advanced therapies and investments in cell-based research are creating a favorable environment for market expansion.
Key Players Shaping the Microcarrier Separation System Market
- Thermo Fisher Scientific
- Entegris
- Wuhan CEKG Tech
Notable Milestones in Microcarrier Separation System Sector
- 2020: Thermo Fisher Scientific launches a new automated microcarrier separation system.
- 2022: Entegris acquires a smaller competitor specializing in microcarrier technology.
- 2023: Wuhan CEKG Tech introduces a novel microcarrier material with improved cell viability.
In-Depth Microcarrier Separation System Market Outlook
The microcarrier separation system market is poised for robust growth over the forecast period, driven by ongoing technological advancements, expanding applications in advanced therapies, and increasing investments in life sciences research. Strategic partnerships, focused R&D efforts, and the integration of advanced analytics present significant opportunities for market players to capture a greater share of this rapidly evolving market. The market is projected to witness continued consolidation, with larger players acquiring smaller companies to enhance their technological capabilities and expand their market reach.
Microcarrier Separation System Segmentation
-
1. Application
- 1.1. Cell Therapy
- 1.2. Vaccine Production
- 1.3. Others
-
2. Type
- 2.1. 10L and Below
- 2.2. 10L Above
Microcarrier Separation System Segmentation By Geography
-
1. North America
- 1.1. United States
- 1.2. Canada
- 1.3. Mexico
-
2. South America
- 2.1. Brazil
- 2.2. Argentina
- 2.3. Rest of South America
-
3. Europe
- 3.1. United Kingdom
- 3.2. Germany
- 3.3. France
- 3.4. Italy
- 3.5. Spain
- 3.6. Russia
- 3.7. Benelux
- 3.8. Nordics
- 3.9. Rest of Europe
-
4. Middle East & Africa
- 4.1. Turkey
- 4.2. Israel
- 4.3. GCC
- 4.4. North Africa
- 4.5. South Africa
- 4.6. Rest of Middle East & Africa
-
5. Asia Pacific
- 5.1. China
- 5.2. India
- 5.3. Japan
- 5.4. South Korea
- 5.5. ASEAN
- 5.6. Oceania
- 5.7. Rest of Asia Pacific
Microcarrier Separation System REPORT HIGHLIGHTS
| Aspects | Details |
|---|---|
| Study Period | 2019-2033 |
| Base Year | 2024 |
| Estimated Year | 2025 |
| Forecast Period | 2025-2033 |
| Historical Period | 2019-2024 |
| Growth Rate | CAGR of 7.6% from 2019-2033 |
| Segmentation |
|
Table of Contents
- 1. Introduction
- 1.1. Research Scope
- 1.2. Market Segmentation
- 1.3. Research Methodology
- 1.4. Definitions and Assumptions
- 2. Executive Summary
- 2.1. Introduction
- 3. Market Dynamics
- 3.1. Introduction
- 3.2. Market Drivers
- 3.3. Market Restrains
- 3.4. Market Trends
- 4. Market Factor Analysis
- 4.1. Porters Five Forces
- 4.2. Supply/Value Chain
- 4.3. PESTEL analysis
- 4.4. Market Entropy
- 4.5. Patent/Trademark Analysis
- 5. Global Microcarrier Separation System Analysis, Insights and Forecast, 2019-2031
- 5.1. Market Analysis, Insights and Forecast - by Application
- 5.1.1. Cell Therapy
- 5.1.2. Vaccine Production
- 5.1.3. Others
- 5.2. Market Analysis, Insights and Forecast - by Type
- 5.2.1. 10L and Below
- 5.2.2. 10L Above
- 5.3. Market Analysis, Insights and Forecast - by Region
- 5.3.1. North America
- 5.3.2. South America
- 5.3.3. Europe
- 5.3.4. Middle East & Africa
- 5.3.5. Asia Pacific
- 5.1. Market Analysis, Insights and Forecast - by Application
- 6. North America Microcarrier Separation System Analysis, Insights and Forecast, 2019-2031
- 6.1. Market Analysis, Insights and Forecast - by Application
- 6.1.1. Cell Therapy
- 6.1.2. Vaccine Production
- 6.1.3. Others
- 6.2. Market Analysis, Insights and Forecast - by Type
- 6.2.1. 10L and Below
- 6.2.2. 10L Above
- 6.1. Market Analysis, Insights and Forecast - by Application
- 7. South America Microcarrier Separation System Analysis, Insights and Forecast, 2019-2031
- 7.1. Market Analysis, Insights and Forecast - by Application
- 7.1.1. Cell Therapy
- 7.1.2. Vaccine Production
- 7.1.3. Others
- 7.2. Market Analysis, Insights and Forecast - by Type
- 7.2.1. 10L and Below
- 7.2.2. 10L Above
- 7.1. Market Analysis, Insights and Forecast - by Application
- 8. Europe Microcarrier Separation System Analysis, Insights and Forecast, 2019-2031
- 8.1. Market Analysis, Insights and Forecast - by Application
- 8.1.1. Cell Therapy
- 8.1.2. Vaccine Production
- 8.1.3. Others
- 8.2. Market Analysis, Insights and Forecast - by Type
- 8.2.1. 10L and Below
- 8.2.2. 10L Above
- 8.1. Market Analysis, Insights and Forecast - by Application
- 9. Middle East & Africa Microcarrier Separation System Analysis, Insights and Forecast, 2019-2031
- 9.1. Market Analysis, Insights and Forecast - by Application
- 9.1.1. Cell Therapy
- 9.1.2. Vaccine Production
- 9.1.3. Others
- 9.2. Market Analysis, Insights and Forecast - by Type
- 9.2.1. 10L and Below
- 9.2.2. 10L Above
- 9.1. Market Analysis, Insights and Forecast - by Application
- 10. Asia Pacific Microcarrier Separation System Analysis, Insights and Forecast, 2019-2031
- 10.1. Market Analysis, Insights and Forecast - by Application
- 10.1.1. Cell Therapy
- 10.1.2. Vaccine Production
- 10.1.3. Others
- 10.2. Market Analysis, Insights and Forecast - by Type
- 10.2.1. 10L and Below
- 10.2.2. 10L Above
- 10.1. Market Analysis, Insights and Forecast - by Application
- 11. Competitive Analysis
- 11.1. Global Market Share Analysis 2024
- 11.2. Company Profiles
- 11.2.1 Thermo Fisher Scientific
- 11.2.1.1. Overview
- 11.2.1.2. Products
- 11.2.1.3. SWOT Analysis
- 11.2.1.4. Recent Developments
- 11.2.1.5. Financials (Based on Availability)
- 11.2.2 Entegris
- 11.2.2.1. Overview
- 11.2.2.2. Products
- 11.2.2.3. SWOT Analysis
- 11.2.2.4. Recent Developments
- 11.2.2.5. Financials (Based on Availability)
- 11.2.3 Wuhan CEKG Tech
- 11.2.3.1. Overview
- 11.2.3.2. Products
- 11.2.3.3. SWOT Analysis
- 11.2.3.4. Recent Developments
- 11.2.3.5. Financials (Based on Availability)
- 11.2.1 Thermo Fisher Scientific
List of Figures
- Figure 1: Global Microcarrier Separation System Revenue Breakdown (million, %) by Region 2024 & 2032
- Figure 2: North America Microcarrier Separation System Revenue (million), by Application 2024 & 2032
- Figure 3: North America Microcarrier Separation System Revenue Share (%), by Application 2024 & 2032
- Figure 4: North America Microcarrier Separation System Revenue (million), by Type 2024 & 2032
- Figure 5: North America Microcarrier Separation System Revenue Share (%), by Type 2024 & 2032
- Figure 6: North America Microcarrier Separation System Revenue (million), by Country 2024 & 2032
- Figure 7: North America Microcarrier Separation System Revenue Share (%), by Country 2024 & 2032
- Figure 8: South America Microcarrier Separation System Revenue (million), by Application 2024 & 2032
- Figure 9: South America Microcarrier Separation System Revenue Share (%), by Application 2024 & 2032
- Figure 10: South America Microcarrier Separation System Revenue (million), by Type 2024 & 2032
- Figure 11: South America Microcarrier Separation System Revenue Share (%), by Type 2024 & 2032
- Figure 12: South America Microcarrier Separation System Revenue (million), by Country 2024 & 2032
- Figure 13: South America Microcarrier Separation System Revenue Share (%), by Country 2024 & 2032
- Figure 14: Europe Microcarrier Separation System Revenue (million), by Application 2024 & 2032
- Figure 15: Europe Microcarrier Separation System Revenue Share (%), by Application 2024 & 2032
- Figure 16: Europe Microcarrier Separation System Revenue (million), by Type 2024 & 2032
- Figure 17: Europe Microcarrier Separation System Revenue Share (%), by Type 2024 & 2032
- Figure 18: Europe Microcarrier Separation System Revenue (million), by Country 2024 & 2032
- Figure 19: Europe Microcarrier Separation System Revenue Share (%), by Country 2024 & 2032
- Figure 20: Middle East & Africa Microcarrier Separation System Revenue (million), by Application 2024 & 2032
- Figure 21: Middle East & Africa Microcarrier Separation System Revenue Share (%), by Application 2024 & 2032
- Figure 22: Middle East & Africa Microcarrier Separation System Revenue (million), by Type 2024 & 2032
- Figure 23: Middle East & Africa Microcarrier Separation System Revenue Share (%), by Type 2024 & 2032
- Figure 24: Middle East & Africa Microcarrier Separation System Revenue (million), by Country 2024 & 2032
- Figure 25: Middle East & Africa Microcarrier Separation System Revenue Share (%), by Country 2024 & 2032
- Figure 26: Asia Pacific Microcarrier Separation System Revenue (million), by Application 2024 & 2032
- Figure 27: Asia Pacific Microcarrier Separation System Revenue Share (%), by Application 2024 & 2032
- Figure 28: Asia Pacific Microcarrier Separation System Revenue (million), by Type 2024 & 2032
- Figure 29: Asia Pacific Microcarrier Separation System Revenue Share (%), by Type 2024 & 2032
- Figure 30: Asia Pacific Microcarrier Separation System Revenue (million), by Country 2024 & 2032
- Figure 31: Asia Pacific Microcarrier Separation System Revenue Share (%), by Country 2024 & 2032
List of Tables
- Table 1: Global Microcarrier Separation System Revenue million Forecast, by Region 2019 & 2032
- Table 2: Global Microcarrier Separation System Revenue million Forecast, by Application 2019 & 2032
- Table 3: Global Microcarrier Separation System Revenue million Forecast, by Type 2019 & 2032
- Table 4: Global Microcarrier Separation System Revenue million Forecast, by Region 2019 & 2032
- Table 5: Global Microcarrier Separation System Revenue million Forecast, by Application 2019 & 2032
- Table 6: Global Microcarrier Separation System Revenue million Forecast, by Type 2019 & 2032
- Table 7: Global Microcarrier Separation System Revenue million Forecast, by Country 2019 & 2032
- Table 8: United States Microcarrier Separation System Revenue (million) Forecast, by Application 2019 & 2032
- Table 9: Canada Microcarrier Separation System Revenue (million) Forecast, by Application 2019 & 2032
- Table 10: Mexico Microcarrier Separation System Revenue (million) Forecast, by Application 2019 & 2032
- Table 11: Global Microcarrier Separation System Revenue million Forecast, by Application 2019 & 2032
- Table 12: Global Microcarrier Separation System Revenue million Forecast, by Type 2019 & 2032
- Table 13: Global Microcarrier Separation System Revenue million Forecast, by Country 2019 & 2032
- Table 14: Brazil Microcarrier Separation System Revenue (million) Forecast, by Application 2019 & 2032
- Table 15: Argentina Microcarrier Separation System Revenue (million) Forecast, by Application 2019 & 2032
- Table 16: Rest of South America Microcarrier Separation System Revenue (million) Forecast, by Application 2019 & 2032
- Table 17: Global Microcarrier Separation System Revenue million Forecast, by Application 2019 & 2032
- Table 18: Global Microcarrier Separation System Revenue million Forecast, by Type 2019 & 2032
- Table 19: Global Microcarrier Separation System Revenue million Forecast, by Country 2019 & 2032
- Table 20: United Kingdom Microcarrier Separation System Revenue (million) Forecast, by Application 2019 & 2032
- Table 21: Germany Microcarrier Separation System Revenue (million) Forecast, by Application 2019 & 2032
- Table 22: France Microcarrier Separation System Revenue (million) Forecast, by Application 2019 & 2032
- Table 23: Italy Microcarrier Separation System Revenue (million) Forecast, by Application 2019 & 2032
- Table 24: Spain Microcarrier Separation System Revenue (million) Forecast, by Application 2019 & 2032
- Table 25: Russia Microcarrier Separation System Revenue (million) Forecast, by Application 2019 & 2032
- Table 26: Benelux Microcarrier Separation System Revenue (million) Forecast, by Application 2019 & 2032
- Table 27: Nordics Microcarrier Separation System Revenue (million) Forecast, by Application 2019 & 2032
- Table 28: Rest of Europe Microcarrier Separation System Revenue (million) Forecast, by Application 2019 & 2032
- Table 29: Global Microcarrier Separation System Revenue million Forecast, by Application 2019 & 2032
- Table 30: Global Microcarrier Separation System Revenue million Forecast, by Type 2019 & 2032
- Table 31: Global Microcarrier Separation System Revenue million Forecast, by Country 2019 & 2032
- Table 32: Turkey Microcarrier Separation System Revenue (million) Forecast, by Application 2019 & 2032
- Table 33: Israel Microcarrier Separation System Revenue (million) Forecast, by Application 2019 & 2032
- Table 34: GCC Microcarrier Separation System Revenue (million) Forecast, by Application 2019 & 2032
- Table 35: North Africa Microcarrier Separation System Revenue (million) Forecast, by Application 2019 & 2032
- Table 36: South Africa Microcarrier Separation System Revenue (million) Forecast, by Application 2019 & 2032
- Table 37: Rest of Middle East & Africa Microcarrier Separation System Revenue (million) Forecast, by Application 2019 & 2032
- Table 38: Global Microcarrier Separation System Revenue million Forecast, by Application 2019 & 2032
- Table 39: Global Microcarrier Separation System Revenue million Forecast, by Type 2019 & 2032
- Table 40: Global Microcarrier Separation System Revenue million Forecast, by Country 2019 & 2032
- Table 41: China Microcarrier Separation System Revenue (million) Forecast, by Application 2019 & 2032
- Table 42: India Microcarrier Separation System Revenue (million) Forecast, by Application 2019 & 2032
- Table 43: Japan Microcarrier Separation System Revenue (million) Forecast, by Application 2019 & 2032
- Table 44: South Korea Microcarrier Separation System Revenue (million) Forecast, by Application 2019 & 2032
- Table 45: ASEAN Microcarrier Separation System Revenue (million) Forecast, by Application 2019 & 2032
- Table 46: Oceania Microcarrier Separation System Revenue (million) Forecast, by Application 2019 & 2032
- Table 47: Rest of Asia Pacific Microcarrier Separation System Revenue (million) Forecast, by Application 2019 & 2032
Frequently Asked Questions
1. What is the projected Compound Annual Growth Rate (CAGR) of the Microcarrier Separation System?
The projected CAGR is approximately 7.6%.
2. Which companies are prominent players in the Microcarrier Separation System?
Key companies in the market include Thermo Fisher Scientific, Entegris, Wuhan CEKG Tech.
3. What are the main segments of the Microcarrier Separation System?
The market segments include Application, Type.
4. Can you provide details about the market size?
The market size is estimated to be USD 224 million as of 2022.
5. What are some drivers contributing to market growth?
N/A
6. What are the notable trends driving market growth?
N/A
7. Are there any restraints impacting market growth?
N/A
8. Can you provide examples of recent developments in the market?
N/A
9. What pricing options are available for accessing the report?
Pricing options include single-user, multi-user, and enterprise licenses priced at USD 4250.00, USD 6375.00, and USD 8500.00 respectively.
10. Is the market size provided in terms of value or volume?
The market size is provided in terms of value, measured in million.
11. Are there any specific market keywords associated with the report?
Yes, the market keyword associated with the report is "Microcarrier Separation System," which aids in identifying and referencing the specific market segment covered.
12. How do I determine which pricing option suits my needs best?
The pricing options vary based on user requirements and access needs. Individual users may opt for single-user licenses, while businesses requiring broader access may choose multi-user or enterprise licenses for cost-effective access to the report.
13. Are there any additional resources or data provided in the Microcarrier Separation System report?
While the report offers comprehensive insights, it's advisable to review the specific contents or supplementary materials provided to ascertain if additional resources or data are available.
14. How can I stay updated on further developments or reports in the Microcarrier Separation System?
To stay informed about further developments, trends, and reports in the Microcarrier Separation System, consider subscribing to industry newsletters, following relevant companies and organizations, or regularly checking reputable industry news sources and publications.
Methodology
Step 1 - Identification of Relevant Samples Size from Population Database


Step 2 - Approaches for Defining Global Market Size (Value, Volume* & Price*)

Note*: In applicable scenarios
Step 3 - Data Sources
Primary Research
- Web Analytics
- Survey Reports
- Research Institute
- Latest Research Reports
- Opinion Leaders
Secondary Research
- Annual Reports
- White Paper
- Latest Press Release
- Industry Association
- Paid Database
- Investor Presentations

Step 4 - Data Triangulation
Involves using different sources of information in order to increase the validity of a study
These sources are likely to be stakeholders in a program - participants, other researchers, program staff, other community members, and so on.
Then we put all data in single framework & apply various statistical tools to find out the dynamic on the market.
During the analysis stage, feedback from the stakeholder groups would be compared to determine areas of agreement as well as areas of divergence


