
Key Insights
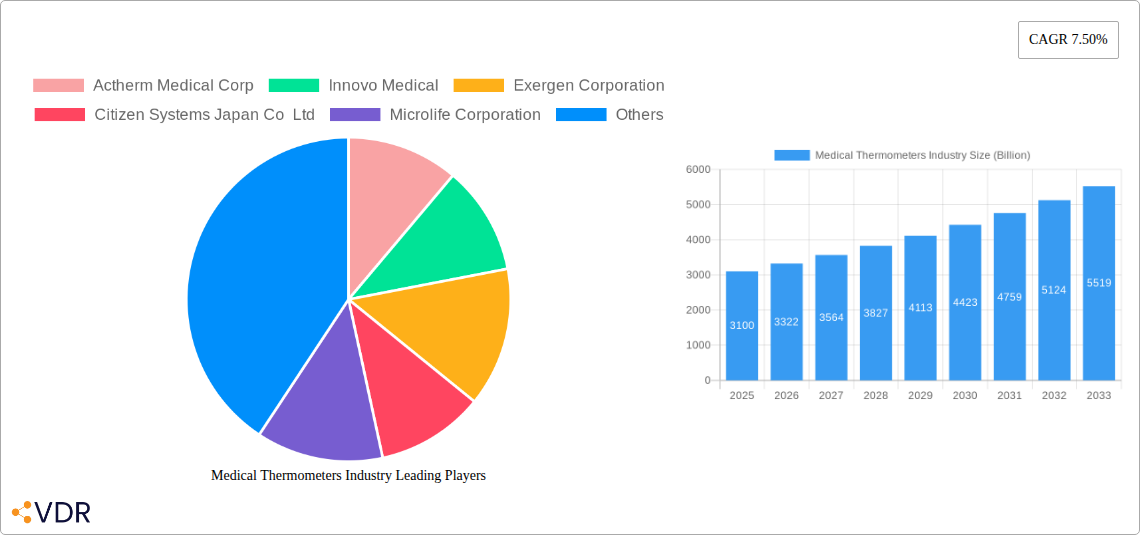
The global medical thermometers market, valued at $3.1 billion in 2025, is projected to experience robust growth, driven by a Compound Annual Growth Rate (CAGR) of 7.50% from 2025 to 2033. This expansion is fueled by several key factors. Rising prevalence of chronic diseases necessitates frequent temperature monitoring, particularly among elderly populations and those with compromised immune systems. Technological advancements, including the introduction of non-contact infrared thermometers and smart thermometers with data logging and connectivity features, are significantly enhancing convenience and accuracy, thus boosting market adoption. Furthermore, increasing healthcare expenditure globally and growing awareness about preventive healthcare contribute to market growth. The shift towards home healthcare and telehealth services also plays a vital role, as these platforms often require accurate and readily accessible temperature measurement devices. However, market growth might be slightly constrained by the relatively lower prices of traditional mercury-based thermometers in certain developing regions. The market segmentation reveals significant opportunities within mercury-free thermometers due to increasing environmental concerns and regulatory restrictions around mercury usage. The hospitals and clinics segment holds a substantial market share due to their high volume of patient monitoring needs.
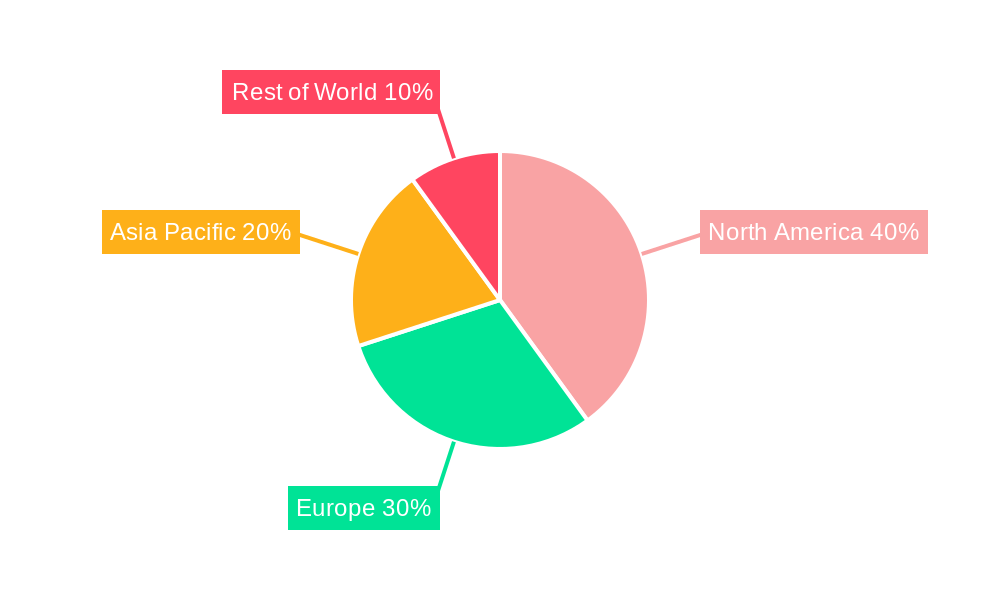
The competitive landscape is diverse, with key players such as Actherm Medical Corp, Innovo Medical, Exergen Corporation, and Omron Healthcare Inc. vying for market share through product innovation, strategic partnerships, and geographical expansion. North America and Europe currently dominate the market, reflecting higher healthcare spending and technological adoption rates. However, the Asia-Pacific region is expected to witness significant growth driven by rising disposable incomes, improving healthcare infrastructure, and increasing awareness of health and wellness. The market's future trajectory strongly suggests continued growth fueled by technological advancements and evolving healthcare demands, making it a promising investment sector. The market is likely to see further consolidation as larger players acquire smaller companies and accelerate innovation. The increasing emphasis on digital health and remote patient monitoring will also continue to shape the future of this dynamic industry.
This comprehensive report provides an in-depth analysis of the global medical thermometers market, encompassing market dynamics, growth trends, regional segmentation, product landscape, key players, and future outlook. The study period covers 2019-2033, with 2025 as the base and estimated year. The report utilizes a robust methodology to deliver actionable insights for industry professionals, investors, and stakeholders. The total market size is projected to reach xx Billion by 2033.
Medical Thermometers Industry Market Dynamics & Structure
The medical thermometers market is characterized by a moderately concentrated landscape with key players holding significant market share. Technological innovation, particularly in non-contact and digital thermometers, is a major driver, while regulatory frameworks concerning accuracy and safety play a crucial role. Mercury-free thermometers are witnessing increasing adoption due to environmental concerns and safety regulations. Competitive substitutes include other diagnostic tools for temperature assessment, but thermometers remain the primary method. The end-user demographics are primarily hospitals and clinics, but the market is expanding to encompass home healthcare and other end users. M&A activity in the sector has been moderate, with a focus on expanding product portfolios and geographical reach. An estimated xx Billion in M&A deals were concluded in the historical period (2019-2024).
- Market Concentration: Moderately concentrated, with top 5 players holding xx% market share.
- Technological Innovation: Focus on non-contact, digital, and smart thermometers.
- Regulatory Landscape: Stringent regulations regarding accuracy and safety standards.
- Competitive Substitutes: Limited, with thermometers remaining the dominant method.
- End-User Demographics: Hospitals, clinics, and increasingly, home healthcare.
- M&A Activity: Moderate activity focused on expansion and portfolio diversification.
Medical Thermometers Industry Growth Trends & Insights
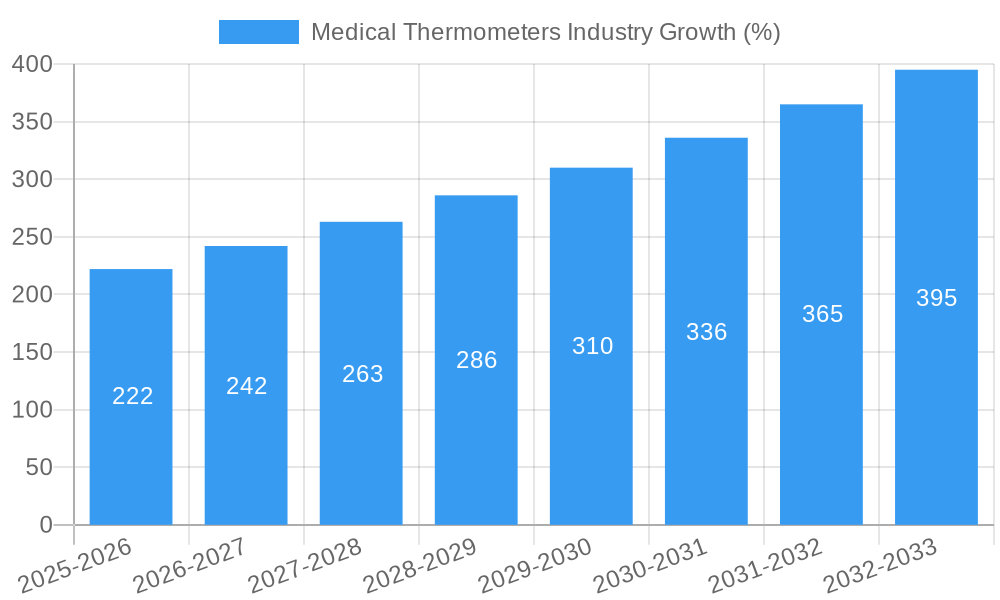
The medical thermometers market exhibited steady growth during the historical period (2019-2024), driven by increasing healthcare expenditure, rising prevalence of infectious diseases, and technological advancements. The market is expected to continue its growth trajectory, with a Compound Annual Growth Rate (CAGR) of xx% during the forecast period (2025-2033). The adoption rate of mercury-free thermometers is accelerating due to stricter regulations and environmental concerns. Technological disruptions, such as the introduction of smart thermometers with connectivity features, are transforming consumer behavior, fostering preference for more accurate and convenient options. Market penetration of digital thermometers continues to rise, particularly in developed economies. The market size is projected to reach xx Billion by 2033.
Dominant Regions, Countries, or Segments in Medical Thermometers Industry
North America and Europe currently hold the largest market share, driven by high healthcare expenditure and robust healthcare infrastructure. However, Asia-Pacific is projected to witness the fastest growth due to rising disposable incomes, increasing healthcare awareness, and expanding healthcare infrastructure. Within product types, the mercury-free segment is experiencing significant growth and is anticipated to dominate the market by 2033, reaching xx Billion. Among end-users, hospitals and clinics currently dominate, but the "Other End Users" segment, particularly home healthcare, exhibits significant growth potential.
- North America: High market share driven by advanced healthcare infrastructure and high adoption of digital thermometers.
- Europe: Significant market size due to well-established healthcare systems.
- Asia-Pacific: Fastest-growing region due to rising disposable incomes and expanding healthcare access.
- Mercury-Free Segment: Dominating growth due to safety and environmental regulations.
- Hospitals & Clinics: Largest end-user segment, with substantial growth expected in the "Other End Users" segment.
Medical Thermometers Industry Product Landscape
The medical thermometer market offers a diverse range of products, including traditional mercury-based, digital, infrared non-contact, and smart thermometers. Innovations focus on improving accuracy, speed, and user-friendliness. Unique selling propositions include features like instant readings, data logging capabilities, fever alerts, and wireless connectivity. Technological advancements such as improved sensor technology, advanced algorithms, and miniaturization are enhancing performance and expanding applications.
Key Drivers, Barriers & Challenges in Medical Thermometers Industry
Key Drivers: Increasing prevalence of infectious diseases, rising healthcare expenditure, technological advancements (e.g., non-contact thermometers), stringent safety regulations promoting mercury-free options, and growing demand for home healthcare.
Challenges & Restraints: High initial cost of advanced thermometers can limit adoption in low-income regions. Supply chain disruptions can impact product availability. Regulatory hurdles and stringent quality control requirements can increase manufacturing costs. Intense competition among established players and new entrants creates price pressure.
Emerging Opportunities in Medical Thermometers Industry
Emerging opportunities lie in the expansion of telehealth and remote patient monitoring, growing demand for smart thermometers with connected health capabilities, and untapped markets in developing economies. Further innovation in non-contact technologies and the development of affordable, reliable thermometers for low-resource settings present significant growth potential.
Growth Accelerators in the Medical Thermometers Industry Industry
Technological breakthroughs in sensor technology and data analytics are driving increased accuracy and convenience. Strategic partnerships between thermometer manufacturers and healthcare providers are expanding market reach and creating new distribution channels. Market expansion strategies focused on developing economies and underserved populations create significant growth opportunities.
Key Players Shaping the Medical Thermometers Industry Market
- Actherm Medical Corp
- Innovo Medical
- Exergen Corporation
- Citizen Systems Japan Co Ltd
- Microlife Corporation
- Cardinal Health
- Omron Healthcare Inc
- Welch Allyn Inc
- American Diagnostic Corporation
- A&D Company Limited
- List Not Exhaustive
Notable Milestones in Medical Thermometers Industry Sector
- June 2022: Exergen Corporation launched the TAT-2000 for professionals and TAT-2000C for consumers at the medical fair in Mumbai, India. This launch expanded Exergen's market reach and broadened its product portfolio.
- November 2022: TriMedika joined the UK Pavilion at MEDICA 2022 to showcase TRITEMP, a non-contact thermometer. This increased the visibility of TriMedika's product and potentially expanded its market access.
In-Depth Medical Thermometers Industry Market Outlook
The medical thermometers market is poised for continued growth driven by technological advancements, expanding healthcare infrastructure, and rising demand for convenient and accurate temperature measurement solutions. Strategic partnerships, innovative product development, and expansion into untapped markets will play crucial roles in shaping the future market landscape. The long-term outlook is optimistic, with significant potential for growth in both developed and developing economies.
Medical Thermometers Industry Segmentation
-
1. Product Type
- 1.1. Mercury-based
-
1.2. Mercury-free
- 1.2.1. Infrared
- 1.2.2. Digital
- 1.2.3. Other Product Types
-
2. End User
- 2.1. Hospitals
- 2.2. Clinics
- 2.3. Other End Users
Medical Thermometers Industry Segmentation By Geography
-
1. North America
- 1.1. United States
- 1.2. Canada
- 1.3. Mexico
-
2. Europe
- 2.1. Germany
- 2.2. United Kingdom
- 2.3. France
- 2.4. Italy
- 2.5. Spain
- 2.6. Rest of Europe
-
3. Asia Pacific
- 3.1. China
- 3.2. Japan
- 3.3. India
- 3.4. Australia
- 3.5. South Korea
- 3.6. Rest of Asia Pacific
-
4. Middle East and Africa
- 4.1. GCC
- 4.2. South Africa
- 4.3. Rest of Middle East and Africa
-
5. South America
- 5.1. Brazil
- 5.2. Argentina
- 5.3. Rest of South America
Medical Thermometers Industry REPORT HIGHLIGHTS
| Aspects | Details |
|---|---|
| Study Period | 2019-2033 |
| Base Year | 2024 |
| Estimated Year | 2025 |
| Forecast Period | 2025-2033 |
| Historical Period | 2019-2024 |
| Growth Rate | CAGR of 7.50% from 2019-2033 |
| Segmentation |
|
Table of Contents
- 1. Introduction
- 1.1. Research Scope
- 1.2. Market Segmentation
- 1.3. Research Methodology
- 1.4. Definitions and Assumptions
- 2. Executive Summary
- 2.1. Introduction
- 3. Market Dynamics
- 3.1. Introduction
- 3.2. Market Drivers
- 3.2.1. Growing Number of Medical Conditions Requiring Accurate Measurement of Body Temperature; Rapid Technological Advancements
- 3.3. Market Restrains
- 3.3.1. Stringent Governing Policies by Regulatory Healthcare Authority; Accuracy Issues With Infrared Thermometers
- 3.4. Market Trends
- 3.4.1. Digital Segment is Expected to Hold a Major Market Share in the Medical Thermometer Market
- 4. Market Factor Analysis
- 4.1. Porters Five Forces
- 4.2. Supply/Value Chain
- 4.3. PESTEL analysis
- 4.4. Market Entropy
- 4.5. Patent/Trademark Analysis
- 5. Global Medical Thermometers Industry Analysis, Insights and Forecast, 2019-2031
- 5.1. Market Analysis, Insights and Forecast - by Product Type
- 5.1.1. Mercury-based
- 5.1.2. Mercury-free
- 5.1.2.1. Infrared
- 5.1.2.2. Digital
- 5.1.2.3. Other Product Types
- 5.2. Market Analysis, Insights and Forecast - by End User
- 5.2.1. Hospitals
- 5.2.2. Clinics
- 5.2.3. Other End Users
- 5.3. Market Analysis, Insights and Forecast - by Region
- 5.3.1. North America
- 5.3.2. Europe
- 5.3.3. Asia Pacific
- 5.3.4. Middle East and Africa
- 5.3.5. South America
- 5.1. Market Analysis, Insights and Forecast - by Product Type
- 6. North America Medical Thermometers Industry Analysis, Insights and Forecast, 2019-2031
- 6.1. Market Analysis, Insights and Forecast - by Product Type
- 6.1.1. Mercury-based
- 6.1.2. Mercury-free
- 6.1.2.1. Infrared
- 6.1.2.2. Digital
- 6.1.2.3. Other Product Types
- 6.2. Market Analysis, Insights and Forecast - by End User
- 6.2.1. Hospitals
- 6.2.2. Clinics
- 6.2.3. Other End Users
- 6.1. Market Analysis, Insights and Forecast - by Product Type
- 7. Europe Medical Thermometers Industry Analysis, Insights and Forecast, 2019-2031
- 7.1. Market Analysis, Insights and Forecast - by Product Type
- 7.1.1. Mercury-based
- 7.1.2. Mercury-free
- 7.1.2.1. Infrared
- 7.1.2.2. Digital
- 7.1.2.3. Other Product Types
- 7.2. Market Analysis, Insights and Forecast - by End User
- 7.2.1. Hospitals
- 7.2.2. Clinics
- 7.2.3. Other End Users
- 7.1. Market Analysis, Insights and Forecast - by Product Type
- 8. Asia Pacific Medical Thermometers Industry Analysis, Insights and Forecast, 2019-2031
- 8.1. Market Analysis, Insights and Forecast - by Product Type
- 8.1.1. Mercury-based
- 8.1.2. Mercury-free
- 8.1.2.1. Infrared
- 8.1.2.2. Digital
- 8.1.2.3. Other Product Types
- 8.2. Market Analysis, Insights and Forecast - by End User
- 8.2.1. Hospitals
- 8.2.2. Clinics
- 8.2.3. Other End Users
- 8.1. Market Analysis, Insights and Forecast - by Product Type
- 9. Middle East and Africa Medical Thermometers Industry Analysis, Insights and Forecast, 2019-2031
- 9.1. Market Analysis, Insights and Forecast - by Product Type
- 9.1.1. Mercury-based
- 9.1.2. Mercury-free
- 9.1.2.1. Infrared
- 9.1.2.2. Digital
- 9.1.2.3. Other Product Types
- 9.2. Market Analysis, Insights and Forecast - by End User
- 9.2.1. Hospitals
- 9.2.2. Clinics
- 9.2.3. Other End Users
- 9.1. Market Analysis, Insights and Forecast - by Product Type
- 10. South America Medical Thermometers Industry Analysis, Insights and Forecast, 2019-2031
- 10.1. Market Analysis, Insights and Forecast - by Product Type
- 10.1.1. Mercury-based
- 10.1.2. Mercury-free
- 10.1.2.1. Infrared
- 10.1.2.2. Digital
- 10.1.2.3. Other Product Types
- 10.2. Market Analysis, Insights and Forecast - by End User
- 10.2.1. Hospitals
- 10.2.2. Clinics
- 10.2.3. Other End Users
- 10.1. Market Analysis, Insights and Forecast - by Product Type
- 11. North America Medical Thermometers Industry Analysis, Insights and Forecast, 2019-2031
- 11.1. Market Analysis, Insights and Forecast - By Country/Sub-region
- 11.1.1 United States
- 11.1.2 Canada
- 11.1.3 Mexico
- 12. South America Medical Thermometers Industry Analysis, Insights and Forecast, 2019-2031
- 12.1. Market Analysis, Insights and Forecast - By Country/Sub-region
- 12.1.1 Brazil
- 12.1.2 Mexico
- 12.1.3 Rest of South America
- 13. Europe Medical Thermometers Industry Analysis, Insights and Forecast, 2019-2031
- 13.1. Market Analysis, Insights and Forecast - By Country/Sub-region
- 13.1.1 United Kingdom
- 13.1.2 Germany
- 13.1.3 France
- 13.1.4 Italy
- 13.1.5 Spain
- 13.1.6 Russia
- 13.1.7 Rest of Europe
- 14. Asia Pacific Medical Thermometers Industry Analysis, Insights and Forecast, 2019-2031
- 14.1. Market Analysis, Insights and Forecast - By Country/Sub-region
- 14.1.1 China
- 14.1.2 Japan
- 14.1.3 India
- 14.1.4 South Korea
- 14.1.5 Taiwan
- 14.1.6 Australia
- 14.1.7 Rest of Asia-Pacific
- 15. MEA Medical Thermometers Industry Analysis, Insights and Forecast, 2019-2031
- 15.1. Market Analysis, Insights and Forecast - By Country/Sub-region
- 15.1.1 Middle East
- 15.1.2 Africa
- 16. Competitive Analysis
- 16.1. Global Market Share Analysis 2024
- 16.2. Company Profiles
- 16.2.1 Actherm Medical Corp
- 16.2.1.1. Overview
- 16.2.1.2. Products
- 16.2.1.3. SWOT Analysis
- 16.2.1.4. Recent Developments
- 16.2.1.5. Financials (Based on Availability)
- 16.2.2 Innovo Medical
- 16.2.2.1. Overview
- 16.2.2.2. Products
- 16.2.2.3. SWOT Analysis
- 16.2.2.4. Recent Developments
- 16.2.2.5. Financials (Based on Availability)
- 16.2.3 Exergen Corporation
- 16.2.3.1. Overview
- 16.2.3.2. Products
- 16.2.3.3. SWOT Analysis
- 16.2.3.4. Recent Developments
- 16.2.3.5. Financials (Based on Availability)
- 16.2.4 Citizen Systems Japan Co Ltd
- 16.2.4.1. Overview
- 16.2.4.2. Products
- 16.2.4.3. SWOT Analysis
- 16.2.4.4. Recent Developments
- 16.2.4.5. Financials (Based on Availability)
- 16.2.5 Microlife Corporation
- 16.2.5.1. Overview
- 16.2.5.2. Products
- 16.2.5.3. SWOT Analysis
- 16.2.5.4. Recent Developments
- 16.2.5.5. Financials (Based on Availability)
- 16.2.6 Cardinal Health
- 16.2.6.1. Overview
- 16.2.6.2. Products
- 16.2.6.3. SWOT Analysis
- 16.2.6.4. Recent Developments
- 16.2.6.5. Financials (Based on Availability)
- 16.2.7 Omron Healthcare Inc
- 16.2.7.1. Overview
- 16.2.7.2. Products
- 16.2.7.3. SWOT Analysis
- 16.2.7.4. Recent Developments
- 16.2.7.5. Financials (Based on Availability)
- 16.2.8 Welch Allyn Inc *List Not Exhaustive
- 16.2.8.1. Overview
- 16.2.8.2. Products
- 16.2.8.3. SWOT Analysis
- 16.2.8.4. Recent Developments
- 16.2.8.5. Financials (Based on Availability)
- 16.2.9 American Diagnostic Corporation
- 16.2.9.1. Overview
- 16.2.9.2. Products
- 16.2.9.3. SWOT Analysis
- 16.2.9.4. Recent Developments
- 16.2.9.5. Financials (Based on Availability)
- 16.2.10 A&D Company Limited
- 16.2.10.1. Overview
- 16.2.10.2. Products
- 16.2.10.3. SWOT Analysis
- 16.2.10.4. Recent Developments
- 16.2.10.5. Financials (Based on Availability)
- 16.2.1 Actherm Medical Corp
List of Figures
- Figure 1: Global Medical Thermometers Industry Revenue Breakdown (Billion, %) by Region 2024 & 2032
- Figure 2: Global Medical Thermometers Industry Volume Breakdown (K Units, %) by Region 2024 & 2032
- Figure 3: North America Medical Thermometers Industry Revenue (Billion), by Country 2024 & 2032
- Figure 4: North America Medical Thermometers Industry Volume (K Units), by Country 2024 & 2032
- Figure 5: North America Medical Thermometers Industry Revenue Share (%), by Country 2024 & 2032
- Figure 6: North America Medical Thermometers Industry Volume Share (%), by Country 2024 & 2032
- Figure 7: South America Medical Thermometers Industry Revenue (Billion), by Country 2024 & 2032
- Figure 8: South America Medical Thermometers Industry Volume (K Units), by Country 2024 & 2032
- Figure 9: South America Medical Thermometers Industry Revenue Share (%), by Country 2024 & 2032
- Figure 10: South America Medical Thermometers Industry Volume Share (%), by Country 2024 & 2032
- Figure 11: Europe Medical Thermometers Industry Revenue (Billion), by Country 2024 & 2032
- Figure 12: Europe Medical Thermometers Industry Volume (K Units), by Country 2024 & 2032
- Figure 13: Europe Medical Thermometers Industry Revenue Share (%), by Country 2024 & 2032
- Figure 14: Europe Medical Thermometers Industry Volume Share (%), by Country 2024 & 2032
- Figure 15: Asia Pacific Medical Thermometers Industry Revenue (Billion), by Country 2024 & 2032
- Figure 16: Asia Pacific Medical Thermometers Industry Volume (K Units), by Country 2024 & 2032
- Figure 17: Asia Pacific Medical Thermometers Industry Revenue Share (%), by Country 2024 & 2032
- Figure 18: Asia Pacific Medical Thermometers Industry Volume Share (%), by Country 2024 & 2032
- Figure 19: MEA Medical Thermometers Industry Revenue (Billion), by Country 2024 & 2032
- Figure 20: MEA Medical Thermometers Industry Volume (K Units), by Country 2024 & 2032
- Figure 21: MEA Medical Thermometers Industry Revenue Share (%), by Country 2024 & 2032
- Figure 22: MEA Medical Thermometers Industry Volume Share (%), by Country 2024 & 2032
- Figure 23: North America Medical Thermometers Industry Revenue (Billion), by Product Type 2024 & 2032
- Figure 24: North America Medical Thermometers Industry Volume (K Units), by Product Type 2024 & 2032
- Figure 25: North America Medical Thermometers Industry Revenue Share (%), by Product Type 2024 & 2032
- Figure 26: North America Medical Thermometers Industry Volume Share (%), by Product Type 2024 & 2032
- Figure 27: North America Medical Thermometers Industry Revenue (Billion), by End User 2024 & 2032
- Figure 28: North America Medical Thermometers Industry Volume (K Units), by End User 2024 & 2032
- Figure 29: North America Medical Thermometers Industry Revenue Share (%), by End User 2024 & 2032
- Figure 30: North America Medical Thermometers Industry Volume Share (%), by End User 2024 & 2032
- Figure 31: North America Medical Thermometers Industry Revenue (Billion), by Country 2024 & 2032
- Figure 32: North America Medical Thermometers Industry Volume (K Units), by Country 2024 & 2032
- Figure 33: North America Medical Thermometers Industry Revenue Share (%), by Country 2024 & 2032
- Figure 34: North America Medical Thermometers Industry Volume Share (%), by Country 2024 & 2032
- Figure 35: Europe Medical Thermometers Industry Revenue (Billion), by Product Type 2024 & 2032
- Figure 36: Europe Medical Thermometers Industry Volume (K Units), by Product Type 2024 & 2032
- Figure 37: Europe Medical Thermometers Industry Revenue Share (%), by Product Type 2024 & 2032
- Figure 38: Europe Medical Thermometers Industry Volume Share (%), by Product Type 2024 & 2032
- Figure 39: Europe Medical Thermometers Industry Revenue (Billion), by End User 2024 & 2032
- Figure 40: Europe Medical Thermometers Industry Volume (K Units), by End User 2024 & 2032
- Figure 41: Europe Medical Thermometers Industry Revenue Share (%), by End User 2024 & 2032
- Figure 42: Europe Medical Thermometers Industry Volume Share (%), by End User 2024 & 2032
- Figure 43: Europe Medical Thermometers Industry Revenue (Billion), by Country 2024 & 2032
- Figure 44: Europe Medical Thermometers Industry Volume (K Units), by Country 2024 & 2032
- Figure 45: Europe Medical Thermometers Industry Revenue Share (%), by Country 2024 & 2032
- Figure 46: Europe Medical Thermometers Industry Volume Share (%), by Country 2024 & 2032
- Figure 47: Asia Pacific Medical Thermometers Industry Revenue (Billion), by Product Type 2024 & 2032
- Figure 48: Asia Pacific Medical Thermometers Industry Volume (K Units), by Product Type 2024 & 2032
- Figure 49: Asia Pacific Medical Thermometers Industry Revenue Share (%), by Product Type 2024 & 2032
- Figure 50: Asia Pacific Medical Thermometers Industry Volume Share (%), by Product Type 2024 & 2032
- Figure 51: Asia Pacific Medical Thermometers Industry Revenue (Billion), by End User 2024 & 2032
- Figure 52: Asia Pacific Medical Thermometers Industry Volume (K Units), by End User 2024 & 2032
- Figure 53: Asia Pacific Medical Thermometers Industry Revenue Share (%), by End User 2024 & 2032
- Figure 54: Asia Pacific Medical Thermometers Industry Volume Share (%), by End User 2024 & 2032
- Figure 55: Asia Pacific Medical Thermometers Industry Revenue (Billion), by Country 2024 & 2032
- Figure 56: Asia Pacific Medical Thermometers Industry Volume (K Units), by Country 2024 & 2032
- Figure 57: Asia Pacific Medical Thermometers Industry Revenue Share (%), by Country 2024 & 2032
- Figure 58: Asia Pacific Medical Thermometers Industry Volume Share (%), by Country 2024 & 2032
- Figure 59: Middle East and Africa Medical Thermometers Industry Revenue (Billion), by Product Type 2024 & 2032
- Figure 60: Middle East and Africa Medical Thermometers Industry Volume (K Units), by Product Type 2024 & 2032
- Figure 61: Middle East and Africa Medical Thermometers Industry Revenue Share (%), by Product Type 2024 & 2032
- Figure 62: Middle East and Africa Medical Thermometers Industry Volume Share (%), by Product Type 2024 & 2032
- Figure 63: Middle East and Africa Medical Thermometers Industry Revenue (Billion), by End User 2024 & 2032
- Figure 64: Middle East and Africa Medical Thermometers Industry Volume (K Units), by End User 2024 & 2032
- Figure 65: Middle East and Africa Medical Thermometers Industry Revenue Share (%), by End User 2024 & 2032
- Figure 66: Middle East and Africa Medical Thermometers Industry Volume Share (%), by End User 2024 & 2032
- Figure 67: Middle East and Africa Medical Thermometers Industry Revenue (Billion), by Country 2024 & 2032
- Figure 68: Middle East and Africa Medical Thermometers Industry Volume (K Units), by Country 2024 & 2032
- Figure 69: Middle East and Africa Medical Thermometers Industry Revenue Share (%), by Country 2024 & 2032
- Figure 70: Middle East and Africa Medical Thermometers Industry Volume Share (%), by Country 2024 & 2032
- Figure 71: South America Medical Thermometers Industry Revenue (Billion), by Product Type 2024 & 2032
- Figure 72: South America Medical Thermometers Industry Volume (K Units), by Product Type 2024 & 2032
- Figure 73: South America Medical Thermometers Industry Revenue Share (%), by Product Type 2024 & 2032
- Figure 74: South America Medical Thermometers Industry Volume Share (%), by Product Type 2024 & 2032
- Figure 75: South America Medical Thermometers Industry Revenue (Billion), by End User 2024 & 2032
- Figure 76: South America Medical Thermometers Industry Volume (K Units), by End User 2024 & 2032
- Figure 77: South America Medical Thermometers Industry Revenue Share (%), by End User 2024 & 2032
- Figure 78: South America Medical Thermometers Industry Volume Share (%), by End User 2024 & 2032
- Figure 79: South America Medical Thermometers Industry Revenue (Billion), by Country 2024 & 2032
- Figure 80: South America Medical Thermometers Industry Volume (K Units), by Country 2024 & 2032
- Figure 81: South America Medical Thermometers Industry Revenue Share (%), by Country 2024 & 2032
- Figure 82: South America Medical Thermometers Industry Volume Share (%), by Country 2024 & 2032
List of Tables
- Table 1: Global Medical Thermometers Industry Revenue Billion Forecast, by Region 2019 & 2032
- Table 2: Global Medical Thermometers Industry Volume K Units Forecast, by Region 2019 & 2032
- Table 3: Global Medical Thermometers Industry Revenue Billion Forecast, by Product Type 2019 & 2032
- Table 4: Global Medical Thermometers Industry Volume K Units Forecast, by Product Type 2019 & 2032
- Table 5: Global Medical Thermometers Industry Revenue Billion Forecast, by End User 2019 & 2032
- Table 6: Global Medical Thermometers Industry Volume K Units Forecast, by End User 2019 & 2032
- Table 7: Global Medical Thermometers Industry Revenue Billion Forecast, by Region 2019 & 2032
- Table 8: Global Medical Thermometers Industry Volume K Units Forecast, by Region 2019 & 2032
- Table 9: Global Medical Thermometers Industry Revenue Billion Forecast, by Country 2019 & 2032
- Table 10: Global Medical Thermometers Industry Volume K Units Forecast, by Country 2019 & 2032
- Table 11: United States Medical Thermometers Industry Revenue (Billion) Forecast, by Application 2019 & 2032
- Table 12: United States Medical Thermometers Industry Volume (K Units) Forecast, by Application 2019 & 2032
- Table 13: Canada Medical Thermometers Industry Revenue (Billion) Forecast, by Application 2019 & 2032
- Table 14: Canada Medical Thermometers Industry Volume (K Units) Forecast, by Application 2019 & 2032
- Table 15: Mexico Medical Thermometers Industry Revenue (Billion) Forecast, by Application 2019 & 2032
- Table 16: Mexico Medical Thermometers Industry Volume (K Units) Forecast, by Application 2019 & 2032
- Table 17: Global Medical Thermometers Industry Revenue Billion Forecast, by Country 2019 & 2032
- Table 18: Global Medical Thermometers Industry Volume K Units Forecast, by Country 2019 & 2032
- Table 19: Brazil Medical Thermometers Industry Revenue (Billion) Forecast, by Application 2019 & 2032
- Table 20: Brazil Medical Thermometers Industry Volume (K Units) Forecast, by Application 2019 & 2032
- Table 21: Mexico Medical Thermometers Industry Revenue (Billion) Forecast, by Application 2019 & 2032
- Table 22: Mexico Medical Thermometers Industry Volume (K Units) Forecast, by Application 2019 & 2032
- Table 23: Rest of South America Medical Thermometers Industry Revenue (Billion) Forecast, by Application 2019 & 2032
- Table 24: Rest of South America Medical Thermometers Industry Volume (K Units) Forecast, by Application 2019 & 2032
- Table 25: Global Medical Thermometers Industry Revenue Billion Forecast, by Country 2019 & 2032
- Table 26: Global Medical Thermometers Industry Volume K Units Forecast, by Country 2019 & 2032
- Table 27: United Kingdom Medical Thermometers Industry Revenue (Billion) Forecast, by Application 2019 & 2032
- Table 28: United Kingdom Medical Thermometers Industry Volume (K Units) Forecast, by Application 2019 & 2032
- Table 29: Germany Medical Thermometers Industry Revenue (Billion) Forecast, by Application 2019 & 2032
- Table 30: Germany Medical Thermometers Industry Volume (K Units) Forecast, by Application 2019 & 2032
- Table 31: France Medical Thermometers Industry Revenue (Billion) Forecast, by Application 2019 & 2032
- Table 32: France Medical Thermometers Industry Volume (K Units) Forecast, by Application 2019 & 2032
- Table 33: Italy Medical Thermometers Industry Revenue (Billion) Forecast, by Application 2019 & 2032
- Table 34: Italy Medical Thermometers Industry Volume (K Units) Forecast, by Application 2019 & 2032
- Table 35: Spain Medical Thermometers Industry Revenue (Billion) Forecast, by Application 2019 & 2032
- Table 36: Spain Medical Thermometers Industry Volume (K Units) Forecast, by Application 2019 & 2032
- Table 37: Russia Medical Thermometers Industry Revenue (Billion) Forecast, by Application 2019 & 2032
- Table 38: Russia Medical Thermometers Industry Volume (K Units) Forecast, by Application 2019 & 2032
- Table 39: Rest of Europe Medical Thermometers Industry Revenue (Billion) Forecast, by Application 2019 & 2032
- Table 40: Rest of Europe Medical Thermometers Industry Volume (K Units) Forecast, by Application 2019 & 2032
- Table 41: Global Medical Thermometers Industry Revenue Billion Forecast, by Country 2019 & 2032
- Table 42: Global Medical Thermometers Industry Volume K Units Forecast, by Country 2019 & 2032
- Table 43: China Medical Thermometers Industry Revenue (Billion) Forecast, by Application 2019 & 2032
- Table 44: China Medical Thermometers Industry Volume (K Units) Forecast, by Application 2019 & 2032
- Table 45: Japan Medical Thermometers Industry Revenue (Billion) Forecast, by Application 2019 & 2032
- Table 46: Japan Medical Thermometers Industry Volume (K Units) Forecast, by Application 2019 & 2032
- Table 47: India Medical Thermometers Industry Revenue (Billion) Forecast, by Application 2019 & 2032
- Table 48: India Medical Thermometers Industry Volume (K Units) Forecast, by Application 2019 & 2032
- Table 49: South Korea Medical Thermometers Industry Revenue (Billion) Forecast, by Application 2019 & 2032
- Table 50: South Korea Medical Thermometers Industry Volume (K Units) Forecast, by Application 2019 & 2032
- Table 51: Taiwan Medical Thermometers Industry Revenue (Billion) Forecast, by Application 2019 & 2032
- Table 52: Taiwan Medical Thermometers Industry Volume (K Units) Forecast, by Application 2019 & 2032
- Table 53: Australia Medical Thermometers Industry Revenue (Billion) Forecast, by Application 2019 & 2032
- Table 54: Australia Medical Thermometers Industry Volume (K Units) Forecast, by Application 2019 & 2032
- Table 55: Rest of Asia-Pacific Medical Thermometers Industry Revenue (Billion) Forecast, by Application 2019 & 2032
- Table 56: Rest of Asia-Pacific Medical Thermometers Industry Volume (K Units) Forecast, by Application 2019 & 2032
- Table 57: Global Medical Thermometers Industry Revenue Billion Forecast, by Country 2019 & 2032
- Table 58: Global Medical Thermometers Industry Volume K Units Forecast, by Country 2019 & 2032
- Table 59: Middle East Medical Thermometers Industry Revenue (Billion) Forecast, by Application 2019 & 2032
- Table 60: Middle East Medical Thermometers Industry Volume (K Units) Forecast, by Application 2019 & 2032
- Table 61: Africa Medical Thermometers Industry Revenue (Billion) Forecast, by Application 2019 & 2032
- Table 62: Africa Medical Thermometers Industry Volume (K Units) Forecast, by Application 2019 & 2032
- Table 63: Global Medical Thermometers Industry Revenue Billion Forecast, by Product Type 2019 & 2032
- Table 64: Global Medical Thermometers Industry Volume K Units Forecast, by Product Type 2019 & 2032
- Table 65: Global Medical Thermometers Industry Revenue Billion Forecast, by End User 2019 & 2032
- Table 66: Global Medical Thermometers Industry Volume K Units Forecast, by End User 2019 & 2032
- Table 67: Global Medical Thermometers Industry Revenue Billion Forecast, by Country 2019 & 2032
- Table 68: Global Medical Thermometers Industry Volume K Units Forecast, by Country 2019 & 2032
- Table 69: United States Medical Thermometers Industry Revenue (Billion) Forecast, by Application 2019 & 2032
- Table 70: United States Medical Thermometers Industry Volume (K Units) Forecast, by Application 2019 & 2032
- Table 71: Canada Medical Thermometers Industry Revenue (Billion) Forecast, by Application 2019 & 2032
- Table 72: Canada Medical Thermometers Industry Volume (K Units) Forecast, by Application 2019 & 2032
- Table 73: Mexico Medical Thermometers Industry Revenue (Billion) Forecast, by Application 2019 & 2032
- Table 74: Mexico Medical Thermometers Industry Volume (K Units) Forecast, by Application 2019 & 2032
- Table 75: Global Medical Thermometers Industry Revenue Billion Forecast, by Product Type 2019 & 2032
- Table 76: Global Medical Thermometers Industry Volume K Units Forecast, by Product Type 2019 & 2032
- Table 77: Global Medical Thermometers Industry Revenue Billion Forecast, by End User 2019 & 2032
- Table 78: Global Medical Thermometers Industry Volume K Units Forecast, by End User 2019 & 2032
- Table 79: Global Medical Thermometers Industry Revenue Billion Forecast, by Country 2019 & 2032
- Table 80: Global Medical Thermometers Industry Volume K Units Forecast, by Country 2019 & 2032
- Table 81: Germany Medical Thermometers Industry Revenue (Billion) Forecast, by Application 2019 & 2032
- Table 82: Germany Medical Thermometers Industry Volume (K Units) Forecast, by Application 2019 & 2032
- Table 83: United Kingdom Medical Thermometers Industry Revenue (Billion) Forecast, by Application 2019 & 2032
- Table 84: United Kingdom Medical Thermometers Industry Volume (K Units) Forecast, by Application 2019 & 2032
- Table 85: France Medical Thermometers Industry Revenue (Billion) Forecast, by Application 2019 & 2032
- Table 86: France Medical Thermometers Industry Volume (K Units) Forecast, by Application 2019 & 2032
- Table 87: Italy Medical Thermometers Industry Revenue (Billion) Forecast, by Application 2019 & 2032
- Table 88: Italy Medical Thermometers Industry Volume (K Units) Forecast, by Application 2019 & 2032
- Table 89: Spain Medical Thermometers Industry Revenue (Billion) Forecast, by Application 2019 & 2032
- Table 90: Spain Medical Thermometers Industry Volume (K Units) Forecast, by Application 2019 & 2032
- Table 91: Rest of Europe Medical Thermometers Industry Revenue (Billion) Forecast, by Application 2019 & 2032
- Table 92: Rest of Europe Medical Thermometers Industry Volume (K Units) Forecast, by Application 2019 & 2032
- Table 93: Global Medical Thermometers Industry Revenue Billion Forecast, by Product Type 2019 & 2032
- Table 94: Global Medical Thermometers Industry Volume K Units Forecast, by Product Type 2019 & 2032
- Table 95: Global Medical Thermometers Industry Revenue Billion Forecast, by End User 2019 & 2032
- Table 96: Global Medical Thermometers Industry Volume K Units Forecast, by End User 2019 & 2032
- Table 97: Global Medical Thermometers Industry Revenue Billion Forecast, by Country 2019 & 2032
- Table 98: Global Medical Thermometers Industry Volume K Units Forecast, by Country 2019 & 2032
- Table 99: China Medical Thermometers Industry Revenue (Billion) Forecast, by Application 2019 & 2032
- Table 100: China Medical Thermometers Industry Volume (K Units) Forecast, by Application 2019 & 2032
- Table 101: Japan Medical Thermometers Industry Revenue (Billion) Forecast, by Application 2019 & 2032
- Table 102: Japan Medical Thermometers Industry Volume (K Units) Forecast, by Application 2019 & 2032
- Table 103: India Medical Thermometers Industry Revenue (Billion) Forecast, by Application 2019 & 2032
- Table 104: India Medical Thermometers Industry Volume (K Units) Forecast, by Application 2019 & 2032
- Table 105: Australia Medical Thermometers Industry Revenue (Billion) Forecast, by Application 2019 & 2032
- Table 106: Australia Medical Thermometers Industry Volume (K Units) Forecast, by Application 2019 & 2032
- Table 107: South Korea Medical Thermometers Industry Revenue (Billion) Forecast, by Application 2019 & 2032
- Table 108: South Korea Medical Thermometers Industry Volume (K Units) Forecast, by Application 2019 & 2032
- Table 109: Rest of Asia Pacific Medical Thermometers Industry Revenue (Billion) Forecast, by Application 2019 & 2032
- Table 110: Rest of Asia Pacific Medical Thermometers Industry Volume (K Units) Forecast, by Application 2019 & 2032
- Table 111: Global Medical Thermometers Industry Revenue Billion Forecast, by Product Type 2019 & 2032
- Table 112: Global Medical Thermometers Industry Volume K Units Forecast, by Product Type 2019 & 2032
- Table 113: Global Medical Thermometers Industry Revenue Billion Forecast, by End User 2019 & 2032
- Table 114: Global Medical Thermometers Industry Volume K Units Forecast, by End User 2019 & 2032
- Table 115: Global Medical Thermometers Industry Revenue Billion Forecast, by Country 2019 & 2032
- Table 116: Global Medical Thermometers Industry Volume K Units Forecast, by Country 2019 & 2032
- Table 117: GCC Medical Thermometers Industry Revenue (Billion) Forecast, by Application 2019 & 2032
- Table 118: GCC Medical Thermometers Industry Volume (K Units) Forecast, by Application 2019 & 2032
- Table 119: South Africa Medical Thermometers Industry Revenue (Billion) Forecast, by Application 2019 & 2032
- Table 120: South Africa Medical Thermometers Industry Volume (K Units) Forecast, by Application 2019 & 2032
- Table 121: Rest of Middle East and Africa Medical Thermometers Industry Revenue (Billion) Forecast, by Application 2019 & 2032
- Table 122: Rest of Middle East and Africa Medical Thermometers Industry Volume (K Units) Forecast, by Application 2019 & 2032
- Table 123: Global Medical Thermometers Industry Revenue Billion Forecast, by Product Type 2019 & 2032
- Table 124: Global Medical Thermometers Industry Volume K Units Forecast, by Product Type 2019 & 2032
- Table 125: Global Medical Thermometers Industry Revenue Billion Forecast, by End User 2019 & 2032
- Table 126: Global Medical Thermometers Industry Volume K Units Forecast, by End User 2019 & 2032
- Table 127: Global Medical Thermometers Industry Revenue Billion Forecast, by Country 2019 & 2032
- Table 128: Global Medical Thermometers Industry Volume K Units Forecast, by Country 2019 & 2032
- Table 129: Brazil Medical Thermometers Industry Revenue (Billion) Forecast, by Application 2019 & 2032
- Table 130: Brazil Medical Thermometers Industry Volume (K Units) Forecast, by Application 2019 & 2032
- Table 131: Argentina Medical Thermometers Industry Revenue (Billion) Forecast, by Application 2019 & 2032
- Table 132: Argentina Medical Thermometers Industry Volume (K Units) Forecast, by Application 2019 & 2032
- Table 133: Rest of South America Medical Thermometers Industry Revenue (Billion) Forecast, by Application 2019 & 2032
- Table 134: Rest of South America Medical Thermometers Industry Volume (K Units) Forecast, by Application 2019 & 2032
Frequently Asked Questions
1. What is the projected Compound Annual Growth Rate (CAGR) of the Medical Thermometers Industry?
The projected CAGR is approximately 7.50%.
2. Which companies are prominent players in the Medical Thermometers Industry?
Key companies in the market include Actherm Medical Corp, Innovo Medical, Exergen Corporation, Citizen Systems Japan Co Ltd, Microlife Corporation, Cardinal Health, Omron Healthcare Inc, Welch Allyn Inc *List Not Exhaustive, American Diagnostic Corporation, A&D Company Limited.
3. What are the main segments of the Medical Thermometers Industry?
The market segments include Product Type, End User.
4. Can you provide details about the market size?
The market size is estimated to be USD 3.1 Billion as of 2022.
5. What are some drivers contributing to market growth?
Growing Number of Medical Conditions Requiring Accurate Measurement of Body Temperature; Rapid Technological Advancements.
6. What are the notable trends driving market growth?
Digital Segment is Expected to Hold a Major Market Share in the Medical Thermometer Market.
7. Are there any restraints impacting market growth?
Stringent Governing Policies by Regulatory Healthcare Authority; Accuracy Issues With Infrared Thermometers.
8. Can you provide examples of recent developments in the market?
November 2022: TriMedika joined the UK Pavilion at MEDICA 2022 to showcase TRITEMP, a non-contact thermometer.
9. What pricing options are available for accessing the report?
Pricing options include single-user, multi-user, and enterprise licenses priced at USD 4750, USD 5250, and USD 8750 respectively.
10. Is the market size provided in terms of value or volume?
The market size is provided in terms of value, measured in Billion and volume, measured in K Units.
11. Are there any specific market keywords associated with the report?
Yes, the market keyword associated with the report is "Medical Thermometers Industry," which aids in identifying and referencing the specific market segment covered.
12. How do I determine which pricing option suits my needs best?
The pricing options vary based on user requirements and access needs. Individual users may opt for single-user licenses, while businesses requiring broader access may choose multi-user or enterprise licenses for cost-effective access to the report.
13. Are there any additional resources or data provided in the Medical Thermometers Industry report?
While the report offers comprehensive insights, it's advisable to review the specific contents or supplementary materials provided to ascertain if additional resources or data are available.
14. How can I stay updated on further developments or reports in the Medical Thermometers Industry?
To stay informed about further developments, trends, and reports in the Medical Thermometers Industry, consider subscribing to industry newsletters, following relevant companies and organizations, or regularly checking reputable industry news sources and publications.
Methodology
Step 1 - Identification of Relevant Samples Size from Population Database


Step 2 - Approaches for Defining Global Market Size (Value, Volume* & Price*)

Note*: In applicable scenarios
Step 3 - Data Sources
Primary Research
- Web Analytics
- Survey Reports
- Research Institute
- Latest Research Reports
- Opinion Leaders
Secondary Research
- Annual Reports
- White Paper
- Latest Press Release
- Industry Association
- Paid Database
- Investor Presentations

Step 4 - Data Triangulation
Involves using different sources of information in order to increase the validity of a study
These sources are likely to be stakeholders in a program - participants, other researchers, program staff, other community members, and so on.
Then we put all data in single framework & apply various statistical tools to find out the dynamic on the market.
During the analysis stage, feedback from the stakeholder groups would be compared to determine areas of agreement as well as areas of divergence


