
Key Insights
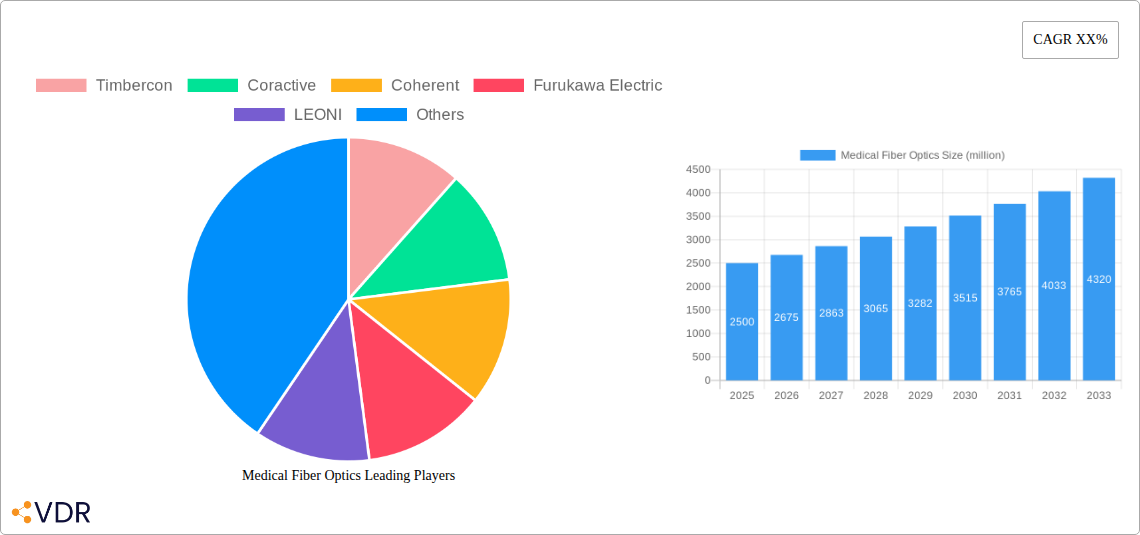
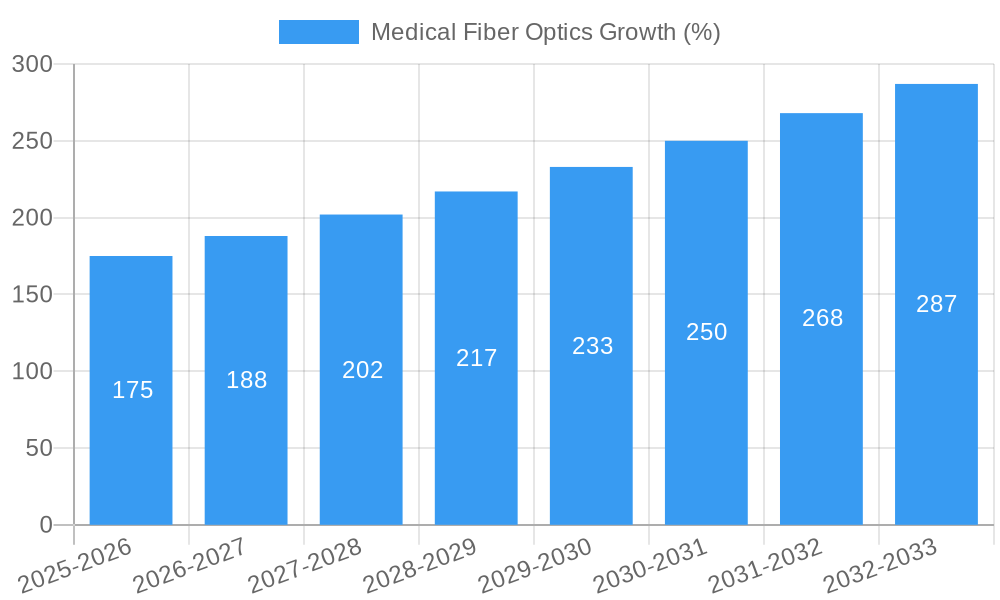
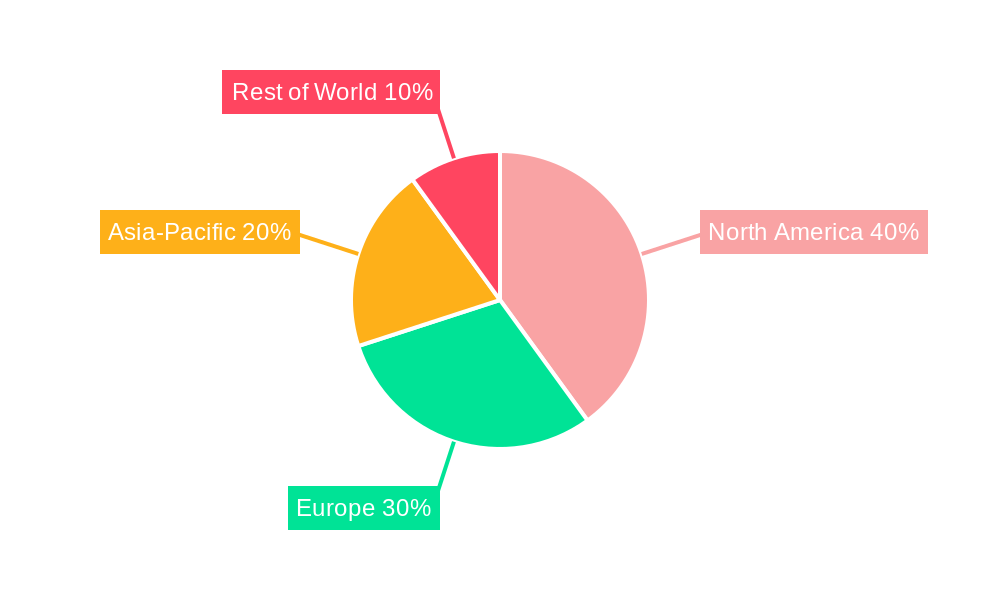
The medical fiber optics market is experiencing robust growth, driven by the increasing demand for minimally invasive surgical procedures, advancements in imaging technologies, and the rising prevalence of chronic diseases requiring advanced diagnostic and therapeutic interventions. The market's expansion is fueled by the superior capabilities of fiber optics in transmitting light and images with high precision, enabling surgeons to perform complex procedures with greater accuracy and reduced invasiveness. This translates to faster recovery times for patients and improved overall healthcare outcomes. Technological innovations, such as the development of smaller, more flexible fibers and advanced imaging modalities like optical coherence tomography (OCT), are further accelerating market growth. While challenges such as high initial investment costs for equipment and the need for specialized training for medical professionals exist, the long-term benefits in terms of improved patient care and cost-effectiveness are driving widespread adoption. We estimate the market size to be approximately $2.5 billion in 2025, growing at a CAGR of 7% over the forecast period (2025-2033). This growth is expected to be driven primarily by North America and Europe, due to higher healthcare spending and technological advancements in these regions.
Key players like Timbercon, Coractive, Coherent, Furukawa Electric, LEONI, Fujikura, Molex, Corning, Laser Components, Fiberoptics, Innofiber, and Gulf Fiberoptics are actively contributing to market expansion through continuous research and development, strategic partnerships, and product diversification. Competitive rivalry is intense, with companies focusing on product differentiation, superior performance, and cost-effectiveness to gain market share. The market is segmented based on fiber type (single-mode, multi-mode), application (imaging, illumination, sensing), and end-user (hospitals, clinics, ambulatory surgical centers). Future growth prospects hinge on the successful integration of fiber optics into newer medical technologies, the development of more sophisticated imaging and therapeutic devices, and the continued expansion of minimally invasive surgical techniques globally. The market's future growth trajectory looks promising, driven by the increasing focus on improving healthcare outcomes through technological advancements.
Medical Fiber Optics Market Report: 2019-2033
This comprehensive report provides an in-depth analysis of the Medical Fiber Optics market, encompassing market dynamics, growth trends, regional segmentation, product landscape, key players, and future outlook. The study period spans 2019-2033, with 2025 as the base and estimated year. The forecast period covers 2025-2033, and the historical period analyzed is 2019-2024. This report is crucial for stakeholders in the parent market of Medical Devices and the child market of Optical Components seeking to understand the market landscape and make informed strategic decisions.
Medical Fiber Optics Market Dynamics & Structure
The medical fiber optics market, valued at xx million units in 2025, exhibits a moderately consolidated structure. Major players such as Corning, Coherent, and Fujikura hold significant market share, estimated at a combined xx%. Technological innovation, particularly in areas like minimally invasive surgery and advanced imaging, is a key driver, alongside the increasing demand for high-bandwidth, flexible, and biocompatible fibers. Stringent regulatory frameworks, such as those set by the FDA, influence product development and market access. Competitive substitutes, such as traditional wired technologies, face challenges in meeting the demands of precision and flexibility offered by fiber optics. The end-user demographics encompass hospitals, clinics, and research institutions, exhibiting varying adoption rates based on technological sophistication and financial capabilities. Mergers and acquisitions (M&A) activity has been moderate in recent years, with xx deals recorded between 2019 and 2024, primarily focused on enhancing technological capabilities and expanding market reach.
- Market Concentration: Moderately consolidated, with top 3 players holding xx% market share in 2025.
- Technological Innovation: Miniaturization, improved biocompatibility, and higher bandwidth are key drivers.
- Regulatory Framework: Stringent FDA and other global regulatory requirements influence market entry.
- Competitive Substitutes: Traditional wired technologies face competition from the flexibility and precision of fiber optics.
- End-User Demographics: Hospitals, clinics, and research institutions are the primary end-users.
- M&A Activity: xx M&A deals between 2019 and 2024, focusing on technological advancement and market expansion.
Medical Fiber Optics Growth Trends & Insights
The medical fiber optics market is projected to experience significant growth during the forecast period (2025-2033), driven by a Compound Annual Growth Rate (CAGR) of xx%. This growth is fueled by the increasing adoption of minimally invasive surgical procedures, rising demand for advanced medical imaging techniques, and continuous technological advancements leading to improved fiber optic performance and miniaturization. Market penetration rates are steadily increasing, particularly in developed economies, with a projected penetration rate of xx% by 2033. The shift towards technologically advanced healthcare solutions and the growing geriatric population contribute to higher demand. Technological disruptions, such as the integration of artificial intelligence and machine learning in medical imaging systems, are accelerating market expansion. Consumer behavior is shifting towards higher preference for minimally invasive procedures, resulting in increased demand for advanced fiber optics technology.
Dominant Regions, Countries, or Segments in Medical Fiber Optics
North America currently dominates the medical fiber optics market, holding a market share of approximately xx% in 2025. This dominance is attributed to factors such as high adoption rates of advanced medical technologies, substantial investments in healthcare infrastructure, strong regulatory frameworks supporting innovation, and a large pool of skilled medical professionals. Europe holds a significant market share (xx%) due to high healthcare expenditure and stringent medical safety standards. The Asia-Pacific region is anticipated to exhibit the fastest growth rate during the forecast period, driven by burgeoning healthcare infrastructure development, rising disposable income, and increasing awareness of advanced medical procedures.
- North America: High adoption rates, robust healthcare infrastructure, and strong regulatory support.
- Europe: High healthcare expenditure and stringent medical safety standards.
- Asia-Pacific: Fastest growth rate driven by infrastructure development, rising disposable income, and awareness of advanced procedures.
Medical Fiber Optics Product Landscape
The medical fiber optics market encompasses a range of products, including imaging fibers, illumination fibers, delivery fibers, and sensing fibers. These fibers vary in diameter, numerical aperture, and biocompatibility. Recent innovations focus on smaller diameter fibers for enhanced precision in minimally invasive procedures, improved biocompatibility for reduced tissue damage, and higher bandwidth for improved imaging resolution. The unique selling propositions of these fibers include their ability to transmit light over long distances with minimal loss, facilitating improved image quality and precision in surgical interventions.
Key Drivers, Barriers & Challenges in Medical Fiber Optics
Key Drivers:
- Increasing demand for minimally invasive surgical procedures.
- Rising adoption of advanced medical imaging techniques.
- Technological advancements leading to improved fiber optic performance.
Challenges & Restraints:
- High initial investment costs associated with adopting advanced fiber optic systems.
- Potential for signal degradation due to bending and handling of delicate fibers.
- Stringent regulatory requirements for medical devices.
- Supply chain disruptions impacting the availability of raw materials.
Emerging Opportunities in Medical Fiber Optics
The integration of fiber optics with AI and machine learning presents significant opportunities. The development of new biocompatible materials and more robust, flexible fiber designs will expand applications. Untapped markets in developing economies offer considerable growth potential.
Growth Accelerators in the Medical Fiber Optics Industry
Technological breakthroughs in fiber optics manufacturing, such as the development of smaller and more flexible fibers, are key growth accelerators. Strategic partnerships between fiber optic manufacturers and medical device companies are fostering innovation. Expansion into new applications, such as advanced endoscopy and optical coherence tomography (OCT), is driving market growth.
Key Players Shaping the Medical Fiber Optics Market
- Timbercon
- Coractive
- Coherent
- Furukawa Electric
- LEONI
- Fujikura
- Molex
- Corning
- Laser Components
- Fiberoptics
- Innofiber
- Gulf Fiberoptics
Notable Milestones in Medical Fiber Optics Sector
- 2020: Introduction of a new biocompatible fiber by Corning.
- 2022: Partnership between Fujikura and a leading medical device company to develop a new imaging system.
- 2023: FDA approval of a new fiber optic-based surgical instrument.
In-Depth Medical Fiber Optics Market Outlook
The medical fiber optics market is poised for sustained growth over the next decade. Technological advancements, strategic partnerships, and expansion into new applications will drive market expansion. Companies that effectively leverage technological innovation and cater to the growing demand for minimally invasive procedures will capture significant market share. The increasing adoption of advanced medical technologies, coupled with a growing global population, ensures a robust market outlook for medical fiber optics.
Medical Fiber Optics Segmentation
-
1. Application
- 1.1. Endoscopes
- 1.2. Laser Fiberoptics
- 1.3. Fiberoptic Surgical/Dental Lights
- 1.4. Fiberoptic Sensors
- 1.5. Others
-
2. Types
- 2.1. Silica Fiber/Glass Fiber Optics
- 2.2. Plastic Fiber Optics
Medical Fiber Optics Segmentation By Geography
-
1. North America
- 1.1. United States
- 1.2. Canada
- 1.3. Mexico
-
2. South America
- 2.1. Brazil
- 2.2. Argentina
- 2.3. Rest of South America
-
3. Europe
- 3.1. United Kingdom
- 3.2. Germany
- 3.3. France
- 3.4. Italy
- 3.5. Spain
- 3.6. Russia
- 3.7. Benelux
- 3.8. Nordics
- 3.9. Rest of Europe
-
4. Middle East & Africa
- 4.1. Turkey
- 4.2. Israel
- 4.3. GCC
- 4.4. North Africa
- 4.5. South Africa
- 4.6. Rest of Middle East & Africa
-
5. Asia Pacific
- 5.1. China
- 5.2. India
- 5.3. Japan
- 5.4. South Korea
- 5.5. ASEAN
- 5.6. Oceania
- 5.7. Rest of Asia Pacific
Medical Fiber Optics REPORT HIGHLIGHTS
| Aspects | Details |
|---|---|
| Study Period | 2019-2033 |
| Base Year | 2024 |
| Estimated Year | 2025 |
| Forecast Period | 2025-2033 |
| Historical Period | 2019-2024 |
| Growth Rate | CAGR of XX% from 2019-2033 |
| Segmentation |
|
Table of Contents
- 1. Introduction
- 1.1. Research Scope
- 1.2. Market Segmentation
- 1.3. Research Methodology
- 1.4. Definitions and Assumptions
- 2. Executive Summary
- 2.1. Introduction
- 3. Market Dynamics
- 3.1. Introduction
- 3.2. Market Drivers
- 3.3. Market Restrains
- 3.4. Market Trends
- 4. Market Factor Analysis
- 4.1. Porters Five Forces
- 4.2. Supply/Value Chain
- 4.3. PESTEL analysis
- 4.4. Market Entropy
- 4.5. Patent/Trademark Analysis
- 5. Global Medical Fiber Optics Analysis, Insights and Forecast, 2019-2031
- 5.1. Market Analysis, Insights and Forecast - by Application
- 5.1.1. Endoscopes
- 5.1.2. Laser Fiberoptics
- 5.1.3. Fiberoptic Surgical/Dental Lights
- 5.1.4. Fiberoptic Sensors
- 5.1.5. Others
- 5.2. Market Analysis, Insights and Forecast - by Types
- 5.2.1. Silica Fiber/Glass Fiber Optics
- 5.2.2. Plastic Fiber Optics
- 5.3. Market Analysis, Insights and Forecast - by Region
- 5.3.1. North America
- 5.3.2. South America
- 5.3.3. Europe
- 5.3.4. Middle East & Africa
- 5.3.5. Asia Pacific
- 5.1. Market Analysis, Insights and Forecast - by Application
- 6. North America Medical Fiber Optics Analysis, Insights and Forecast, 2019-2031
- 6.1. Market Analysis, Insights and Forecast - by Application
- 6.1.1. Endoscopes
- 6.1.2. Laser Fiberoptics
- 6.1.3. Fiberoptic Surgical/Dental Lights
- 6.1.4. Fiberoptic Sensors
- 6.1.5. Others
- 6.2. Market Analysis, Insights and Forecast - by Types
- 6.2.1. Silica Fiber/Glass Fiber Optics
- 6.2.2. Plastic Fiber Optics
- 6.1. Market Analysis, Insights and Forecast - by Application
- 7. South America Medical Fiber Optics Analysis, Insights and Forecast, 2019-2031
- 7.1. Market Analysis, Insights and Forecast - by Application
- 7.1.1. Endoscopes
- 7.1.2. Laser Fiberoptics
- 7.1.3. Fiberoptic Surgical/Dental Lights
- 7.1.4. Fiberoptic Sensors
- 7.1.5. Others
- 7.2. Market Analysis, Insights and Forecast - by Types
- 7.2.1. Silica Fiber/Glass Fiber Optics
- 7.2.2. Plastic Fiber Optics
- 7.1. Market Analysis, Insights and Forecast - by Application
- 8. Europe Medical Fiber Optics Analysis, Insights and Forecast, 2019-2031
- 8.1. Market Analysis, Insights and Forecast - by Application
- 8.1.1. Endoscopes
- 8.1.2. Laser Fiberoptics
- 8.1.3. Fiberoptic Surgical/Dental Lights
- 8.1.4. Fiberoptic Sensors
- 8.1.5. Others
- 8.2. Market Analysis, Insights and Forecast - by Types
- 8.2.1. Silica Fiber/Glass Fiber Optics
- 8.2.2. Plastic Fiber Optics
- 8.1. Market Analysis, Insights and Forecast - by Application
- 9. Middle East & Africa Medical Fiber Optics Analysis, Insights and Forecast, 2019-2031
- 9.1. Market Analysis, Insights and Forecast - by Application
- 9.1.1. Endoscopes
- 9.1.2. Laser Fiberoptics
- 9.1.3. Fiberoptic Surgical/Dental Lights
- 9.1.4. Fiberoptic Sensors
- 9.1.5. Others
- 9.2. Market Analysis, Insights and Forecast - by Types
- 9.2.1. Silica Fiber/Glass Fiber Optics
- 9.2.2. Plastic Fiber Optics
- 9.1. Market Analysis, Insights and Forecast - by Application
- 10. Asia Pacific Medical Fiber Optics Analysis, Insights and Forecast, 2019-2031
- 10.1. Market Analysis, Insights and Forecast - by Application
- 10.1.1. Endoscopes
- 10.1.2. Laser Fiberoptics
- 10.1.3. Fiberoptic Surgical/Dental Lights
- 10.1.4. Fiberoptic Sensors
- 10.1.5. Others
- 10.2. Market Analysis, Insights and Forecast - by Types
- 10.2.1. Silica Fiber/Glass Fiber Optics
- 10.2.2. Plastic Fiber Optics
- 10.1. Market Analysis, Insights and Forecast - by Application
- 11. Competitive Analysis
- 11.1. Global Market Share Analysis 2024
- 11.2. Company Profiles
- 11.2.1 Timbercon
- 11.2.1.1. Overview
- 11.2.1.2. Products
- 11.2.1.3. SWOT Analysis
- 11.2.1.4. Recent Developments
- 11.2.1.5. Financials (Based on Availability)
- 11.2.2 Coractive
- 11.2.2.1. Overview
- 11.2.2.2. Products
- 11.2.2.3. SWOT Analysis
- 11.2.2.4. Recent Developments
- 11.2.2.5. Financials (Based on Availability)
- 11.2.3 Coherent
- 11.2.3.1. Overview
- 11.2.3.2. Products
- 11.2.3.3. SWOT Analysis
- 11.2.3.4. Recent Developments
- 11.2.3.5. Financials (Based on Availability)
- 11.2.4 Furukawa Electric
- 11.2.4.1. Overview
- 11.2.4.2. Products
- 11.2.4.3. SWOT Analysis
- 11.2.4.4. Recent Developments
- 11.2.4.5. Financials (Based on Availability)
- 11.2.5 LEONI
- 11.2.5.1. Overview
- 11.2.5.2. Products
- 11.2.5.3. SWOT Analysis
- 11.2.5.4. Recent Developments
- 11.2.5.5. Financials (Based on Availability)
- 11.2.6 Fujikura
- 11.2.6.1. Overview
- 11.2.6.2. Products
- 11.2.6.3. SWOT Analysis
- 11.2.6.4. Recent Developments
- 11.2.6.5. Financials (Based on Availability)
- 11.2.7 Molex
- 11.2.7.1. Overview
- 11.2.7.2. Products
- 11.2.7.3. SWOT Analysis
- 11.2.7.4. Recent Developments
- 11.2.7.5. Financials (Based on Availability)
- 11.2.8 Corning
- 11.2.8.1. Overview
- 11.2.8.2. Products
- 11.2.8.3. SWOT Analysis
- 11.2.8.4. Recent Developments
- 11.2.8.5. Financials (Based on Availability)
- 11.2.9 Laser Components
- 11.2.9.1. Overview
- 11.2.9.2. Products
- 11.2.9.3. SWOT Analysis
- 11.2.9.4. Recent Developments
- 11.2.9.5. Financials (Based on Availability)
- 11.2.10 Fiberoptics
- 11.2.10.1. Overview
- 11.2.10.2. Products
- 11.2.10.3. SWOT Analysis
- 11.2.10.4. Recent Developments
- 11.2.10.5. Financials (Based on Availability)
- 11.2.11 Innofiber
- 11.2.11.1. Overview
- 11.2.11.2. Products
- 11.2.11.3. SWOT Analysis
- 11.2.11.4. Recent Developments
- 11.2.11.5. Financials (Based on Availability)
- 11.2.12 Gulf Fiberoptics
- 11.2.12.1. Overview
- 11.2.12.2. Products
- 11.2.12.3. SWOT Analysis
- 11.2.12.4. Recent Developments
- 11.2.12.5. Financials (Based on Availability)
- 11.2.1 Timbercon
List of Figures
- Figure 1: Global Medical Fiber Optics Revenue Breakdown (million, %) by Region 2024 & 2032
- Figure 2: Global Medical Fiber Optics Volume Breakdown (K, %) by Region 2024 & 2032
- Figure 3: North America Medical Fiber Optics Revenue (million), by Application 2024 & 2032
- Figure 4: North America Medical Fiber Optics Volume (K), by Application 2024 & 2032
- Figure 5: North America Medical Fiber Optics Revenue Share (%), by Application 2024 & 2032
- Figure 6: North America Medical Fiber Optics Volume Share (%), by Application 2024 & 2032
- Figure 7: North America Medical Fiber Optics Revenue (million), by Types 2024 & 2032
- Figure 8: North America Medical Fiber Optics Volume (K), by Types 2024 & 2032
- Figure 9: North America Medical Fiber Optics Revenue Share (%), by Types 2024 & 2032
- Figure 10: North America Medical Fiber Optics Volume Share (%), by Types 2024 & 2032
- Figure 11: North America Medical Fiber Optics Revenue (million), by Country 2024 & 2032
- Figure 12: North America Medical Fiber Optics Volume (K), by Country 2024 & 2032
- Figure 13: North America Medical Fiber Optics Revenue Share (%), by Country 2024 & 2032
- Figure 14: North America Medical Fiber Optics Volume Share (%), by Country 2024 & 2032
- Figure 15: South America Medical Fiber Optics Revenue (million), by Application 2024 & 2032
- Figure 16: South America Medical Fiber Optics Volume (K), by Application 2024 & 2032
- Figure 17: South America Medical Fiber Optics Revenue Share (%), by Application 2024 & 2032
- Figure 18: South America Medical Fiber Optics Volume Share (%), by Application 2024 & 2032
- Figure 19: South America Medical Fiber Optics Revenue (million), by Types 2024 & 2032
- Figure 20: South America Medical Fiber Optics Volume (K), by Types 2024 & 2032
- Figure 21: South America Medical Fiber Optics Revenue Share (%), by Types 2024 & 2032
- Figure 22: South America Medical Fiber Optics Volume Share (%), by Types 2024 & 2032
- Figure 23: South America Medical Fiber Optics Revenue (million), by Country 2024 & 2032
- Figure 24: South America Medical Fiber Optics Volume (K), by Country 2024 & 2032
- Figure 25: South America Medical Fiber Optics Revenue Share (%), by Country 2024 & 2032
- Figure 26: South America Medical Fiber Optics Volume Share (%), by Country 2024 & 2032
- Figure 27: Europe Medical Fiber Optics Revenue (million), by Application 2024 & 2032
- Figure 28: Europe Medical Fiber Optics Volume (K), by Application 2024 & 2032
- Figure 29: Europe Medical Fiber Optics Revenue Share (%), by Application 2024 & 2032
- Figure 30: Europe Medical Fiber Optics Volume Share (%), by Application 2024 & 2032
- Figure 31: Europe Medical Fiber Optics Revenue (million), by Types 2024 & 2032
- Figure 32: Europe Medical Fiber Optics Volume (K), by Types 2024 & 2032
- Figure 33: Europe Medical Fiber Optics Revenue Share (%), by Types 2024 & 2032
- Figure 34: Europe Medical Fiber Optics Volume Share (%), by Types 2024 & 2032
- Figure 35: Europe Medical Fiber Optics Revenue (million), by Country 2024 & 2032
- Figure 36: Europe Medical Fiber Optics Volume (K), by Country 2024 & 2032
- Figure 37: Europe Medical Fiber Optics Revenue Share (%), by Country 2024 & 2032
- Figure 38: Europe Medical Fiber Optics Volume Share (%), by Country 2024 & 2032
- Figure 39: Middle East & Africa Medical Fiber Optics Revenue (million), by Application 2024 & 2032
- Figure 40: Middle East & Africa Medical Fiber Optics Volume (K), by Application 2024 & 2032
- Figure 41: Middle East & Africa Medical Fiber Optics Revenue Share (%), by Application 2024 & 2032
- Figure 42: Middle East & Africa Medical Fiber Optics Volume Share (%), by Application 2024 & 2032
- Figure 43: Middle East & Africa Medical Fiber Optics Revenue (million), by Types 2024 & 2032
- Figure 44: Middle East & Africa Medical Fiber Optics Volume (K), by Types 2024 & 2032
- Figure 45: Middle East & Africa Medical Fiber Optics Revenue Share (%), by Types 2024 & 2032
- Figure 46: Middle East & Africa Medical Fiber Optics Volume Share (%), by Types 2024 & 2032
- Figure 47: Middle East & Africa Medical Fiber Optics Revenue (million), by Country 2024 & 2032
- Figure 48: Middle East & Africa Medical Fiber Optics Volume (K), by Country 2024 & 2032
- Figure 49: Middle East & Africa Medical Fiber Optics Revenue Share (%), by Country 2024 & 2032
- Figure 50: Middle East & Africa Medical Fiber Optics Volume Share (%), by Country 2024 & 2032
- Figure 51: Asia Pacific Medical Fiber Optics Revenue (million), by Application 2024 & 2032
- Figure 52: Asia Pacific Medical Fiber Optics Volume (K), by Application 2024 & 2032
- Figure 53: Asia Pacific Medical Fiber Optics Revenue Share (%), by Application 2024 & 2032
- Figure 54: Asia Pacific Medical Fiber Optics Volume Share (%), by Application 2024 & 2032
- Figure 55: Asia Pacific Medical Fiber Optics Revenue (million), by Types 2024 & 2032
- Figure 56: Asia Pacific Medical Fiber Optics Volume (K), by Types 2024 & 2032
- Figure 57: Asia Pacific Medical Fiber Optics Revenue Share (%), by Types 2024 & 2032
- Figure 58: Asia Pacific Medical Fiber Optics Volume Share (%), by Types 2024 & 2032
- Figure 59: Asia Pacific Medical Fiber Optics Revenue (million), by Country 2024 & 2032
- Figure 60: Asia Pacific Medical Fiber Optics Volume (K), by Country 2024 & 2032
- Figure 61: Asia Pacific Medical Fiber Optics Revenue Share (%), by Country 2024 & 2032
- Figure 62: Asia Pacific Medical Fiber Optics Volume Share (%), by Country 2024 & 2032
List of Tables
- Table 1: Global Medical Fiber Optics Revenue million Forecast, by Region 2019 & 2032
- Table 2: Global Medical Fiber Optics Volume K Forecast, by Region 2019 & 2032
- Table 3: Global Medical Fiber Optics Revenue million Forecast, by Application 2019 & 2032
- Table 4: Global Medical Fiber Optics Volume K Forecast, by Application 2019 & 2032
- Table 5: Global Medical Fiber Optics Revenue million Forecast, by Types 2019 & 2032
- Table 6: Global Medical Fiber Optics Volume K Forecast, by Types 2019 & 2032
- Table 7: Global Medical Fiber Optics Revenue million Forecast, by Region 2019 & 2032
- Table 8: Global Medical Fiber Optics Volume K Forecast, by Region 2019 & 2032
- Table 9: Global Medical Fiber Optics Revenue million Forecast, by Application 2019 & 2032
- Table 10: Global Medical Fiber Optics Volume K Forecast, by Application 2019 & 2032
- Table 11: Global Medical Fiber Optics Revenue million Forecast, by Types 2019 & 2032
- Table 12: Global Medical Fiber Optics Volume K Forecast, by Types 2019 & 2032
- Table 13: Global Medical Fiber Optics Revenue million Forecast, by Country 2019 & 2032
- Table 14: Global Medical Fiber Optics Volume K Forecast, by Country 2019 & 2032
- Table 15: United States Medical Fiber Optics Revenue (million) Forecast, by Application 2019 & 2032
- Table 16: United States Medical Fiber Optics Volume (K) Forecast, by Application 2019 & 2032
- Table 17: Canada Medical Fiber Optics Revenue (million) Forecast, by Application 2019 & 2032
- Table 18: Canada Medical Fiber Optics Volume (K) Forecast, by Application 2019 & 2032
- Table 19: Mexico Medical Fiber Optics Revenue (million) Forecast, by Application 2019 & 2032
- Table 20: Mexico Medical Fiber Optics Volume (K) Forecast, by Application 2019 & 2032
- Table 21: Global Medical Fiber Optics Revenue million Forecast, by Application 2019 & 2032
- Table 22: Global Medical Fiber Optics Volume K Forecast, by Application 2019 & 2032
- Table 23: Global Medical Fiber Optics Revenue million Forecast, by Types 2019 & 2032
- Table 24: Global Medical Fiber Optics Volume K Forecast, by Types 2019 & 2032
- Table 25: Global Medical Fiber Optics Revenue million Forecast, by Country 2019 & 2032
- Table 26: Global Medical Fiber Optics Volume K Forecast, by Country 2019 & 2032
- Table 27: Brazil Medical Fiber Optics Revenue (million) Forecast, by Application 2019 & 2032
- Table 28: Brazil Medical Fiber Optics Volume (K) Forecast, by Application 2019 & 2032
- Table 29: Argentina Medical Fiber Optics Revenue (million) Forecast, by Application 2019 & 2032
- Table 30: Argentina Medical Fiber Optics Volume (K) Forecast, by Application 2019 & 2032
- Table 31: Rest of South America Medical Fiber Optics Revenue (million) Forecast, by Application 2019 & 2032
- Table 32: Rest of South America Medical Fiber Optics Volume (K) Forecast, by Application 2019 & 2032
- Table 33: Global Medical Fiber Optics Revenue million Forecast, by Application 2019 & 2032
- Table 34: Global Medical Fiber Optics Volume K Forecast, by Application 2019 & 2032
- Table 35: Global Medical Fiber Optics Revenue million Forecast, by Types 2019 & 2032
- Table 36: Global Medical Fiber Optics Volume K Forecast, by Types 2019 & 2032
- Table 37: Global Medical Fiber Optics Revenue million Forecast, by Country 2019 & 2032
- Table 38: Global Medical Fiber Optics Volume K Forecast, by Country 2019 & 2032
- Table 39: United Kingdom Medical Fiber Optics Revenue (million) Forecast, by Application 2019 & 2032
- Table 40: United Kingdom Medical Fiber Optics Volume (K) Forecast, by Application 2019 & 2032
- Table 41: Germany Medical Fiber Optics Revenue (million) Forecast, by Application 2019 & 2032
- Table 42: Germany Medical Fiber Optics Volume (K) Forecast, by Application 2019 & 2032
- Table 43: France Medical Fiber Optics Revenue (million) Forecast, by Application 2019 & 2032
- Table 44: France Medical Fiber Optics Volume (K) Forecast, by Application 2019 & 2032
- Table 45: Italy Medical Fiber Optics Revenue (million) Forecast, by Application 2019 & 2032
- Table 46: Italy Medical Fiber Optics Volume (K) Forecast, by Application 2019 & 2032
- Table 47: Spain Medical Fiber Optics Revenue (million) Forecast, by Application 2019 & 2032
- Table 48: Spain Medical Fiber Optics Volume (K) Forecast, by Application 2019 & 2032
- Table 49: Russia Medical Fiber Optics Revenue (million) Forecast, by Application 2019 & 2032
- Table 50: Russia Medical Fiber Optics Volume (K) Forecast, by Application 2019 & 2032
- Table 51: Benelux Medical Fiber Optics Revenue (million) Forecast, by Application 2019 & 2032
- Table 52: Benelux Medical Fiber Optics Volume (K) Forecast, by Application 2019 & 2032
- Table 53: Nordics Medical Fiber Optics Revenue (million) Forecast, by Application 2019 & 2032
- Table 54: Nordics Medical Fiber Optics Volume (K) Forecast, by Application 2019 & 2032
- Table 55: Rest of Europe Medical Fiber Optics Revenue (million) Forecast, by Application 2019 & 2032
- Table 56: Rest of Europe Medical Fiber Optics Volume (K) Forecast, by Application 2019 & 2032
- Table 57: Global Medical Fiber Optics Revenue million Forecast, by Application 2019 & 2032
- Table 58: Global Medical Fiber Optics Volume K Forecast, by Application 2019 & 2032
- Table 59: Global Medical Fiber Optics Revenue million Forecast, by Types 2019 & 2032
- Table 60: Global Medical Fiber Optics Volume K Forecast, by Types 2019 & 2032
- Table 61: Global Medical Fiber Optics Revenue million Forecast, by Country 2019 & 2032
- Table 62: Global Medical Fiber Optics Volume K Forecast, by Country 2019 & 2032
- Table 63: Turkey Medical Fiber Optics Revenue (million) Forecast, by Application 2019 & 2032
- Table 64: Turkey Medical Fiber Optics Volume (K) Forecast, by Application 2019 & 2032
- Table 65: Israel Medical Fiber Optics Revenue (million) Forecast, by Application 2019 & 2032
- Table 66: Israel Medical Fiber Optics Volume (K) Forecast, by Application 2019 & 2032
- Table 67: GCC Medical Fiber Optics Revenue (million) Forecast, by Application 2019 & 2032
- Table 68: GCC Medical Fiber Optics Volume (K) Forecast, by Application 2019 & 2032
- Table 69: North Africa Medical Fiber Optics Revenue (million) Forecast, by Application 2019 & 2032
- Table 70: North Africa Medical Fiber Optics Volume (K) Forecast, by Application 2019 & 2032
- Table 71: South Africa Medical Fiber Optics Revenue (million) Forecast, by Application 2019 & 2032
- Table 72: South Africa Medical Fiber Optics Volume (K) Forecast, by Application 2019 & 2032
- Table 73: Rest of Middle East & Africa Medical Fiber Optics Revenue (million) Forecast, by Application 2019 & 2032
- Table 74: Rest of Middle East & Africa Medical Fiber Optics Volume (K) Forecast, by Application 2019 & 2032
- Table 75: Global Medical Fiber Optics Revenue million Forecast, by Application 2019 & 2032
- Table 76: Global Medical Fiber Optics Volume K Forecast, by Application 2019 & 2032
- Table 77: Global Medical Fiber Optics Revenue million Forecast, by Types 2019 & 2032
- Table 78: Global Medical Fiber Optics Volume K Forecast, by Types 2019 & 2032
- Table 79: Global Medical Fiber Optics Revenue million Forecast, by Country 2019 & 2032
- Table 80: Global Medical Fiber Optics Volume K Forecast, by Country 2019 & 2032
- Table 81: China Medical Fiber Optics Revenue (million) Forecast, by Application 2019 & 2032
- Table 82: China Medical Fiber Optics Volume (K) Forecast, by Application 2019 & 2032
- Table 83: India Medical Fiber Optics Revenue (million) Forecast, by Application 2019 & 2032
- Table 84: India Medical Fiber Optics Volume (K) Forecast, by Application 2019 & 2032
- Table 85: Japan Medical Fiber Optics Revenue (million) Forecast, by Application 2019 & 2032
- Table 86: Japan Medical Fiber Optics Volume (K) Forecast, by Application 2019 & 2032
- Table 87: South Korea Medical Fiber Optics Revenue (million) Forecast, by Application 2019 & 2032
- Table 88: South Korea Medical Fiber Optics Volume (K) Forecast, by Application 2019 & 2032
- Table 89: ASEAN Medical Fiber Optics Revenue (million) Forecast, by Application 2019 & 2032
- Table 90: ASEAN Medical Fiber Optics Volume (K) Forecast, by Application 2019 & 2032
- Table 91: Oceania Medical Fiber Optics Revenue (million) Forecast, by Application 2019 & 2032
- Table 92: Oceania Medical Fiber Optics Volume (K) Forecast, by Application 2019 & 2032
- Table 93: Rest of Asia Pacific Medical Fiber Optics Revenue (million) Forecast, by Application 2019 & 2032
- Table 94: Rest of Asia Pacific Medical Fiber Optics Volume (K) Forecast, by Application 2019 & 2032
Frequently Asked Questions
1. What is the projected Compound Annual Growth Rate (CAGR) of the Medical Fiber Optics?
The projected CAGR is approximately XX%.
2. Which companies are prominent players in the Medical Fiber Optics?
Key companies in the market include Timbercon, Coractive, Coherent, Furukawa Electric, LEONI, Fujikura, Molex, Corning, Laser Components, Fiberoptics, Innofiber, Gulf Fiberoptics.
3. What are the main segments of the Medical Fiber Optics?
The market segments include Application, Types.
4. Can you provide details about the market size?
The market size is estimated to be USD XXX million as of 2022.
5. What are some drivers contributing to market growth?
N/A
6. What are the notable trends driving market growth?
N/A
7. Are there any restraints impacting market growth?
N/A
8. Can you provide examples of recent developments in the market?
N/A
9. What pricing options are available for accessing the report?
Pricing options include single-user, multi-user, and enterprise licenses priced at USD 3350.00, USD 5025.00, and USD 6700.00 respectively.
10. Is the market size provided in terms of value or volume?
The market size is provided in terms of value, measured in million and volume, measured in K.
11. Are there any specific market keywords associated with the report?
Yes, the market keyword associated with the report is "Medical Fiber Optics," which aids in identifying and referencing the specific market segment covered.
12. How do I determine which pricing option suits my needs best?
The pricing options vary based on user requirements and access needs. Individual users may opt for single-user licenses, while businesses requiring broader access may choose multi-user or enterprise licenses for cost-effective access to the report.
13. Are there any additional resources or data provided in the Medical Fiber Optics report?
While the report offers comprehensive insights, it's advisable to review the specific contents or supplementary materials provided to ascertain if additional resources or data are available.
14. How can I stay updated on further developments or reports in the Medical Fiber Optics?
To stay informed about further developments, trends, and reports in the Medical Fiber Optics, consider subscribing to industry newsletters, following relevant companies and organizations, or regularly checking reputable industry news sources and publications.
Methodology
Step 1 - Identification of Relevant Samples Size from Population Database


Step 2 - Approaches for Defining Global Market Size (Value, Volume* & Price*)

Note*: In applicable scenarios
Step 3 - Data Sources
Primary Research
- Web Analytics
- Survey Reports
- Research Institute
- Latest Research Reports
- Opinion Leaders
Secondary Research
- Annual Reports
- White Paper
- Latest Press Release
- Industry Association
- Paid Database
- Investor Presentations

Step 4 - Data Triangulation
Involves using different sources of information in order to increase the validity of a study
These sources are likely to be stakeholders in a program - participants, other researchers, program staff, other community members, and so on.
Then we put all data in single framework & apply various statistical tools to find out the dynamic on the market.
During the analysis stage, feedback from the stakeholder groups would be compared to determine areas of agreement as well as areas of divergence


