
Key Insights
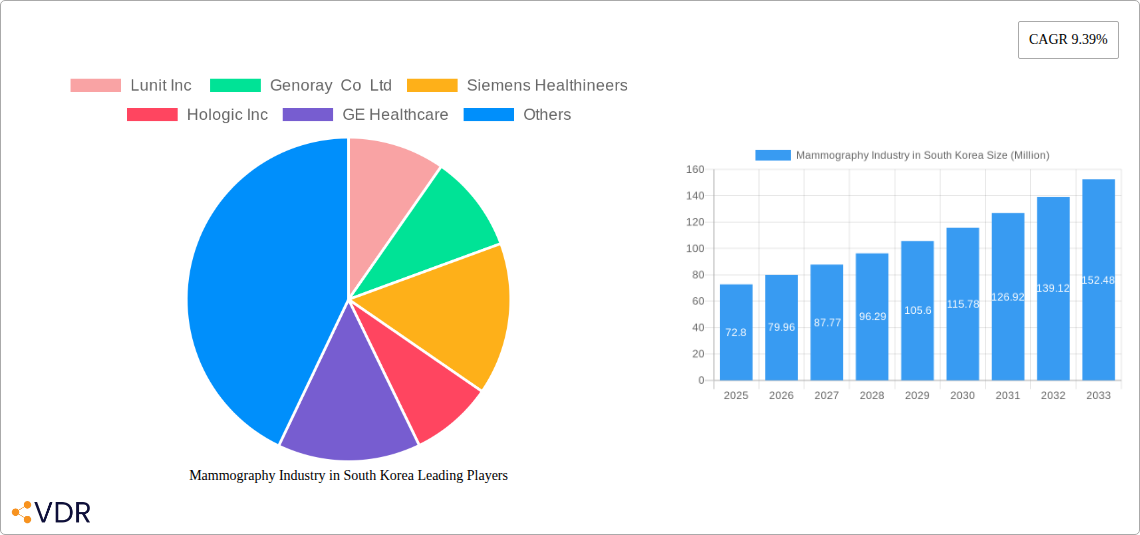
The South Korean mammography market, valued at $72.80 million in 2025, is projected to experience robust growth, driven by a rising geriatric population susceptible to breast cancer, increasing healthcare expenditure, and rising awareness about preventive healthcare. Technological advancements, particularly in digital mammography and breast tomosynthesis, are significantly contributing to market expansion. Digital systems offer superior image quality and efficient workflow, while tomosynthesis provides improved diagnostic accuracy, leading to earlier detection and improved patient outcomes. The market is segmented by product type (digital, analog, tomosynthesis, others) and end-user (hospitals, specialty clinics, diagnostic centers), with digital systems and hospitals holding the largest market shares, respectively. Growth is also fueled by government initiatives promoting early detection programs and the increasing adoption of advanced imaging technologies in healthcare facilities across the country. However, high initial investment costs associated with advanced systems and a potential shortage of trained radiologists could pose challenges to market growth. The competitive landscape is marked by both international players like Siemens Healthineers, Hologic, and GE Healthcare and domestic companies like Lunit Inc and Genoray Co Ltd, resulting in a dynamic market with ongoing innovation and competition.
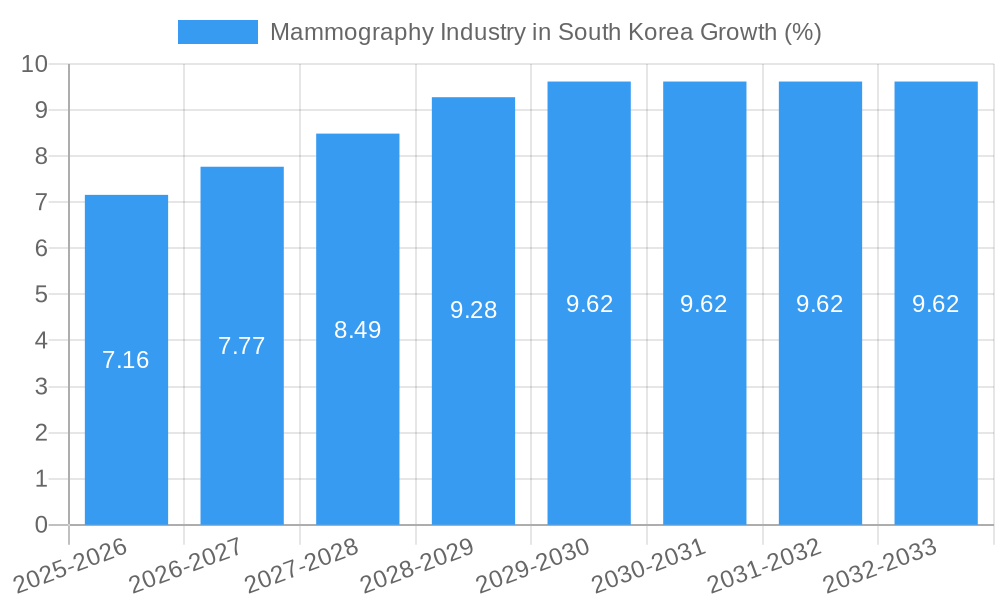
Looking ahead to 2033, the South Korean mammography market is expected to maintain a healthy Compound Annual Growth Rate (CAGR), propelled by factors like the continued expansion of the healthcare infrastructure, increasing private insurance coverage, and the introduction of innovative imaging solutions. The focus will likely shift towards more sophisticated systems with advanced analytics and AI-powered diagnostic tools. This will demand continued investments in training and infrastructure to support the deployment and utilization of these technologies effectively. The market will see a continued expansion in the adoption of breast tomosynthesis, driven by its proven efficacy in early cancer detection. Strategic partnerships between technology providers and healthcare facilities will become increasingly crucial for facilitating market growth and expanding access to advanced mammography services across the country. The market's success will hinge on addressing challenges related to affordability and ensuring equitable access to advanced mammography technologies across all regions of South Korea.
Mammography Industry in South Korea: Market Report 2019-2033
This comprehensive report provides a detailed analysis of the South Korean mammography market, covering market dynamics, growth trends, competitive landscape, and future outlook. The report utilizes data from 2019-2024 (Historical Period), with 2025 as the base year, and projects the market until 2033 (Forecast Period). This in-depth analysis is crucial for industry professionals, investors, and strategic decision-makers seeking to understand and capitalize on the opportunities within this vital healthcare sector. The report segments the market by product type (Digital Systems, Analog Systems, Breast Tomosynthesis, Other Product Types) and end-user (Hospitals, Specialty Clinics, Diagnostic Centers).
Mammography Industry in South Korea Market Dynamics & Structure
The South Korean mammography market is experiencing moderate consolidation, with both international and domestic players vying for market share. Technological innovation, particularly in AI-powered image analysis and tomosynthesis, is a key driver. Stringent regulatory frameworks from the MFDS (Ministry of Food and Drug Safety) influence product approvals and market entry. The market faces competition from alternative breast imaging techniques, although mammography remains the gold standard for early detection. The aging population and rising incidence of breast cancer are significant demand-side factors. M&A activity has been relatively low, with a reported xx million USD in deals during 2019-2024, primarily focused on technology integration and expansion.
- Market Concentration: Moderately concentrated, with top 5 players holding approximately xx% market share in 2024.
- Technological Innovation: AI-driven image analysis and advanced tomosynthesis systems are driving growth.
- Regulatory Framework: Stringent MFDS regulations impact product approvals and market entry.
- Competitive Substitutes: Alternative imaging techniques like ultrasound and MRI pose some competition.
- End-User Demographics: Aging population and increasing breast cancer awareness fuel demand.
- M&A Trends: Relatively low M&A activity, xx million USD during 2019-2024, focused on technology integration.
Mammography Industry in South Korea Growth Trends & Insights
The South Korean mammography market exhibited a CAGR of xx% during 2019-2024, reaching a market size of xx million units in 2024. Driven by increasing breast cancer awareness campaigns, government initiatives promoting early detection, and technological advancements, the market is expected to continue its growth trajectory. Adoption rates of digital mammography systems have been steadily rising, surpassing analog systems in market share. The growing adoption of breast tomosynthesis, offering improved image quality and reduced false positives, is a major contributor to market expansion. Consumer behavior is shifting toward preference for higher-quality, technologically advanced systems with shorter examination times and faster results. The forecast period (2025-2033) projects a CAGR of xx%, driven by continued technological innovation and increased government investment in healthcare infrastructure.
Dominant Regions, Countries, or Segments in Mammography Industry in South Korea
The Seoul Metropolitan Area dominates the South Korean mammography market, accounting for approximately xx% of the total market value in 2024 due to higher healthcare infrastructure density and greater concentration of hospitals and diagnostic centers. Within the product type segment, Digital Systems hold the largest market share (xx%), followed by Breast Tomosynthesis (xx%), reflecting the ongoing shift toward advanced imaging technology. Hospitals are the largest end-user segment (xx%), owing to their greater capacity and comprehensive service offerings.
- Key Drivers (Seoul Metropolitan Area):
- High concentration of hospitals and diagnostic centers.
- Advanced healthcare infrastructure.
- Higher healthcare expenditure per capita.
- Key Drivers (Digital Systems):
- Superior image quality compared to analog systems.
- Enhanced diagnostic capabilities.
- Growing preference for digital imaging in healthcare.
- Key Drivers (Hospitals):
- Comprehensive service offerings.
- High patient volume.
- Established infrastructure and expertise.
Mammography Industry in South Korea Product Landscape
The South Korean mammography market offers a diverse range of products, from basic analog systems to sophisticated digital systems and tomosynthesis units. Innovations focus on improved image quality, reduced radiation exposure, and faster examination times. Digital systems are increasingly incorporating AI-powered image analysis tools to assist radiologists in detecting abnormalities. Tomosynthesis systems offer 3D imaging capabilities, enhancing diagnostic accuracy and reducing the need for additional imaging. These advancements are creating unique selling propositions focused on efficiency, accuracy and patient comfort.
Key Drivers, Barriers & Challenges in Mammography Industry in South Korea
Key Drivers: Rising breast cancer incidence, government initiatives for early detection programs, and technological advancements (AI, tomosynthesis) are driving market growth. Increasing healthcare expenditure and an aging population further contribute to market expansion.
Key Challenges: High initial investment costs for advanced systems can be a barrier for smaller clinics. Stringent regulatory approvals for new technologies can delay market entry. Competition from alternative imaging modalities and the need for skilled radiologists to interpret images pose challenges to market expansion. Supply chain disruptions caused by global events could impact availability and pricing.
Emerging Opportunities in Mammography Industry in South Korea
Untapped opportunities exist in expanding mammography services to rural areas through mobile clinics or tele-radiology solutions. The integration of AI for automated image analysis can enhance efficiency and diagnostic accuracy, opening new avenues for growth. Growing consumer preference for personalized healthcare and remote patient monitoring could drive demand for innovative solutions.
Growth Accelerators in the Mammography Industry in South Korea Industry
Technological breakthroughs in AI-powered image analysis and advanced tomosynthesis systems will propel market growth. Strategic partnerships between technology providers and healthcare institutions will drive innovation and market penetration. Government initiatives promoting early breast cancer detection and improved healthcare infrastructure will further accelerate market expansion.
Key Players Shaping the Mammography Industry in South Korea Market
- Lunit Inc
- Genoray Co Ltd
- Siemens Healthineers
- Hologic Inc
- GE Healthcare
- Koninklijke Philips NV
- Bemems Co Ltd
- Canon Medical Systems Corporation
- Neusoft Medical Co Ltd
- Planmed Oy
- Carestream Health Inc
- Fujifilm Holdings Corporation
Notable Milestones in Mammography Industry in South Korea Sector
- July 2021: Lunit Inc. secured USD 26 million in Series C funding, boosting AI development in mammography.
- April 2021: Genoray Co Ltd. received MFDS certification for its HESTIA breast cancer diagnosis system, marking a significant step for domestic technology.
In-Depth Mammography Industry in South Korea Market Outlook
The South Korean mammography market is poised for sustained growth driven by technological advancements, increasing awareness of breast cancer, and supportive government policies. Strategic opportunities exist for companies focusing on AI integration, advanced tomosynthesis systems, and expanding access to mammography services in underserved areas. The market's future potential is considerable, with significant growth expected in both the digital and tomosynthesis segments.
Mammography Industry in South Korea Segmentation
-
1. Product Type
- 1.1. Digital Systems
- 1.2. Analog Systems
- 1.3. Breast Tomosynthesis
- 1.4. Other Product Types
-
2. End User
- 2.1. Hospitals
- 2.2. Specialty Clinics
- 2.3. Diagnostic Centers
Mammography Industry in South Korea Segmentation By Geography
-
1. North America
- 1.1. United States
- 1.2. Canada
- 1.3. Mexico
-
2. South America
- 2.1. Brazil
- 2.2. Argentina
- 2.3. Rest of South America
-
3. Europe
- 3.1. United Kingdom
- 3.2. Germany
- 3.3. France
- 3.4. Italy
- 3.5. Spain
- 3.6. Russia
- 3.7. Benelux
- 3.8. Nordics
- 3.9. Rest of Europe
-
4. Middle East & Africa
- 4.1. Turkey
- 4.2. Israel
- 4.3. GCC
- 4.4. North Africa
- 4.5. South Africa
- 4.6. Rest of Middle East & Africa
-
5. Asia Pacific
- 5.1. China
- 5.2. India
- 5.3. Japan
- 5.4. South Korea
- 5.5. ASEAN
- 5.6. Oceania
- 5.7. Rest of Asia Pacific
Mammography Industry in South Korea REPORT HIGHLIGHTS
| Aspects | Details |
|---|---|
| Study Period | 2019-2033 |
| Base Year | 2024 |
| Estimated Year | 2025 |
| Forecast Period | 2025-2033 |
| Historical Period | 2019-2024 |
| Growth Rate | CAGR of 9.39% from 2019-2033 |
| Segmentation |
|
Table of Contents
- 1. Introduction
- 1.1. Research Scope
- 1.2. Market Segmentation
- 1.3. Research Methodology
- 1.4. Definitions and Assumptions
- 2. Executive Summary
- 2.1. Introduction
- 3. Market Dynamics
- 3.1. Introduction
- 3.2. Market Drivers
- 3.2.1. Growing Burden of Breast Cancer; Technological Advancements in the Field of Breast Imaging
- 3.3. Market Restrains
- 3.3.1. Risk of Adverse Effects from Radiation Exposure
- 3.4. Market Trends
- 3.4.1. Breast Tomosynthesis is Expected to Witness Healthy Growth Over the Forecast Period
- 4. Market Factor Analysis
- 4.1. Porters Five Forces
- 4.2. Supply/Value Chain
- 4.3. PESTEL analysis
- 4.4. Market Entropy
- 4.5. Patent/Trademark Analysis
- 5. Global Mammography Industry in South Korea Analysis, Insights and Forecast, 2019-2031
- 5.1. Market Analysis, Insights and Forecast - by Product Type
- 5.1.1. Digital Systems
- 5.1.2. Analog Systems
- 5.1.3. Breast Tomosynthesis
- 5.1.4. Other Product Types
- 5.2. Market Analysis, Insights and Forecast - by End User
- 5.2.1. Hospitals
- 5.2.2. Specialty Clinics
- 5.2.3. Diagnostic Centers
- 5.3. Market Analysis, Insights and Forecast - by Region
- 5.3.1. North America
- 5.3.2. South America
- 5.3.3. Europe
- 5.3.4. Middle East & Africa
- 5.3.5. Asia Pacific
- 5.1. Market Analysis, Insights and Forecast - by Product Type
- 6. North America Mammography Industry in South Korea Analysis, Insights and Forecast, 2019-2031
- 6.1. Market Analysis, Insights and Forecast - by Product Type
- 6.1.1. Digital Systems
- 6.1.2. Analog Systems
- 6.1.3. Breast Tomosynthesis
- 6.1.4. Other Product Types
- 6.2. Market Analysis, Insights and Forecast - by End User
- 6.2.1. Hospitals
- 6.2.2. Specialty Clinics
- 6.2.3. Diagnostic Centers
- 6.1. Market Analysis, Insights and Forecast - by Product Type
- 7. South America Mammography Industry in South Korea Analysis, Insights and Forecast, 2019-2031
- 7.1. Market Analysis, Insights and Forecast - by Product Type
- 7.1.1. Digital Systems
- 7.1.2. Analog Systems
- 7.1.3. Breast Tomosynthesis
- 7.1.4. Other Product Types
- 7.2. Market Analysis, Insights and Forecast - by End User
- 7.2.1. Hospitals
- 7.2.2. Specialty Clinics
- 7.2.3. Diagnostic Centers
- 7.1. Market Analysis, Insights and Forecast - by Product Type
- 8. Europe Mammography Industry in South Korea Analysis, Insights and Forecast, 2019-2031
- 8.1. Market Analysis, Insights and Forecast - by Product Type
- 8.1.1. Digital Systems
- 8.1.2. Analog Systems
- 8.1.3. Breast Tomosynthesis
- 8.1.4. Other Product Types
- 8.2. Market Analysis, Insights and Forecast - by End User
- 8.2.1. Hospitals
- 8.2.2. Specialty Clinics
- 8.2.3. Diagnostic Centers
- 8.1. Market Analysis, Insights and Forecast - by Product Type
- 9. Middle East & Africa Mammography Industry in South Korea Analysis, Insights and Forecast, 2019-2031
- 9.1. Market Analysis, Insights and Forecast - by Product Type
- 9.1.1. Digital Systems
- 9.1.2. Analog Systems
- 9.1.3. Breast Tomosynthesis
- 9.1.4. Other Product Types
- 9.2. Market Analysis, Insights and Forecast - by End User
- 9.2.1. Hospitals
- 9.2.2. Specialty Clinics
- 9.2.3. Diagnostic Centers
- 9.1. Market Analysis, Insights and Forecast - by Product Type
- 10. Asia Pacific Mammography Industry in South Korea Analysis, Insights and Forecast, 2019-2031
- 10.1. Market Analysis, Insights and Forecast - by Product Type
- 10.1.1. Digital Systems
- 10.1.2. Analog Systems
- 10.1.3. Breast Tomosynthesis
- 10.1.4. Other Product Types
- 10.2. Market Analysis, Insights and Forecast - by End User
- 10.2.1. Hospitals
- 10.2.2. Specialty Clinics
- 10.2.3. Diagnostic Centers
- 10.1. Market Analysis, Insights and Forecast - by Product Type
- 11. Competitive Analysis
- 11.1. Global Market Share Analysis 2024
- 11.2. Company Profiles
- 11.2.1 Lunit Inc
- 11.2.1.1. Overview
- 11.2.1.2. Products
- 11.2.1.3. SWOT Analysis
- 11.2.1.4. Recent Developments
- 11.2.1.5. Financials (Based on Availability)
- 11.2.2 Genoray Co Ltd
- 11.2.2.1. Overview
- 11.2.2.2. Products
- 11.2.2.3. SWOT Analysis
- 11.2.2.4. Recent Developments
- 11.2.2.5. Financials (Based on Availability)
- 11.2.3 Siemens Healthineers
- 11.2.3.1. Overview
- 11.2.3.2. Products
- 11.2.3.3. SWOT Analysis
- 11.2.3.4. Recent Developments
- 11.2.3.5. Financials (Based on Availability)
- 11.2.4 Hologic Inc
- 11.2.4.1. Overview
- 11.2.4.2. Products
- 11.2.4.3. SWOT Analysis
- 11.2.4.4. Recent Developments
- 11.2.4.5. Financials (Based on Availability)
- 11.2.5 GE Healthcare
- 11.2.5.1. Overview
- 11.2.5.2. Products
- 11.2.5.3. SWOT Analysis
- 11.2.5.4. Recent Developments
- 11.2.5.5. Financials (Based on Availability)
- 11.2.6 Koninklijke Philips NV
- 11.2.6.1. Overview
- 11.2.6.2. Products
- 11.2.6.3. SWOT Analysis
- 11.2.6.4. Recent Developments
- 11.2.6.5. Financials (Based on Availability)
- 11.2.7 Bemems Co Ltd
- 11.2.7.1. Overview
- 11.2.7.2. Products
- 11.2.7.3. SWOT Analysis
- 11.2.7.4. Recent Developments
- 11.2.7.5. Financials (Based on Availability)
- 11.2.8 Canon Medical Systems Corporation
- 11.2.8.1. Overview
- 11.2.8.2. Products
- 11.2.8.3. SWOT Analysis
- 11.2.8.4. Recent Developments
- 11.2.8.5. Financials (Based on Availability)
- 11.2.9 Neusoft Medical Co Ltd
- 11.2.9.1. Overview
- 11.2.9.2. Products
- 11.2.9.3. SWOT Analysis
- 11.2.9.4. Recent Developments
- 11.2.9.5. Financials (Based on Availability)
- 11.2.10 Planmed Oy
- 11.2.10.1. Overview
- 11.2.10.2. Products
- 11.2.10.3. SWOT Analysis
- 11.2.10.4. Recent Developments
- 11.2.10.5. Financials (Based on Availability)
- 11.2.11 Carestream Health Inc
- 11.2.11.1. Overview
- 11.2.11.2. Products
- 11.2.11.3. SWOT Analysis
- 11.2.11.4. Recent Developments
- 11.2.11.5. Financials (Based on Availability)
- 11.2.12 Fujifilm Holdings Corporation
- 11.2.12.1. Overview
- 11.2.12.2. Products
- 11.2.12.3. SWOT Analysis
- 11.2.12.4. Recent Developments
- 11.2.12.5. Financials (Based on Availability)
- 11.2.1 Lunit Inc
List of Figures
- Figure 1: Global Mammography Industry in South Korea Revenue Breakdown (Million, %) by Region 2024 & 2032
- Figure 2: Global Mammography Industry in South Korea Volume Breakdown (Piece, %) by Region 2024 & 2032
- Figure 3: South Korea Mammography Industry in South Korea Revenue (Million), by Country 2024 & 2032
- Figure 4: South Korea Mammography Industry in South Korea Volume (Piece), by Country 2024 & 2032
- Figure 5: South Korea Mammography Industry in South Korea Revenue Share (%), by Country 2024 & 2032
- Figure 6: South Korea Mammography Industry in South Korea Volume Share (%), by Country 2024 & 2032
- Figure 7: North America Mammography Industry in South Korea Revenue (Million), by Product Type 2024 & 2032
- Figure 8: North America Mammography Industry in South Korea Volume (Piece), by Product Type 2024 & 2032
- Figure 9: North America Mammography Industry in South Korea Revenue Share (%), by Product Type 2024 & 2032
- Figure 10: North America Mammography Industry in South Korea Volume Share (%), by Product Type 2024 & 2032
- Figure 11: North America Mammography Industry in South Korea Revenue (Million), by End User 2024 & 2032
- Figure 12: North America Mammography Industry in South Korea Volume (Piece), by End User 2024 & 2032
- Figure 13: North America Mammography Industry in South Korea Revenue Share (%), by End User 2024 & 2032
- Figure 14: North America Mammography Industry in South Korea Volume Share (%), by End User 2024 & 2032
- Figure 15: North America Mammography Industry in South Korea Revenue (Million), by Country 2024 & 2032
- Figure 16: North America Mammography Industry in South Korea Volume (Piece), by Country 2024 & 2032
- Figure 17: North America Mammography Industry in South Korea Revenue Share (%), by Country 2024 & 2032
- Figure 18: North America Mammography Industry in South Korea Volume Share (%), by Country 2024 & 2032
- Figure 19: South America Mammography Industry in South Korea Revenue (Million), by Product Type 2024 & 2032
- Figure 20: South America Mammography Industry in South Korea Volume (Piece), by Product Type 2024 & 2032
- Figure 21: South America Mammography Industry in South Korea Revenue Share (%), by Product Type 2024 & 2032
- Figure 22: South America Mammography Industry in South Korea Volume Share (%), by Product Type 2024 & 2032
- Figure 23: South America Mammography Industry in South Korea Revenue (Million), by End User 2024 & 2032
- Figure 24: South America Mammography Industry in South Korea Volume (Piece), by End User 2024 & 2032
- Figure 25: South America Mammography Industry in South Korea Revenue Share (%), by End User 2024 & 2032
- Figure 26: South America Mammography Industry in South Korea Volume Share (%), by End User 2024 & 2032
- Figure 27: South America Mammography Industry in South Korea Revenue (Million), by Country 2024 & 2032
- Figure 28: South America Mammography Industry in South Korea Volume (Piece), by Country 2024 & 2032
- Figure 29: South America Mammography Industry in South Korea Revenue Share (%), by Country 2024 & 2032
- Figure 30: South America Mammography Industry in South Korea Volume Share (%), by Country 2024 & 2032
- Figure 31: Europe Mammography Industry in South Korea Revenue (Million), by Product Type 2024 & 2032
- Figure 32: Europe Mammography Industry in South Korea Volume (Piece), by Product Type 2024 & 2032
- Figure 33: Europe Mammography Industry in South Korea Revenue Share (%), by Product Type 2024 & 2032
- Figure 34: Europe Mammography Industry in South Korea Volume Share (%), by Product Type 2024 & 2032
- Figure 35: Europe Mammography Industry in South Korea Revenue (Million), by End User 2024 & 2032
- Figure 36: Europe Mammography Industry in South Korea Volume (Piece), by End User 2024 & 2032
- Figure 37: Europe Mammography Industry in South Korea Revenue Share (%), by End User 2024 & 2032
- Figure 38: Europe Mammography Industry in South Korea Volume Share (%), by End User 2024 & 2032
- Figure 39: Europe Mammography Industry in South Korea Revenue (Million), by Country 2024 & 2032
- Figure 40: Europe Mammography Industry in South Korea Volume (Piece), by Country 2024 & 2032
- Figure 41: Europe Mammography Industry in South Korea Revenue Share (%), by Country 2024 & 2032
- Figure 42: Europe Mammography Industry in South Korea Volume Share (%), by Country 2024 & 2032
- Figure 43: Middle East & Africa Mammography Industry in South Korea Revenue (Million), by Product Type 2024 & 2032
- Figure 44: Middle East & Africa Mammography Industry in South Korea Volume (Piece), by Product Type 2024 & 2032
- Figure 45: Middle East & Africa Mammography Industry in South Korea Revenue Share (%), by Product Type 2024 & 2032
- Figure 46: Middle East & Africa Mammography Industry in South Korea Volume Share (%), by Product Type 2024 & 2032
- Figure 47: Middle East & Africa Mammography Industry in South Korea Revenue (Million), by End User 2024 & 2032
- Figure 48: Middle East & Africa Mammography Industry in South Korea Volume (Piece), by End User 2024 & 2032
- Figure 49: Middle East & Africa Mammography Industry in South Korea Revenue Share (%), by End User 2024 & 2032
- Figure 50: Middle East & Africa Mammography Industry in South Korea Volume Share (%), by End User 2024 & 2032
- Figure 51: Middle East & Africa Mammography Industry in South Korea Revenue (Million), by Country 2024 & 2032
- Figure 52: Middle East & Africa Mammography Industry in South Korea Volume (Piece), by Country 2024 & 2032
- Figure 53: Middle East & Africa Mammography Industry in South Korea Revenue Share (%), by Country 2024 & 2032
- Figure 54: Middle East & Africa Mammography Industry in South Korea Volume Share (%), by Country 2024 & 2032
- Figure 55: Asia Pacific Mammography Industry in South Korea Revenue (Million), by Product Type 2024 & 2032
- Figure 56: Asia Pacific Mammography Industry in South Korea Volume (Piece), by Product Type 2024 & 2032
- Figure 57: Asia Pacific Mammography Industry in South Korea Revenue Share (%), by Product Type 2024 & 2032
- Figure 58: Asia Pacific Mammography Industry in South Korea Volume Share (%), by Product Type 2024 & 2032
- Figure 59: Asia Pacific Mammography Industry in South Korea Revenue (Million), by End User 2024 & 2032
- Figure 60: Asia Pacific Mammography Industry in South Korea Volume (Piece), by End User 2024 & 2032
- Figure 61: Asia Pacific Mammography Industry in South Korea Revenue Share (%), by End User 2024 & 2032
- Figure 62: Asia Pacific Mammography Industry in South Korea Volume Share (%), by End User 2024 & 2032
- Figure 63: Asia Pacific Mammography Industry in South Korea Revenue (Million), by Country 2024 & 2032
- Figure 64: Asia Pacific Mammography Industry in South Korea Volume (Piece), by Country 2024 & 2032
- Figure 65: Asia Pacific Mammography Industry in South Korea Revenue Share (%), by Country 2024 & 2032
- Figure 66: Asia Pacific Mammography Industry in South Korea Volume Share (%), by Country 2024 & 2032
List of Tables
- Table 1: Global Mammography Industry in South Korea Revenue Million Forecast, by Region 2019 & 2032
- Table 2: Global Mammography Industry in South Korea Volume Piece Forecast, by Region 2019 & 2032
- Table 3: Global Mammography Industry in South Korea Revenue Million Forecast, by Product Type 2019 & 2032
- Table 4: Global Mammography Industry in South Korea Volume Piece Forecast, by Product Type 2019 & 2032
- Table 5: Global Mammography Industry in South Korea Revenue Million Forecast, by End User 2019 & 2032
- Table 6: Global Mammography Industry in South Korea Volume Piece Forecast, by End User 2019 & 2032
- Table 7: Global Mammography Industry in South Korea Revenue Million Forecast, by Region 2019 & 2032
- Table 8: Global Mammography Industry in South Korea Volume Piece Forecast, by Region 2019 & 2032
- Table 9: Global Mammography Industry in South Korea Revenue Million Forecast, by Country 2019 & 2032
- Table 10: Global Mammography Industry in South Korea Volume Piece Forecast, by Country 2019 & 2032
- Table 11: Global Mammography Industry in South Korea Revenue Million Forecast, by Product Type 2019 & 2032
- Table 12: Global Mammography Industry in South Korea Volume Piece Forecast, by Product Type 2019 & 2032
- Table 13: Global Mammography Industry in South Korea Revenue Million Forecast, by End User 2019 & 2032
- Table 14: Global Mammography Industry in South Korea Volume Piece Forecast, by End User 2019 & 2032
- Table 15: Global Mammography Industry in South Korea Revenue Million Forecast, by Country 2019 & 2032
- Table 16: Global Mammography Industry in South Korea Volume Piece Forecast, by Country 2019 & 2032
- Table 17: United States Mammography Industry in South Korea Revenue (Million) Forecast, by Application 2019 & 2032
- Table 18: United States Mammography Industry in South Korea Volume (Piece) Forecast, by Application 2019 & 2032
- Table 19: Canada Mammography Industry in South Korea Revenue (Million) Forecast, by Application 2019 & 2032
- Table 20: Canada Mammography Industry in South Korea Volume (Piece) Forecast, by Application 2019 & 2032
- Table 21: Mexico Mammography Industry in South Korea Revenue (Million) Forecast, by Application 2019 & 2032
- Table 22: Mexico Mammography Industry in South Korea Volume (Piece) Forecast, by Application 2019 & 2032
- Table 23: Global Mammography Industry in South Korea Revenue Million Forecast, by Product Type 2019 & 2032
- Table 24: Global Mammography Industry in South Korea Volume Piece Forecast, by Product Type 2019 & 2032
- Table 25: Global Mammography Industry in South Korea Revenue Million Forecast, by End User 2019 & 2032
- Table 26: Global Mammography Industry in South Korea Volume Piece Forecast, by End User 2019 & 2032
- Table 27: Global Mammography Industry in South Korea Revenue Million Forecast, by Country 2019 & 2032
- Table 28: Global Mammography Industry in South Korea Volume Piece Forecast, by Country 2019 & 2032
- Table 29: Brazil Mammography Industry in South Korea Revenue (Million) Forecast, by Application 2019 & 2032
- Table 30: Brazil Mammography Industry in South Korea Volume (Piece) Forecast, by Application 2019 & 2032
- Table 31: Argentina Mammography Industry in South Korea Revenue (Million) Forecast, by Application 2019 & 2032
- Table 32: Argentina Mammography Industry in South Korea Volume (Piece) Forecast, by Application 2019 & 2032
- Table 33: Rest of South America Mammography Industry in South Korea Revenue (Million) Forecast, by Application 2019 & 2032
- Table 34: Rest of South America Mammography Industry in South Korea Volume (Piece) Forecast, by Application 2019 & 2032
- Table 35: Global Mammography Industry in South Korea Revenue Million Forecast, by Product Type 2019 & 2032
- Table 36: Global Mammography Industry in South Korea Volume Piece Forecast, by Product Type 2019 & 2032
- Table 37: Global Mammography Industry in South Korea Revenue Million Forecast, by End User 2019 & 2032
- Table 38: Global Mammography Industry in South Korea Volume Piece Forecast, by End User 2019 & 2032
- Table 39: Global Mammography Industry in South Korea Revenue Million Forecast, by Country 2019 & 2032
- Table 40: Global Mammography Industry in South Korea Volume Piece Forecast, by Country 2019 & 2032
- Table 41: United Kingdom Mammography Industry in South Korea Revenue (Million) Forecast, by Application 2019 & 2032
- Table 42: United Kingdom Mammography Industry in South Korea Volume (Piece) Forecast, by Application 2019 & 2032
- Table 43: Germany Mammography Industry in South Korea Revenue (Million) Forecast, by Application 2019 & 2032
- Table 44: Germany Mammography Industry in South Korea Volume (Piece) Forecast, by Application 2019 & 2032
- Table 45: France Mammography Industry in South Korea Revenue (Million) Forecast, by Application 2019 & 2032
- Table 46: France Mammography Industry in South Korea Volume (Piece) Forecast, by Application 2019 & 2032
- Table 47: Italy Mammography Industry in South Korea Revenue (Million) Forecast, by Application 2019 & 2032
- Table 48: Italy Mammography Industry in South Korea Volume (Piece) Forecast, by Application 2019 & 2032
- Table 49: Spain Mammography Industry in South Korea Revenue (Million) Forecast, by Application 2019 & 2032
- Table 50: Spain Mammography Industry in South Korea Volume (Piece) Forecast, by Application 2019 & 2032
- Table 51: Russia Mammography Industry in South Korea Revenue (Million) Forecast, by Application 2019 & 2032
- Table 52: Russia Mammography Industry in South Korea Volume (Piece) Forecast, by Application 2019 & 2032
- Table 53: Benelux Mammography Industry in South Korea Revenue (Million) Forecast, by Application 2019 & 2032
- Table 54: Benelux Mammography Industry in South Korea Volume (Piece) Forecast, by Application 2019 & 2032
- Table 55: Nordics Mammography Industry in South Korea Revenue (Million) Forecast, by Application 2019 & 2032
- Table 56: Nordics Mammography Industry in South Korea Volume (Piece) Forecast, by Application 2019 & 2032
- Table 57: Rest of Europe Mammography Industry in South Korea Revenue (Million) Forecast, by Application 2019 & 2032
- Table 58: Rest of Europe Mammography Industry in South Korea Volume (Piece) Forecast, by Application 2019 & 2032
- Table 59: Global Mammography Industry in South Korea Revenue Million Forecast, by Product Type 2019 & 2032
- Table 60: Global Mammography Industry in South Korea Volume Piece Forecast, by Product Type 2019 & 2032
- Table 61: Global Mammography Industry in South Korea Revenue Million Forecast, by End User 2019 & 2032
- Table 62: Global Mammography Industry in South Korea Volume Piece Forecast, by End User 2019 & 2032
- Table 63: Global Mammography Industry in South Korea Revenue Million Forecast, by Country 2019 & 2032
- Table 64: Global Mammography Industry in South Korea Volume Piece Forecast, by Country 2019 & 2032
- Table 65: Turkey Mammography Industry in South Korea Revenue (Million) Forecast, by Application 2019 & 2032
- Table 66: Turkey Mammography Industry in South Korea Volume (Piece) Forecast, by Application 2019 & 2032
- Table 67: Israel Mammography Industry in South Korea Revenue (Million) Forecast, by Application 2019 & 2032
- Table 68: Israel Mammography Industry in South Korea Volume (Piece) Forecast, by Application 2019 & 2032
- Table 69: GCC Mammography Industry in South Korea Revenue (Million) Forecast, by Application 2019 & 2032
- Table 70: GCC Mammography Industry in South Korea Volume (Piece) Forecast, by Application 2019 & 2032
- Table 71: North Africa Mammography Industry in South Korea Revenue (Million) Forecast, by Application 2019 & 2032
- Table 72: North Africa Mammography Industry in South Korea Volume (Piece) Forecast, by Application 2019 & 2032
- Table 73: South Africa Mammography Industry in South Korea Revenue (Million) Forecast, by Application 2019 & 2032
- Table 74: South Africa Mammography Industry in South Korea Volume (Piece) Forecast, by Application 2019 & 2032
- Table 75: Rest of Middle East & Africa Mammography Industry in South Korea Revenue (Million) Forecast, by Application 2019 & 2032
- Table 76: Rest of Middle East & Africa Mammography Industry in South Korea Volume (Piece) Forecast, by Application 2019 & 2032
- Table 77: Global Mammography Industry in South Korea Revenue Million Forecast, by Product Type 2019 & 2032
- Table 78: Global Mammography Industry in South Korea Volume Piece Forecast, by Product Type 2019 & 2032
- Table 79: Global Mammography Industry in South Korea Revenue Million Forecast, by End User 2019 & 2032
- Table 80: Global Mammography Industry in South Korea Volume Piece Forecast, by End User 2019 & 2032
- Table 81: Global Mammography Industry in South Korea Revenue Million Forecast, by Country 2019 & 2032
- Table 82: Global Mammography Industry in South Korea Volume Piece Forecast, by Country 2019 & 2032
- Table 83: China Mammography Industry in South Korea Revenue (Million) Forecast, by Application 2019 & 2032
- Table 84: China Mammography Industry in South Korea Volume (Piece) Forecast, by Application 2019 & 2032
- Table 85: India Mammography Industry in South Korea Revenue (Million) Forecast, by Application 2019 & 2032
- Table 86: India Mammography Industry in South Korea Volume (Piece) Forecast, by Application 2019 & 2032
- Table 87: Japan Mammography Industry in South Korea Revenue (Million) Forecast, by Application 2019 & 2032
- Table 88: Japan Mammography Industry in South Korea Volume (Piece) Forecast, by Application 2019 & 2032
- Table 89: South Korea Mammography Industry in South Korea Revenue (Million) Forecast, by Application 2019 & 2032
- Table 90: South Korea Mammography Industry in South Korea Volume (Piece) Forecast, by Application 2019 & 2032
- Table 91: ASEAN Mammography Industry in South Korea Revenue (Million) Forecast, by Application 2019 & 2032
- Table 92: ASEAN Mammography Industry in South Korea Volume (Piece) Forecast, by Application 2019 & 2032
- Table 93: Oceania Mammography Industry in South Korea Revenue (Million) Forecast, by Application 2019 & 2032
- Table 94: Oceania Mammography Industry in South Korea Volume (Piece) Forecast, by Application 2019 & 2032
- Table 95: Rest of Asia Pacific Mammography Industry in South Korea Revenue (Million) Forecast, by Application 2019 & 2032
- Table 96: Rest of Asia Pacific Mammography Industry in South Korea Volume (Piece) Forecast, by Application 2019 & 2032
Frequently Asked Questions
1. What is the projected Compound Annual Growth Rate (CAGR) of the Mammography Industry in South Korea?
The projected CAGR is approximately 9.39%.
2. Which companies are prominent players in the Mammography Industry in South Korea?
Key companies in the market include Lunit Inc , Genoray Co Ltd, Siemens Healthineers, Hologic Inc, GE Healthcare, Koninklijke Philips NV, Bemems Co Ltd, Canon Medical Systems Corporation, Neusoft Medical Co Ltd, Planmed Oy, Carestream Health Inc, Fujifilm Holdings Corporation.
3. What are the main segments of the Mammography Industry in South Korea?
The market segments include Product Type, End User.
4. Can you provide details about the market size?
The market size is estimated to be USD 72.80 Million as of 2022.
5. What are some drivers contributing to market growth?
Growing Burden of Breast Cancer; Technological Advancements in the Field of Breast Imaging.
6. What are the notable trends driving market growth?
Breast Tomosynthesis is Expected to Witness Healthy Growth Over the Forecast Period.
7. Are there any restraints impacting market growth?
Risk of Adverse Effects from Radiation Exposure.
8. Can you provide examples of recent developments in the market?
In July 2021, Artificial Intelligence startup Lunit from south Korea bagged USD 26 million in a series c tranche b funding round. The investment came from guardant health, a precision oncology firm.
9. What pricing options are available for accessing the report?
Pricing options include single-user, multi-user, and enterprise licenses priced at USD 3800, USD 4500, and USD 5800 respectively.
10. Is the market size provided in terms of value or volume?
The market size is provided in terms of value, measured in Million and volume, measured in Piece.
11. Are there any specific market keywords associated with the report?
Yes, the market keyword associated with the report is "Mammography Industry in South Korea," which aids in identifying and referencing the specific market segment covered.
12. How do I determine which pricing option suits my needs best?
The pricing options vary based on user requirements and access needs. Individual users may opt for single-user licenses, while businesses requiring broader access may choose multi-user or enterprise licenses for cost-effective access to the report.
13. Are there any additional resources or data provided in the Mammography Industry in South Korea report?
While the report offers comprehensive insights, it's advisable to review the specific contents or supplementary materials provided to ascertain if additional resources or data are available.
14. How can I stay updated on further developments or reports in the Mammography Industry in South Korea?
To stay informed about further developments, trends, and reports in the Mammography Industry in South Korea, consider subscribing to industry newsletters, following relevant companies and organizations, or regularly checking reputable industry news sources and publications.
Methodology
Step 1 - Identification of Relevant Samples Size from Population Database


Step 2 - Approaches for Defining Global Market Size (Value, Volume* & Price*)

Note*: In applicable scenarios
Step 3 - Data Sources
Primary Research
- Web Analytics
- Survey Reports
- Research Institute
- Latest Research Reports
- Opinion Leaders
Secondary Research
- Annual Reports
- White Paper
- Latest Press Release
- Industry Association
- Paid Database
- Investor Presentations

Step 4 - Data Triangulation
Involves using different sources of information in order to increase the validity of a study
These sources are likely to be stakeholders in a program - participants, other researchers, program staff, other community members, and so on.
Then we put all data in single framework & apply various statistical tools to find out the dynamic on the market.
During the analysis stage, feedback from the stakeholder groups would be compared to determine areas of agreement as well as areas of divergence


