
Key Insights
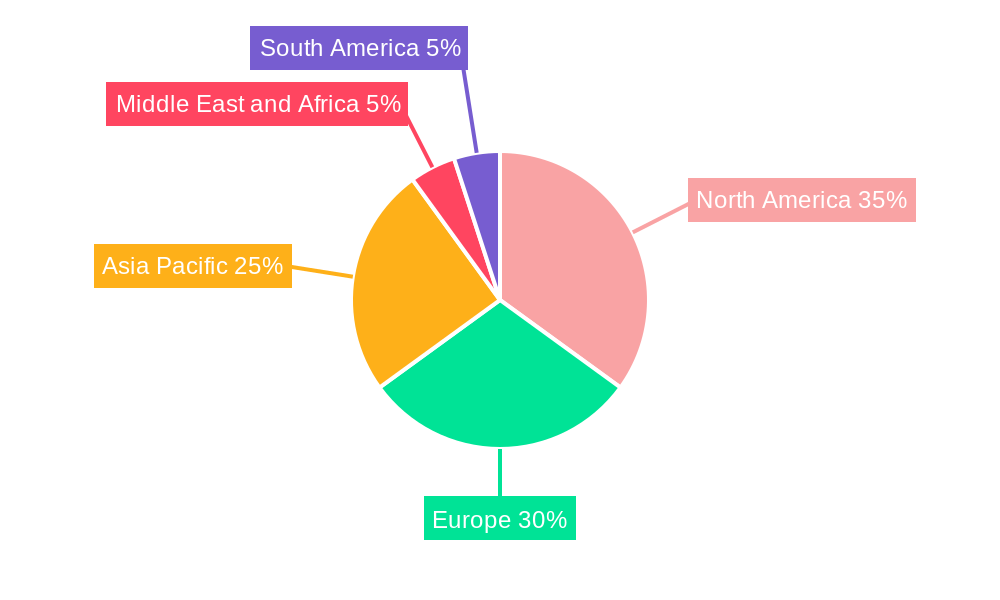
The global ligament stabilizer market, encompassing foot and ankle, knee, shoulder, spinal, and wrist/hand braces and supports, is experiencing robust growth, projected at a Compound Annual Growth Rate (CAGR) of 6.50% from 2025 to 2033. This expansion is fueled by several key factors. The rising prevalence of sports injuries, particularly among young adults and athletes, is a major driver, increasing demand for effective ligament support and rehabilitation solutions. An aging global population, susceptible to age-related joint deterioration and ligament instability, further contributes to market growth. Technological advancements in brace design, incorporating lighter, more comfortable, and better-performing materials, are also enhancing market appeal. Furthermore, increasing awareness of preventative care and the benefits of early intervention in ligament injuries are positively impacting market demand. The market is segmented geographically, with North America and Europe currently holding significant market share due to higher healthcare expenditure and advanced medical infrastructure. However, rapidly developing economies in Asia-Pacific are poised for substantial growth, driven by increasing disposable incomes and rising healthcare awareness.
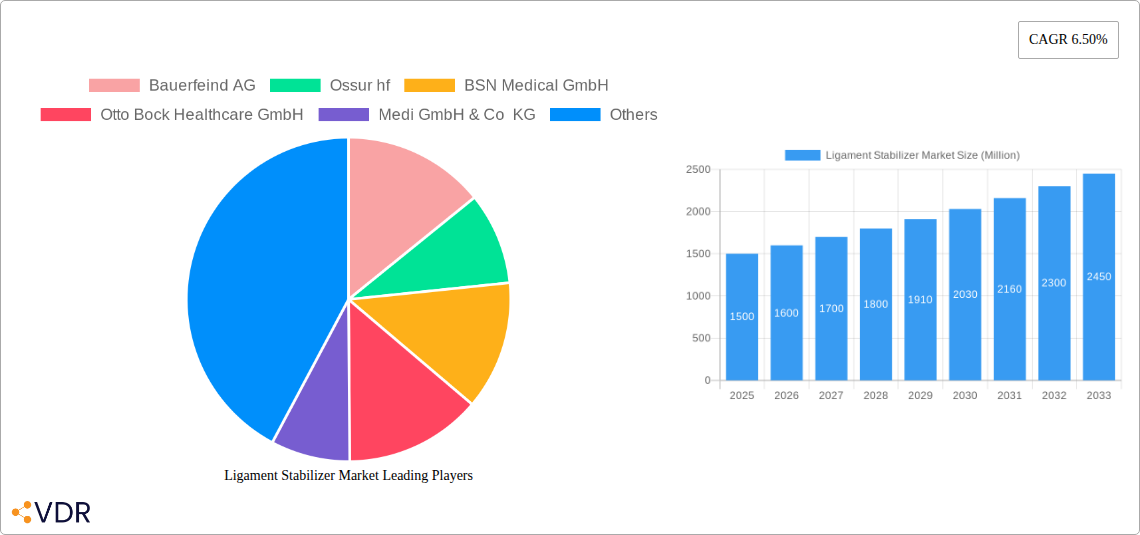
Competitive forces within the ligament stabilizer market are intense, with established players like Bauerfeind AG, Ossur hf, and Otto Bock Healthcare GmbH vying for market dominance against smaller, more specialized companies. While the market benefits from continuous innovation in materials and design, factors like high costs associated with advanced braces and limited healthcare access in certain regions present challenges. Nevertheless, the overall market outlook remains positive, driven by the long-term trends of an aging population, rising sports participation, and advancements in medical technology. The increasing focus on personalized medicine and tailored brace solutions will likely further shape the market landscape in the coming years. This market's trajectory suggests opportunities for both established players to consolidate their market share and for innovative entrants to leverage new technologies and differentiated offerings.
Ligament Stabilizer Market: A Comprehensive Report (2019-2033)
This in-depth report provides a comprehensive analysis of the global Ligament Stabilizer Market, encompassing market dynamics, growth trends, regional dominance, product landscape, key players, and future outlook. The report covers the period from 2019 to 2033, with 2025 serving as the base and estimated year. The detailed analysis focuses on the parent market of Orthopedic Devices and the child market of Ligament Stabilizers, offering granular insights for industry professionals and strategic decision-makers. The market size is presented in Million units.
Ligament Stabilizer Market Dynamics & Structure
The global ligament stabilizer market exhibits a moderately consolidated structure, with a few major players holding significant market share. Technological innovation, particularly in materials science and biomechanics, is a key driver, leading to the development of lighter, more comfortable, and effective braces and supports. Stringent regulatory frameworks governing medical device approval and safety are in place, shaping product development and market entry strategies. The market witnesses competition from both established players and emerging companies offering innovative products. End-user demographics, encompassing an aging population with increased incidence of ligament injuries and a growing sports participation rate, fuel market growth. Mergers and acquisitions (M&A) activity is relatively moderate but showcases strategic consolidation within the sector.
- Market Concentration: The top 5 players account for approximately xx% of the global market share in 2025.
- Technological Innovation: Focus on lightweight materials (e.g., carbon fiber), advanced biomechanics, and smart sensor integration.
- Regulatory Landscape: Compliance with FDA (USA) and CE (Europe) marking regulations significantly impacts market entry.
- Competitive Substitutes: Conservative treatment options (e.g., physiotherapy) and surgical interventions pose competitive pressure.
- M&A Activity: An estimated xx M&A deals occurred between 2019-2024, with a projected xx deals for 2025-2033.
- Innovation Barriers: High R&D costs and lengthy regulatory approval processes hinder innovation.
Ligament Stabilizer Market Growth Trends & Insights
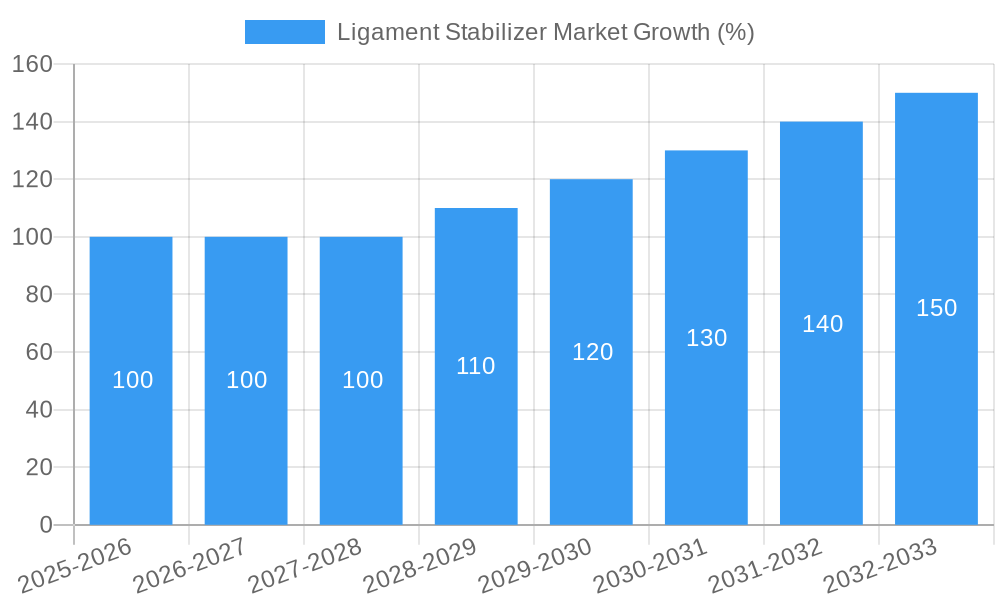
The global ligament stabilizer market is experiencing robust growth, driven by several key factors. The market size witnessed a CAGR of xx% during the historical period (2019-2024) and is projected to grow at a CAGR of xx% during the forecast period (2025-2033), reaching xx Million units by 2033. Increased awareness of ligament injuries and their long-term consequences, coupled with rising healthcare expenditure, are contributing to market expansion. Technological advancements, such as the integration of smart sensors for real-time monitoring and personalized brace design, are disrupting the market landscape, leading to higher adoption rates. Consumer behavior is shifting towards seeking non-invasive, effective treatment options, bolstering the demand for high-quality ligament stabilizers. The market penetration of advanced ligament stabilizers is expected to increase from xx% in 2025 to xx% by 2033.
Dominant Regions, Countries, or Segments in Ligament Stabilizer Market
North America currently holds the largest market share in the ligament stabilizer market, driven by high healthcare expenditure, advanced medical infrastructure, and a sizeable aging population. Europe follows closely, with strong growth potential in emerging economies within the region. Within product segments, Knee Braces and Supports constitutes the largest segment, followed by Foot and Ankle Braces and Supports and Shoulder Braces and Supports.
- North America: High per capita healthcare spending, advanced medical infrastructure, and a large aging population drive market growth.
- Europe: Increasing prevalence of sports injuries and a focus on minimally invasive treatments contribute to market expansion.
- Asia-Pacific: Rapidly growing healthcare sector and increasing disposable incomes fuel market growth, though still behind North America and Europe in terms of market maturity.
- Knee Braces and Supports: The largest segment, driven by high incidence of knee injuries and the availability of advanced products.
- Foot and Ankle Braces and Supports: Significant market share due to the prevalence of foot and ankle injuries among athletes and the general population.
Ligament Stabilizer Market Product Landscape
The ligament stabilizer market offers a wide range of products, categorized by body part (knee, ankle, shoulder, etc.), material (neoprene, elastic, thermoplastic), and features (adjustable straps, hinges, breathable fabrics). Recent innovations include lighter and more comfortable designs, improved biomechanical support, and the integration of smart sensors for performance monitoring and personalized feedback. Unique selling propositions focus on comfort, ease of use, and effectiveness in reducing injury risk and improving recovery times. Technological advancements in materials and design are continuously improving product performance and user experience.
Key Drivers, Barriers & Challenges in Ligament Stabilizer Market
Key Drivers:
- Rising prevalence of sports injuries and musculoskeletal disorders.
- Increasing healthcare expenditure and insurance coverage.
- Technological advancements in materials science and biomechanics.
- Growing awareness of the benefits of non-invasive treatment options.
Key Barriers and Challenges:
- High manufacturing costs leading to high product prices.
- Stringent regulatory approvals and compliance requirements.
- Intense competition from established players and new entrants.
- Supply chain disruptions due to geopolitical instability (xx% impact on market growth in 2024).
Emerging Opportunities in Ligament Stabilizer Market
- Untapped Markets: Expanding into emerging economies with high growth potential (e.g., Africa, South America).
- Innovative Applications: Development of smart ligament stabilizers with integrated sensors and data analytics.
- Evolving Consumer Preferences: Focus on customization, comfort, and aesthetic appeal of products.
Growth Accelerators in the Ligament Stabilizer Market Industry
Long-term growth in the ligament stabilizer market will be fueled by continuous technological innovation, strategic partnerships between manufacturers and healthcare providers, and expansion into new geographical markets. Strategic investments in R&D, coupled with a focus on patient-centric design, will drive market penetration and solidify leadership positions.
Key Players Shaping the Ligament Stabilizer Market Market
- Bauerfeind AG
- Ossur hf
- BSN Medical GmbH
- Otto Bock Healthcare GmbH
- Medi GmbH & Co KG
- Thuasne SA
- DJO Global Inc
- 3M Company
- DeRoyal Industries Incorporations
Notable Milestones in Ligament Stabilizer Market Sector
- 2021: Launch of a new smart knee brace with integrated sensors by Ossur.
- 2022: Acquisition of a smaller competitor by DJO Global, expanding their product portfolio.
- 2023: FDA approval of a novel material for ligament stabilizer construction by Bauerfeind.
- 2024: Launch of a new line of customized ankle braces by Medi.
In-Depth Ligament Stabilizer Market Market Outlook
The ligament stabilizer market is poised for continued growth, driven by several factors, including an aging population, increasing sports participation, technological advancements, and rising healthcare spending. Strategic investments in innovation, expansion into untapped markets, and strategic partnerships will be crucial for players to capitalize on the market's potential. Focus on patient-centric design and the integration of digital technologies will be key differentiators in a competitive landscape.
Ligament Stabilizer Market Segmentation
-
1. Poduct
- 1.1. Foot and Ankle Braces and Supports
- 1.2. Knee Braces and Supports
- 1.3. Shoulder Braces and Supports
- 1.4. Spinal Orthoses
- 1.5. Wrist and Hand Braces and Supports
-
2. Application
- 2.1. Sports
- 2.2. Rehabilitation
- 2.3. Orthopedic Care
- 2.4. Workplace Safety
- 2.5. Others
-
3. End User
- 3.1. Athletes
- 3.2. Individuals
- 3.3. Corporate Wellness Programs
- 3.4. Sports Facilities
- 3.5. Healthcare Professionals
Ligament Stabilizer Market Segmentation By Geography
-
1. North America
- 1.1. United States
- 1.2. Canada
- 1.3. Mexico
-
2. Europe
- 2.1. Germany
- 2.2. United Kingdom
- 2.3. France
- 2.4. Italy
- 2.5. Spain
- 2.6. Rest of Europe
-
3. Asia Pacific
- 3.1. China
- 3.2. Japan
- 3.3. India
- 3.4. Australia
- 3.5. South Korea
- 3.6. Rest of Asia Pacific
-
4. Middle East and Africa
- 4.1. GCC
- 4.2. South Africa
- 4.3. Rest of Middle East and Africa
-
5. South America
- 5.1. Brazil
- 5.2. Argentina
- 5.3. Rest of South America
Ligament Stabilizer Market REPORT HIGHLIGHTS
| Aspects | Details |
|---|---|
| Study Period | 2019-2033 |
| Base Year | 2024 |
| Estimated Year | 2025 |
| Forecast Period | 2025-2033 |
| Historical Period | 2019-2024 |
| Growth Rate | CAGR of 6.50% from 2019-2033 |
| Segmentation |
|
Table of Contents
- 1. Introduction
- 1.1. Research Scope
- 1.2. Market Segmentation
- 1.3. Research Methodology
- 1.4. Definitions and Assumptions
- 2. Executive Summary
- 2.1. Introduction
- 3. Market Dynamics
- 3.1. Introduction
- 3.2. Market Drivers
- 3.2.1 ; Increasing Incidences of Knee
- 3.2.2 Shoulder and Ankle Injuries; Technological Advancements to the Existing Products
- 3.3. Market Restrains
- 3.3.1. ; High Cost of Products; Stringent Regulatory Issues for the Approval of Products
- 3.4. Market Trends
- 3.4.1. Knee Braces and Supports Segment is Expected to Hold a Major Market Share in the Ligament Stabilizer
- 4. Market Factor Analysis
- 4.1. Porters Five Forces
- 4.2. Supply/Value Chain
- 4.3. PESTEL analysis
- 4.4. Market Entropy
- 4.5. Patent/Trademark Analysis
- 5. Global Ligament Stabilizer Market Analysis, Insights and Forecast, 2019-2031
- 5.1. Market Analysis, Insights and Forecast - by Poduct
- 5.1.1. Foot and Ankle Braces and Supports
- 5.1.2. Knee Braces and Supports
- 5.1.3. Shoulder Braces and Supports
- 5.1.4. Spinal Orthoses
- 5.1.5. Wrist and Hand Braces and Supports
- 5.2. Market Analysis, Insights and Forecast - by Application
- 5.2.1. Sports
- 5.2.2. Rehabilitation
- 5.2.3. Orthopedic Care
- 5.2.4. Workplace Safety
- 5.2.5. Others
- 5.3. Market Analysis, Insights and Forecast - by End User
- 5.3.1. Athletes
- 5.3.2. Individuals
- 5.3.3. Corporate Wellness Programs
- 5.3.4. Sports Facilities
- 5.3.5. Healthcare Professionals
- 5.4. Market Analysis, Insights and Forecast - by Region
- 5.4.1. North America
- 5.4.2. Europe
- 5.4.3. Asia Pacific
- 5.4.4. Middle East and Africa
- 5.4.5. South America
- 5.1. Market Analysis, Insights and Forecast - by Poduct
- 6. North America Ligament Stabilizer Market Analysis, Insights and Forecast, 2019-2031
- 6.1. Market Analysis, Insights and Forecast - by Poduct
- 6.1.1. Foot and Ankle Braces and Supports
- 6.1.2. Knee Braces and Supports
- 6.1.3. Shoulder Braces and Supports
- 6.1.4. Spinal Orthoses
- 6.1.5. Wrist and Hand Braces and Supports
- 6.2. Market Analysis, Insights and Forecast - by Application
- 6.2.1. Sports
- 6.2.2. Rehabilitation
- 6.2.3. Orthopedic Care
- 6.2.4. Workplace Safety
- 6.2.5. Others
- 6.3. Market Analysis, Insights and Forecast - by End User
- 6.3.1. Athletes
- 6.3.2. Individuals
- 6.3.3. Corporate Wellness Programs
- 6.3.4. Sports Facilities
- 6.3.5. Healthcare Professionals
- 6.1. Market Analysis, Insights and Forecast - by Poduct
- 7. Europe Ligament Stabilizer Market Analysis, Insights and Forecast, 2019-2031
- 7.1. Market Analysis, Insights and Forecast - by Poduct
- 7.1.1. Foot and Ankle Braces and Supports
- 7.1.2. Knee Braces and Supports
- 7.1.3. Shoulder Braces and Supports
- 7.1.4. Spinal Orthoses
- 7.1.5. Wrist and Hand Braces and Supports
- 7.2. Market Analysis, Insights and Forecast - by Application
- 7.2.1. Sports
- 7.2.2. Rehabilitation
- 7.2.3. Orthopedic Care
- 7.2.4. Workplace Safety
- 7.2.5. Others
- 7.3. Market Analysis, Insights and Forecast - by End User
- 7.3.1. Athletes
- 7.3.2. Individuals
- 7.3.3. Corporate Wellness Programs
- 7.3.4. Sports Facilities
- 7.3.5. Healthcare Professionals
- 7.1. Market Analysis, Insights and Forecast - by Poduct
- 8. Asia Pacific Ligament Stabilizer Market Analysis, Insights and Forecast, 2019-2031
- 8.1. Market Analysis, Insights and Forecast - by Poduct
- 8.1.1. Foot and Ankle Braces and Supports
- 8.1.2. Knee Braces and Supports
- 8.1.3. Shoulder Braces and Supports
- 8.1.4. Spinal Orthoses
- 8.1.5. Wrist and Hand Braces and Supports
- 8.2. Market Analysis, Insights and Forecast - by Application
- 8.2.1. Sports
- 8.2.2. Rehabilitation
- 8.2.3. Orthopedic Care
- 8.2.4. Workplace Safety
- 8.2.5. Others
- 8.3. Market Analysis, Insights and Forecast - by End User
- 8.3.1. Athletes
- 8.3.2. Individuals
- 8.3.3. Corporate Wellness Programs
- 8.3.4. Sports Facilities
- 8.3.5. Healthcare Professionals
- 8.1. Market Analysis, Insights and Forecast - by Poduct
- 9. Middle East and Africa Ligament Stabilizer Market Analysis, Insights and Forecast, 2019-2031
- 9.1. Market Analysis, Insights and Forecast - by Poduct
- 9.1.1. Foot and Ankle Braces and Supports
- 9.1.2. Knee Braces and Supports
- 9.1.3. Shoulder Braces and Supports
- 9.1.4. Spinal Orthoses
- 9.1.5. Wrist and Hand Braces and Supports
- 9.2. Market Analysis, Insights and Forecast - by Application
- 9.2.1. Sports
- 9.2.2. Rehabilitation
- 9.2.3. Orthopedic Care
- 9.2.4. Workplace Safety
- 9.2.5. Others
- 9.3. Market Analysis, Insights and Forecast - by End User
- 9.3.1. Athletes
- 9.3.2. Individuals
- 9.3.3. Corporate Wellness Programs
- 9.3.4. Sports Facilities
- 9.3.5. Healthcare Professionals
- 9.1. Market Analysis, Insights and Forecast - by Poduct
- 10. South America Ligament Stabilizer Market Analysis, Insights and Forecast, 2019-2031
- 10.1. Market Analysis, Insights and Forecast - by Poduct
- 10.1.1. Foot and Ankle Braces and Supports
- 10.1.2. Knee Braces and Supports
- 10.1.3. Shoulder Braces and Supports
- 10.1.4. Spinal Orthoses
- 10.1.5. Wrist and Hand Braces and Supports
- 10.2. Market Analysis, Insights and Forecast - by Application
- 10.2.1. Sports
- 10.2.2. Rehabilitation
- 10.2.3. Orthopedic Care
- 10.2.4. Workplace Safety
- 10.2.5. Others
- 10.3. Market Analysis, Insights and Forecast - by End User
- 10.3.1. Athletes
- 10.3.2. Individuals
- 10.3.3. Corporate Wellness Programs
- 10.3.4. Sports Facilities
- 10.3.5. Healthcare Professionals
- 10.1. Market Analysis, Insights and Forecast - by Poduct
- 11. North America Ligament Stabilizer Market Analysis, Insights and Forecast, 2019-2031
- 11.1. Market Analysis, Insights and Forecast - By Country/Sub-region
- 11.1.1 United States
- 11.1.2 Canada
- 11.1.3 Mexico
- 12. Europe Ligament Stabilizer Market Analysis, Insights and Forecast, 2019-2031
- 12.1. Market Analysis, Insights and Forecast - By Country/Sub-region
- 12.1.1 Germany
- 12.1.2 United Kingdom
- 12.1.3 France
- 12.1.4 Italy
- 12.1.5 Spain
- 12.1.6 Rest of Europe
- 13. Asia Pacific Ligament Stabilizer Market Analysis, Insights and Forecast, 2019-2031
- 13.1. Market Analysis, Insights and Forecast - By Country/Sub-region
- 13.1.1 China
- 13.1.2 Japan
- 13.1.3 India
- 13.1.4 Australia
- 13.1.5 South Korea
- 13.1.6 Rest of Asia Pacific
- 14. Middle East and Africa Ligament Stabilizer Market Analysis, Insights and Forecast, 2019-2031
- 14.1. Market Analysis, Insights and Forecast - By Country/Sub-region
- 14.1.1 GCC
- 14.1.2 South Africa
- 14.1.3 Rest of Middle East and Africa
- 15. South America Ligament Stabilizer Market Analysis, Insights and Forecast, 2019-2031
- 15.1. Market Analysis, Insights and Forecast - By Country/Sub-region
- 15.1.1 Brazil
- 15.1.2 Argentina
- 15.1.3 Rest of South America
- 16. Competitive Analysis
- 16.1. Global Market Share Analysis 2024
- 16.2. Company Profiles
- 16.2.1 Bauerfeind AG
- 16.2.1.1. Overview
- 16.2.1.2. Products
- 16.2.1.3. SWOT Analysis
- 16.2.1.4. Recent Developments
- 16.2.1.5. Financials (Based on Availability)
- 16.2.2 Ossur hf
- 16.2.2.1. Overview
- 16.2.2.2. Products
- 16.2.2.3. SWOT Analysis
- 16.2.2.4. Recent Developments
- 16.2.2.5. Financials (Based on Availability)
- 16.2.3 BSN Medical GmbH
- 16.2.3.1. Overview
- 16.2.3.2. Products
- 16.2.3.3. SWOT Analysis
- 16.2.3.4. Recent Developments
- 16.2.3.5. Financials (Based on Availability)
- 16.2.4 Otto Bock Healthcare GmbH
- 16.2.4.1. Overview
- 16.2.4.2. Products
- 16.2.4.3. SWOT Analysis
- 16.2.4.4. Recent Developments
- 16.2.4.5. Financials (Based on Availability)
- 16.2.5 Medi GmbH & Co KG
- 16.2.5.1. Overview
- 16.2.5.2. Products
- 16.2.5.3. SWOT Analysis
- 16.2.5.4. Recent Developments
- 16.2.5.5. Financials (Based on Availability)
- 16.2.6 Thuasne SA
- 16.2.6.1. Overview
- 16.2.6.2. Products
- 16.2.6.3. SWOT Analysis
- 16.2.6.4. Recent Developments
- 16.2.6.5. Financials (Based on Availability)
- 16.2.7 DJO Global Inc
- 16.2.7.1. Overview
- 16.2.7.2. Products
- 16.2.7.3. SWOT Analysis
- 16.2.7.4. Recent Developments
- 16.2.7.5. Financials (Based on Availability)
- 16.2.8 3M Company
- 16.2.8.1. Overview
- 16.2.8.2. Products
- 16.2.8.3. SWOT Analysis
- 16.2.8.4. Recent Developments
- 16.2.8.5. Financials (Based on Availability)
- 16.2.9 DeRoyal Industries Incorporations
- 16.2.9.1. Overview
- 16.2.9.2. Products
- 16.2.9.3. SWOT Analysis
- 16.2.9.4. Recent Developments
- 16.2.9.5. Financials (Based on Availability)
- 16.2.1 Bauerfeind AG
List of Figures
- Figure 1: Global Ligament Stabilizer Market Revenue Breakdown (Million, %) by Region 2024 & 2032
- Figure 2: Global Ligament Stabilizer Market Volume Breakdown (K Unit, %) by Region 2024 & 2032
- Figure 3: North America Ligament Stabilizer Market Revenue (Million), by Country 2024 & 2032
- Figure 4: North America Ligament Stabilizer Market Volume (K Unit), by Country 2024 & 2032
- Figure 5: North America Ligament Stabilizer Market Revenue Share (%), by Country 2024 & 2032
- Figure 6: North America Ligament Stabilizer Market Volume Share (%), by Country 2024 & 2032
- Figure 7: Europe Ligament Stabilizer Market Revenue (Million), by Country 2024 & 2032
- Figure 8: Europe Ligament Stabilizer Market Volume (K Unit), by Country 2024 & 2032
- Figure 9: Europe Ligament Stabilizer Market Revenue Share (%), by Country 2024 & 2032
- Figure 10: Europe Ligament Stabilizer Market Volume Share (%), by Country 2024 & 2032
- Figure 11: Asia Pacific Ligament Stabilizer Market Revenue (Million), by Country 2024 & 2032
- Figure 12: Asia Pacific Ligament Stabilizer Market Volume (K Unit), by Country 2024 & 2032
- Figure 13: Asia Pacific Ligament Stabilizer Market Revenue Share (%), by Country 2024 & 2032
- Figure 14: Asia Pacific Ligament Stabilizer Market Volume Share (%), by Country 2024 & 2032
- Figure 15: Middle East and Africa Ligament Stabilizer Market Revenue (Million), by Country 2024 & 2032
- Figure 16: Middle East and Africa Ligament Stabilizer Market Volume (K Unit), by Country 2024 & 2032
- Figure 17: Middle East and Africa Ligament Stabilizer Market Revenue Share (%), by Country 2024 & 2032
- Figure 18: Middle East and Africa Ligament Stabilizer Market Volume Share (%), by Country 2024 & 2032
- Figure 19: South America Ligament Stabilizer Market Revenue (Million), by Country 2024 & 2032
- Figure 20: South America Ligament Stabilizer Market Volume (K Unit), by Country 2024 & 2032
- Figure 21: South America Ligament Stabilizer Market Revenue Share (%), by Country 2024 & 2032
- Figure 22: South America Ligament Stabilizer Market Volume Share (%), by Country 2024 & 2032
- Figure 23: North America Ligament Stabilizer Market Revenue (Million), by Poduct 2024 & 2032
- Figure 24: North America Ligament Stabilizer Market Volume (K Unit), by Poduct 2024 & 2032
- Figure 25: North America Ligament Stabilizer Market Revenue Share (%), by Poduct 2024 & 2032
- Figure 26: North America Ligament Stabilizer Market Volume Share (%), by Poduct 2024 & 2032
- Figure 27: North America Ligament Stabilizer Market Revenue (Million), by Application 2024 & 2032
- Figure 28: North America Ligament Stabilizer Market Volume (K Unit), by Application 2024 & 2032
- Figure 29: North America Ligament Stabilizer Market Revenue Share (%), by Application 2024 & 2032
- Figure 30: North America Ligament Stabilizer Market Volume Share (%), by Application 2024 & 2032
- Figure 31: North America Ligament Stabilizer Market Revenue (Million), by End User 2024 & 2032
- Figure 32: North America Ligament Stabilizer Market Volume (K Unit), by End User 2024 & 2032
- Figure 33: North America Ligament Stabilizer Market Revenue Share (%), by End User 2024 & 2032
- Figure 34: North America Ligament Stabilizer Market Volume Share (%), by End User 2024 & 2032
- Figure 35: North America Ligament Stabilizer Market Revenue (Million), by Country 2024 & 2032
- Figure 36: North America Ligament Stabilizer Market Volume (K Unit), by Country 2024 & 2032
- Figure 37: North America Ligament Stabilizer Market Revenue Share (%), by Country 2024 & 2032
- Figure 38: North America Ligament Stabilizer Market Volume Share (%), by Country 2024 & 2032
- Figure 39: Europe Ligament Stabilizer Market Revenue (Million), by Poduct 2024 & 2032
- Figure 40: Europe Ligament Stabilizer Market Volume (K Unit), by Poduct 2024 & 2032
- Figure 41: Europe Ligament Stabilizer Market Revenue Share (%), by Poduct 2024 & 2032
- Figure 42: Europe Ligament Stabilizer Market Volume Share (%), by Poduct 2024 & 2032
- Figure 43: Europe Ligament Stabilizer Market Revenue (Million), by Application 2024 & 2032
- Figure 44: Europe Ligament Stabilizer Market Volume (K Unit), by Application 2024 & 2032
- Figure 45: Europe Ligament Stabilizer Market Revenue Share (%), by Application 2024 & 2032
- Figure 46: Europe Ligament Stabilizer Market Volume Share (%), by Application 2024 & 2032
- Figure 47: Europe Ligament Stabilizer Market Revenue (Million), by End User 2024 & 2032
- Figure 48: Europe Ligament Stabilizer Market Volume (K Unit), by End User 2024 & 2032
- Figure 49: Europe Ligament Stabilizer Market Revenue Share (%), by End User 2024 & 2032
- Figure 50: Europe Ligament Stabilizer Market Volume Share (%), by End User 2024 & 2032
- Figure 51: Europe Ligament Stabilizer Market Revenue (Million), by Country 2024 & 2032
- Figure 52: Europe Ligament Stabilizer Market Volume (K Unit), by Country 2024 & 2032
- Figure 53: Europe Ligament Stabilizer Market Revenue Share (%), by Country 2024 & 2032
- Figure 54: Europe Ligament Stabilizer Market Volume Share (%), by Country 2024 & 2032
- Figure 55: Asia Pacific Ligament Stabilizer Market Revenue (Million), by Poduct 2024 & 2032
- Figure 56: Asia Pacific Ligament Stabilizer Market Volume (K Unit), by Poduct 2024 & 2032
- Figure 57: Asia Pacific Ligament Stabilizer Market Revenue Share (%), by Poduct 2024 & 2032
- Figure 58: Asia Pacific Ligament Stabilizer Market Volume Share (%), by Poduct 2024 & 2032
- Figure 59: Asia Pacific Ligament Stabilizer Market Revenue (Million), by Application 2024 & 2032
- Figure 60: Asia Pacific Ligament Stabilizer Market Volume (K Unit), by Application 2024 & 2032
- Figure 61: Asia Pacific Ligament Stabilizer Market Revenue Share (%), by Application 2024 & 2032
- Figure 62: Asia Pacific Ligament Stabilizer Market Volume Share (%), by Application 2024 & 2032
- Figure 63: Asia Pacific Ligament Stabilizer Market Revenue (Million), by End User 2024 & 2032
- Figure 64: Asia Pacific Ligament Stabilizer Market Volume (K Unit), by End User 2024 & 2032
- Figure 65: Asia Pacific Ligament Stabilizer Market Revenue Share (%), by End User 2024 & 2032
- Figure 66: Asia Pacific Ligament Stabilizer Market Volume Share (%), by End User 2024 & 2032
- Figure 67: Asia Pacific Ligament Stabilizer Market Revenue (Million), by Country 2024 & 2032
- Figure 68: Asia Pacific Ligament Stabilizer Market Volume (K Unit), by Country 2024 & 2032
- Figure 69: Asia Pacific Ligament Stabilizer Market Revenue Share (%), by Country 2024 & 2032
- Figure 70: Asia Pacific Ligament Stabilizer Market Volume Share (%), by Country 2024 & 2032
- Figure 71: Middle East and Africa Ligament Stabilizer Market Revenue (Million), by Poduct 2024 & 2032
- Figure 72: Middle East and Africa Ligament Stabilizer Market Volume (K Unit), by Poduct 2024 & 2032
- Figure 73: Middle East and Africa Ligament Stabilizer Market Revenue Share (%), by Poduct 2024 & 2032
- Figure 74: Middle East and Africa Ligament Stabilizer Market Volume Share (%), by Poduct 2024 & 2032
- Figure 75: Middle East and Africa Ligament Stabilizer Market Revenue (Million), by Application 2024 & 2032
- Figure 76: Middle East and Africa Ligament Stabilizer Market Volume (K Unit), by Application 2024 & 2032
- Figure 77: Middle East and Africa Ligament Stabilizer Market Revenue Share (%), by Application 2024 & 2032
- Figure 78: Middle East and Africa Ligament Stabilizer Market Volume Share (%), by Application 2024 & 2032
- Figure 79: Middle East and Africa Ligament Stabilizer Market Revenue (Million), by End User 2024 & 2032
- Figure 80: Middle East and Africa Ligament Stabilizer Market Volume (K Unit), by End User 2024 & 2032
- Figure 81: Middle East and Africa Ligament Stabilizer Market Revenue Share (%), by End User 2024 & 2032
- Figure 82: Middle East and Africa Ligament Stabilizer Market Volume Share (%), by End User 2024 & 2032
- Figure 83: Middle East and Africa Ligament Stabilizer Market Revenue (Million), by Country 2024 & 2032
- Figure 84: Middle East and Africa Ligament Stabilizer Market Volume (K Unit), by Country 2024 & 2032
- Figure 85: Middle East and Africa Ligament Stabilizer Market Revenue Share (%), by Country 2024 & 2032
- Figure 86: Middle East and Africa Ligament Stabilizer Market Volume Share (%), by Country 2024 & 2032
- Figure 87: South America Ligament Stabilizer Market Revenue (Million), by Poduct 2024 & 2032
- Figure 88: South America Ligament Stabilizer Market Volume (K Unit), by Poduct 2024 & 2032
- Figure 89: South America Ligament Stabilizer Market Revenue Share (%), by Poduct 2024 & 2032
- Figure 90: South America Ligament Stabilizer Market Volume Share (%), by Poduct 2024 & 2032
- Figure 91: South America Ligament Stabilizer Market Revenue (Million), by Application 2024 & 2032
- Figure 92: South America Ligament Stabilizer Market Volume (K Unit), by Application 2024 & 2032
- Figure 93: South America Ligament Stabilizer Market Revenue Share (%), by Application 2024 & 2032
- Figure 94: South America Ligament Stabilizer Market Volume Share (%), by Application 2024 & 2032
- Figure 95: South America Ligament Stabilizer Market Revenue (Million), by End User 2024 & 2032
- Figure 96: South America Ligament Stabilizer Market Volume (K Unit), by End User 2024 & 2032
- Figure 97: South America Ligament Stabilizer Market Revenue Share (%), by End User 2024 & 2032
- Figure 98: South America Ligament Stabilizer Market Volume Share (%), by End User 2024 & 2032
- Figure 99: South America Ligament Stabilizer Market Revenue (Million), by Country 2024 & 2032
- Figure 100: South America Ligament Stabilizer Market Volume (K Unit), by Country 2024 & 2032
- Figure 101: South America Ligament Stabilizer Market Revenue Share (%), by Country 2024 & 2032
- Figure 102: South America Ligament Stabilizer Market Volume Share (%), by Country 2024 & 2032
List of Tables
- Table 1: Global Ligament Stabilizer Market Revenue Million Forecast, by Region 2019 & 2032
- Table 2: Global Ligament Stabilizer Market Volume K Unit Forecast, by Region 2019 & 2032
- Table 3: Global Ligament Stabilizer Market Revenue Million Forecast, by Poduct 2019 & 2032
- Table 4: Global Ligament Stabilizer Market Volume K Unit Forecast, by Poduct 2019 & 2032
- Table 5: Global Ligament Stabilizer Market Revenue Million Forecast, by Application 2019 & 2032
- Table 6: Global Ligament Stabilizer Market Volume K Unit Forecast, by Application 2019 & 2032
- Table 7: Global Ligament Stabilizer Market Revenue Million Forecast, by End User 2019 & 2032
- Table 8: Global Ligament Stabilizer Market Volume K Unit Forecast, by End User 2019 & 2032
- Table 9: Global Ligament Stabilizer Market Revenue Million Forecast, by Region 2019 & 2032
- Table 10: Global Ligament Stabilizer Market Volume K Unit Forecast, by Region 2019 & 2032
- Table 11: Global Ligament Stabilizer Market Revenue Million Forecast, by Country 2019 & 2032
- Table 12: Global Ligament Stabilizer Market Volume K Unit Forecast, by Country 2019 & 2032
- Table 13: United States Ligament Stabilizer Market Revenue (Million) Forecast, by Application 2019 & 2032
- Table 14: United States Ligament Stabilizer Market Volume (K Unit) Forecast, by Application 2019 & 2032
- Table 15: Canada Ligament Stabilizer Market Revenue (Million) Forecast, by Application 2019 & 2032
- Table 16: Canada Ligament Stabilizer Market Volume (K Unit) Forecast, by Application 2019 & 2032
- Table 17: Mexico Ligament Stabilizer Market Revenue (Million) Forecast, by Application 2019 & 2032
- Table 18: Mexico Ligament Stabilizer Market Volume (K Unit) Forecast, by Application 2019 & 2032
- Table 19: Global Ligament Stabilizer Market Revenue Million Forecast, by Country 2019 & 2032
- Table 20: Global Ligament Stabilizer Market Volume K Unit Forecast, by Country 2019 & 2032
- Table 21: Germany Ligament Stabilizer Market Revenue (Million) Forecast, by Application 2019 & 2032
- Table 22: Germany Ligament Stabilizer Market Volume (K Unit) Forecast, by Application 2019 & 2032
- Table 23: United Kingdom Ligament Stabilizer Market Revenue (Million) Forecast, by Application 2019 & 2032
- Table 24: United Kingdom Ligament Stabilizer Market Volume (K Unit) Forecast, by Application 2019 & 2032
- Table 25: France Ligament Stabilizer Market Revenue (Million) Forecast, by Application 2019 & 2032
- Table 26: France Ligament Stabilizer Market Volume (K Unit) Forecast, by Application 2019 & 2032
- Table 27: Italy Ligament Stabilizer Market Revenue (Million) Forecast, by Application 2019 & 2032
- Table 28: Italy Ligament Stabilizer Market Volume (K Unit) Forecast, by Application 2019 & 2032
- Table 29: Spain Ligament Stabilizer Market Revenue (Million) Forecast, by Application 2019 & 2032
- Table 30: Spain Ligament Stabilizer Market Volume (K Unit) Forecast, by Application 2019 & 2032
- Table 31: Rest of Europe Ligament Stabilizer Market Revenue (Million) Forecast, by Application 2019 & 2032
- Table 32: Rest of Europe Ligament Stabilizer Market Volume (K Unit) Forecast, by Application 2019 & 2032
- Table 33: Global Ligament Stabilizer Market Revenue Million Forecast, by Country 2019 & 2032
- Table 34: Global Ligament Stabilizer Market Volume K Unit Forecast, by Country 2019 & 2032
- Table 35: China Ligament Stabilizer Market Revenue (Million) Forecast, by Application 2019 & 2032
- Table 36: China Ligament Stabilizer Market Volume (K Unit) Forecast, by Application 2019 & 2032
- Table 37: Japan Ligament Stabilizer Market Revenue (Million) Forecast, by Application 2019 & 2032
- Table 38: Japan Ligament Stabilizer Market Volume (K Unit) Forecast, by Application 2019 & 2032
- Table 39: India Ligament Stabilizer Market Revenue (Million) Forecast, by Application 2019 & 2032
- Table 40: India Ligament Stabilizer Market Volume (K Unit) Forecast, by Application 2019 & 2032
- Table 41: Australia Ligament Stabilizer Market Revenue (Million) Forecast, by Application 2019 & 2032
- Table 42: Australia Ligament Stabilizer Market Volume (K Unit) Forecast, by Application 2019 & 2032
- Table 43: South Korea Ligament Stabilizer Market Revenue (Million) Forecast, by Application 2019 & 2032
- Table 44: South Korea Ligament Stabilizer Market Volume (K Unit) Forecast, by Application 2019 & 2032
- Table 45: Rest of Asia Pacific Ligament Stabilizer Market Revenue (Million) Forecast, by Application 2019 & 2032
- Table 46: Rest of Asia Pacific Ligament Stabilizer Market Volume (K Unit) Forecast, by Application 2019 & 2032
- Table 47: Global Ligament Stabilizer Market Revenue Million Forecast, by Country 2019 & 2032
- Table 48: Global Ligament Stabilizer Market Volume K Unit Forecast, by Country 2019 & 2032
- Table 49: GCC Ligament Stabilizer Market Revenue (Million) Forecast, by Application 2019 & 2032
- Table 50: GCC Ligament Stabilizer Market Volume (K Unit) Forecast, by Application 2019 & 2032
- Table 51: South Africa Ligament Stabilizer Market Revenue (Million) Forecast, by Application 2019 & 2032
- Table 52: South Africa Ligament Stabilizer Market Volume (K Unit) Forecast, by Application 2019 & 2032
- Table 53: Rest of Middle East and Africa Ligament Stabilizer Market Revenue (Million) Forecast, by Application 2019 & 2032
- Table 54: Rest of Middle East and Africa Ligament Stabilizer Market Volume (K Unit) Forecast, by Application 2019 & 2032
- Table 55: Global Ligament Stabilizer Market Revenue Million Forecast, by Country 2019 & 2032
- Table 56: Global Ligament Stabilizer Market Volume K Unit Forecast, by Country 2019 & 2032
- Table 57: Brazil Ligament Stabilizer Market Revenue (Million) Forecast, by Application 2019 & 2032
- Table 58: Brazil Ligament Stabilizer Market Volume (K Unit) Forecast, by Application 2019 & 2032
- Table 59: Argentina Ligament Stabilizer Market Revenue (Million) Forecast, by Application 2019 & 2032
- Table 60: Argentina Ligament Stabilizer Market Volume (K Unit) Forecast, by Application 2019 & 2032
- Table 61: Rest of South America Ligament Stabilizer Market Revenue (Million) Forecast, by Application 2019 & 2032
- Table 62: Rest of South America Ligament Stabilizer Market Volume (K Unit) Forecast, by Application 2019 & 2032
- Table 63: Global Ligament Stabilizer Market Revenue Million Forecast, by Poduct 2019 & 2032
- Table 64: Global Ligament Stabilizer Market Volume K Unit Forecast, by Poduct 2019 & 2032
- Table 65: Global Ligament Stabilizer Market Revenue Million Forecast, by Application 2019 & 2032
- Table 66: Global Ligament Stabilizer Market Volume K Unit Forecast, by Application 2019 & 2032
- Table 67: Global Ligament Stabilizer Market Revenue Million Forecast, by End User 2019 & 2032
- Table 68: Global Ligament Stabilizer Market Volume K Unit Forecast, by End User 2019 & 2032
- Table 69: Global Ligament Stabilizer Market Revenue Million Forecast, by Country 2019 & 2032
- Table 70: Global Ligament Stabilizer Market Volume K Unit Forecast, by Country 2019 & 2032
- Table 71: United States Ligament Stabilizer Market Revenue (Million) Forecast, by Application 2019 & 2032
- Table 72: United States Ligament Stabilizer Market Volume (K Unit) Forecast, by Application 2019 & 2032
- Table 73: Canada Ligament Stabilizer Market Revenue (Million) Forecast, by Application 2019 & 2032
- Table 74: Canada Ligament Stabilizer Market Volume (K Unit) Forecast, by Application 2019 & 2032
- Table 75: Mexico Ligament Stabilizer Market Revenue (Million) Forecast, by Application 2019 & 2032
- Table 76: Mexico Ligament Stabilizer Market Volume (K Unit) Forecast, by Application 2019 & 2032
- Table 77: Global Ligament Stabilizer Market Revenue Million Forecast, by Poduct 2019 & 2032
- Table 78: Global Ligament Stabilizer Market Volume K Unit Forecast, by Poduct 2019 & 2032
- Table 79: Global Ligament Stabilizer Market Revenue Million Forecast, by Application 2019 & 2032
- Table 80: Global Ligament Stabilizer Market Volume K Unit Forecast, by Application 2019 & 2032
- Table 81: Global Ligament Stabilizer Market Revenue Million Forecast, by End User 2019 & 2032
- Table 82: Global Ligament Stabilizer Market Volume K Unit Forecast, by End User 2019 & 2032
- Table 83: Global Ligament Stabilizer Market Revenue Million Forecast, by Country 2019 & 2032
- Table 84: Global Ligament Stabilizer Market Volume K Unit Forecast, by Country 2019 & 2032
- Table 85: Germany Ligament Stabilizer Market Revenue (Million) Forecast, by Application 2019 & 2032
- Table 86: Germany Ligament Stabilizer Market Volume (K Unit) Forecast, by Application 2019 & 2032
- Table 87: United Kingdom Ligament Stabilizer Market Revenue (Million) Forecast, by Application 2019 & 2032
- Table 88: United Kingdom Ligament Stabilizer Market Volume (K Unit) Forecast, by Application 2019 & 2032
- Table 89: France Ligament Stabilizer Market Revenue (Million) Forecast, by Application 2019 & 2032
- Table 90: France Ligament Stabilizer Market Volume (K Unit) Forecast, by Application 2019 & 2032
- Table 91: Italy Ligament Stabilizer Market Revenue (Million) Forecast, by Application 2019 & 2032
- Table 92: Italy Ligament Stabilizer Market Volume (K Unit) Forecast, by Application 2019 & 2032
- Table 93: Spain Ligament Stabilizer Market Revenue (Million) Forecast, by Application 2019 & 2032
- Table 94: Spain Ligament Stabilizer Market Volume (K Unit) Forecast, by Application 2019 & 2032
- Table 95: Rest of Europe Ligament Stabilizer Market Revenue (Million) Forecast, by Application 2019 & 2032
- Table 96: Rest of Europe Ligament Stabilizer Market Volume (K Unit) Forecast, by Application 2019 & 2032
- Table 97: Global Ligament Stabilizer Market Revenue Million Forecast, by Poduct 2019 & 2032
- Table 98: Global Ligament Stabilizer Market Volume K Unit Forecast, by Poduct 2019 & 2032
- Table 99: Global Ligament Stabilizer Market Revenue Million Forecast, by Application 2019 & 2032
- Table 100: Global Ligament Stabilizer Market Volume K Unit Forecast, by Application 2019 & 2032
- Table 101: Global Ligament Stabilizer Market Revenue Million Forecast, by End User 2019 & 2032
- Table 102: Global Ligament Stabilizer Market Volume K Unit Forecast, by End User 2019 & 2032
- Table 103: Global Ligament Stabilizer Market Revenue Million Forecast, by Country 2019 & 2032
- Table 104: Global Ligament Stabilizer Market Volume K Unit Forecast, by Country 2019 & 2032
- Table 105: China Ligament Stabilizer Market Revenue (Million) Forecast, by Application 2019 & 2032
- Table 106: China Ligament Stabilizer Market Volume (K Unit) Forecast, by Application 2019 & 2032
- Table 107: Japan Ligament Stabilizer Market Revenue (Million) Forecast, by Application 2019 & 2032
- Table 108: Japan Ligament Stabilizer Market Volume (K Unit) Forecast, by Application 2019 & 2032
- Table 109: India Ligament Stabilizer Market Revenue (Million) Forecast, by Application 2019 & 2032
- Table 110: India Ligament Stabilizer Market Volume (K Unit) Forecast, by Application 2019 & 2032
- Table 111: Australia Ligament Stabilizer Market Revenue (Million) Forecast, by Application 2019 & 2032
- Table 112: Australia Ligament Stabilizer Market Volume (K Unit) Forecast, by Application 2019 & 2032
- Table 113: South Korea Ligament Stabilizer Market Revenue (Million) Forecast, by Application 2019 & 2032
- Table 114: South Korea Ligament Stabilizer Market Volume (K Unit) Forecast, by Application 2019 & 2032
- Table 115: Rest of Asia Pacific Ligament Stabilizer Market Revenue (Million) Forecast, by Application 2019 & 2032
- Table 116: Rest of Asia Pacific Ligament Stabilizer Market Volume (K Unit) Forecast, by Application 2019 & 2032
- Table 117: Global Ligament Stabilizer Market Revenue Million Forecast, by Poduct 2019 & 2032
- Table 118: Global Ligament Stabilizer Market Volume K Unit Forecast, by Poduct 2019 & 2032
- Table 119: Global Ligament Stabilizer Market Revenue Million Forecast, by Application 2019 & 2032
- Table 120: Global Ligament Stabilizer Market Volume K Unit Forecast, by Application 2019 & 2032
- Table 121: Global Ligament Stabilizer Market Revenue Million Forecast, by End User 2019 & 2032
- Table 122: Global Ligament Stabilizer Market Volume K Unit Forecast, by End User 2019 & 2032
- Table 123: Global Ligament Stabilizer Market Revenue Million Forecast, by Country 2019 & 2032
- Table 124: Global Ligament Stabilizer Market Volume K Unit Forecast, by Country 2019 & 2032
- Table 125: GCC Ligament Stabilizer Market Revenue (Million) Forecast, by Application 2019 & 2032
- Table 126: GCC Ligament Stabilizer Market Volume (K Unit) Forecast, by Application 2019 & 2032
- Table 127: South Africa Ligament Stabilizer Market Revenue (Million) Forecast, by Application 2019 & 2032
- Table 128: South Africa Ligament Stabilizer Market Volume (K Unit) Forecast, by Application 2019 & 2032
- Table 129: Rest of Middle East and Africa Ligament Stabilizer Market Revenue (Million) Forecast, by Application 2019 & 2032
- Table 130: Rest of Middle East and Africa Ligament Stabilizer Market Volume (K Unit) Forecast, by Application 2019 & 2032
- Table 131: Global Ligament Stabilizer Market Revenue Million Forecast, by Poduct 2019 & 2032
- Table 132: Global Ligament Stabilizer Market Volume K Unit Forecast, by Poduct 2019 & 2032
- Table 133: Global Ligament Stabilizer Market Revenue Million Forecast, by Application 2019 & 2032
- Table 134: Global Ligament Stabilizer Market Volume K Unit Forecast, by Application 2019 & 2032
- Table 135: Global Ligament Stabilizer Market Revenue Million Forecast, by End User 2019 & 2032
- Table 136: Global Ligament Stabilizer Market Volume K Unit Forecast, by End User 2019 & 2032
- Table 137: Global Ligament Stabilizer Market Revenue Million Forecast, by Country 2019 & 2032
- Table 138: Global Ligament Stabilizer Market Volume K Unit Forecast, by Country 2019 & 2032
- Table 139: Brazil Ligament Stabilizer Market Revenue (Million) Forecast, by Application 2019 & 2032
- Table 140: Brazil Ligament Stabilizer Market Volume (K Unit) Forecast, by Application 2019 & 2032
- Table 141: Argentina Ligament Stabilizer Market Revenue (Million) Forecast, by Application 2019 & 2032
- Table 142: Argentina Ligament Stabilizer Market Volume (K Unit) Forecast, by Application 2019 & 2032
- Table 143: Rest of South America Ligament Stabilizer Market Revenue (Million) Forecast, by Application 2019 & 2032
- Table 144: Rest of South America Ligament Stabilizer Market Volume (K Unit) Forecast, by Application 2019 & 2032
Frequently Asked Questions
1. What is the projected Compound Annual Growth Rate (CAGR) of the Ligament Stabilizer Market?
The projected CAGR is approximately 6.50%.
2. Which companies are prominent players in the Ligament Stabilizer Market?
Key companies in the market include Bauerfeind AG, Ossur hf, BSN Medical GmbH, Otto Bock Healthcare GmbH, Medi GmbH & Co KG, Thuasne SA, DJO Global Inc, 3M Company, DeRoyal Industries Incorporations.
3. What are the main segments of the Ligament Stabilizer Market?
The market segments include Poduct, Application, End User.
4. Can you provide details about the market size?
The market size is estimated to be USD XX Million as of 2022.
5. What are some drivers contributing to market growth?
; Increasing Incidences of Knee. Shoulder and Ankle Injuries; Technological Advancements to the Existing Products.
6. What are the notable trends driving market growth?
Knee Braces and Supports Segment is Expected to Hold a Major Market Share in the Ligament Stabilizer.
7. Are there any restraints impacting market growth?
; High Cost of Products; Stringent Regulatory Issues for the Approval of Products.
8. Can you provide examples of recent developments in the market?
N/A
9. What pricing options are available for accessing the report?
Pricing options include single-user, multi-user, and enterprise licenses priced at USD 4750, USD 5250, and USD 8750 respectively.
10. Is the market size provided in terms of value or volume?
The market size is provided in terms of value, measured in Million and volume, measured in K Unit.
11. Are there any specific market keywords associated with the report?
Yes, the market keyword associated with the report is "Ligament Stabilizer Market," which aids in identifying and referencing the specific market segment covered.
12. How do I determine which pricing option suits my needs best?
The pricing options vary based on user requirements and access needs. Individual users may opt for single-user licenses, while businesses requiring broader access may choose multi-user or enterprise licenses for cost-effective access to the report.
13. Are there any additional resources or data provided in the Ligament Stabilizer Market report?
While the report offers comprehensive insights, it's advisable to review the specific contents or supplementary materials provided to ascertain if additional resources or data are available.
14. How can I stay updated on further developments or reports in the Ligament Stabilizer Market?
To stay informed about further developments, trends, and reports in the Ligament Stabilizer Market, consider subscribing to industry newsletters, following relevant companies and organizations, or regularly checking reputable industry news sources and publications.
Methodology
Step 1 - Identification of Relevant Samples Size from Population Database


Step 2 - Approaches for Defining Global Market Size (Value, Volume* & Price*)

Note*: In applicable scenarios
Step 3 - Data Sources
Primary Research
- Web Analytics
- Survey Reports
- Research Institute
- Latest Research Reports
- Opinion Leaders
Secondary Research
- Annual Reports
- White Paper
- Latest Press Release
- Industry Association
- Paid Database
- Investor Presentations

Step 4 - Data Triangulation
Involves using different sources of information in order to increase the validity of a study
These sources are likely to be stakeholders in a program - participants, other researchers, program staff, other community members, and so on.
Then we put all data in single framework & apply various statistical tools to find out the dynamic on the market.
During the analysis stage, feedback from the stakeholder groups would be compared to determine areas of agreement as well as areas of divergence


