
Key Insights
The global large-scale LNG (Liquefied Natural Gas) terminals market is experiencing robust growth, driven by increasing global demand for natural gas as a cleaner-burning fossil fuel and the ongoing energy transition. The market's compound annual growth rate (CAGR) exceeding 5% signifies a consistently expanding sector, fueled by several key factors. Rising energy security concerns across nations are prompting investments in LNG infrastructure to diversify energy sources and reduce reliance on single suppliers. Furthermore, the growth of LNG as a fuel for transportation, particularly shipping, and the increasing adoption of LNG in power generation are significant contributors to market expansion. The market is segmented by location (onshore and offshore) and operation (liquefaction and regasification), with onshore facilities currently dominating due to lower initial investment costs and easier regulatory approvals. However, offshore terminals are gaining traction due to their suitability in deepwater locations and proximity to gas fields. Major players such as Tokyo Gas, Shell, ExxonMobil, BP, and Cheniere Energy are actively investing in expanding their capacities and geographic reach, creating a competitive yet dynamic market landscape. Geopolitical events and fluctuating energy prices are likely to influence the market’s trajectory, creating both opportunities and challenges for industry participants.
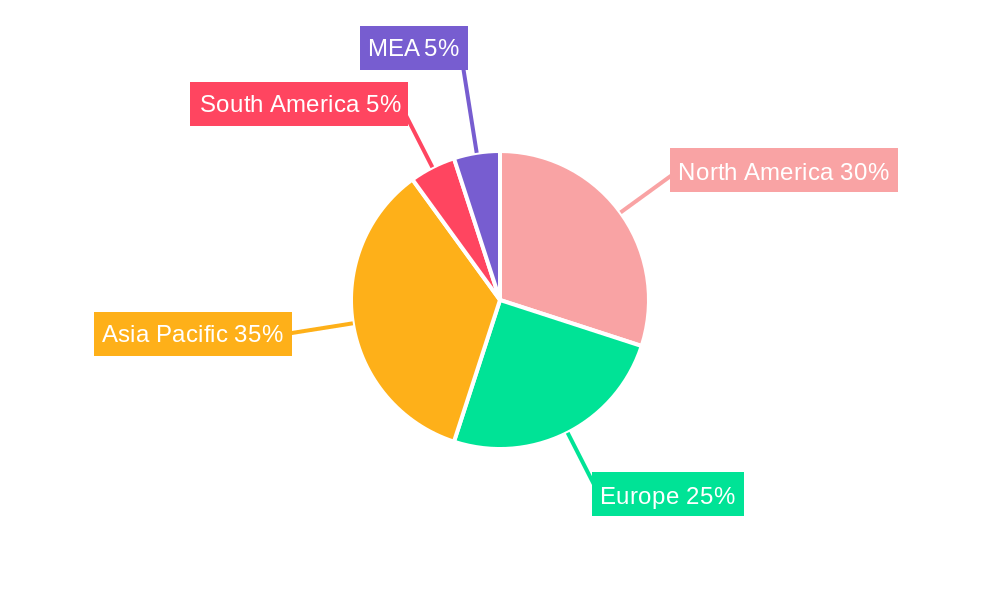
Despite the positive growth outlook, certain restraints could potentially impact the market. These include the high capital expenditure required for building and maintaining large-scale LNG terminals, potential regulatory hurdles and permitting delays, and the environmental concerns associated with natural gas production and transportation. Nevertheless, technological advancements aimed at improving efficiency, reducing emissions, and optimizing operations are mitigating some of these constraints. The Asia-Pacific region, particularly China, Japan, and India, is expected to witness significant growth due to rapidly expanding energy demands and ongoing industrialization. North America also plays a crucial role as a major LNG exporter, with the United States emerging as a key player in global LNG trade. The ongoing development of new LNG projects and expansion of existing infrastructure in various regions further supports the positive growth forecast for the large-scale LNG terminal market through 2033.
Large Scale LNG Terminals Industry Market Report: 2019-2033
This comprehensive report provides a detailed analysis of the global Large Scale LNG Terminals industry, encompassing market dynamics, growth trends, regional insights, and key player strategies. With a focus on the parent market of energy infrastructure and the child market of liquefied natural gas (LNG) handling, this report offers invaluable insights for industry professionals, investors, and strategic decision-makers. The study period covers 2019-2033, with a base year of 2025 and a forecast period of 2025-2033. Market values are presented in millions of units.
Large Scale LNG Terminals Industry Market Dynamics & Structure
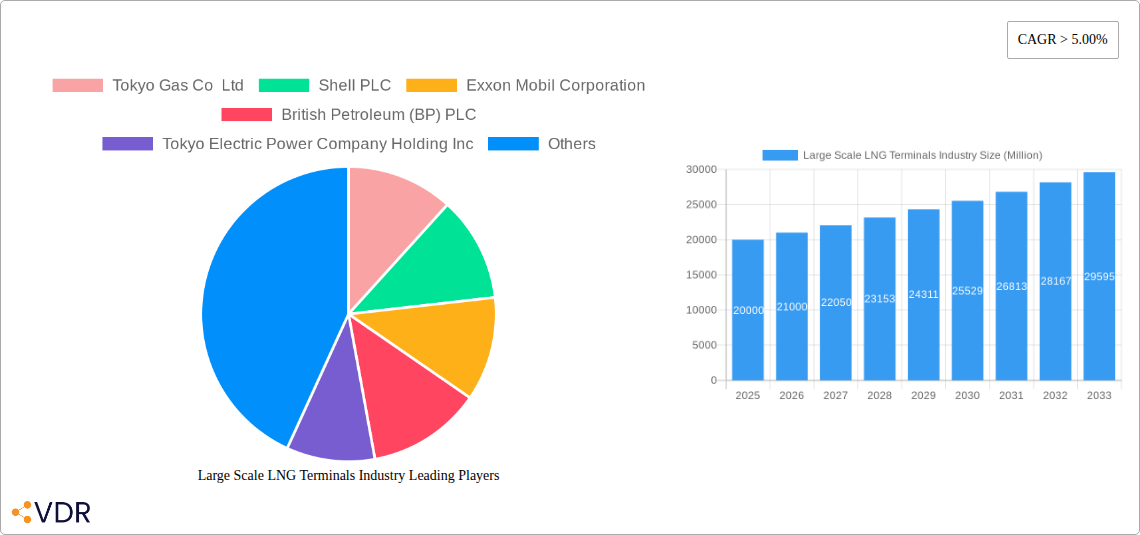
The Large Scale LNG Terminals market exhibits a moderately concentrated structure, with key players like Shell PLC, Exxon Mobil Corporation, British Petroleum (BP) PLC, Cheniere Energy Inc, and TotalEnergies SE holding significant market share. Technological innovation, particularly in liquefaction and regasification technologies, plays a crucial role. Stringent environmental regulations and evolving geopolitical landscapes significantly influence market dynamics. The increasing demand for natural gas as a transition fuel is a key driver, while competition from alternative energy sources represents a significant challenge. M&A activity in the sector has been moderate in recent years, with xx deals valued at approximately $xx million in 2024.
- Market Concentration: Moderately concentrated, with top 5 players holding xx% market share (2024).
- Technological Innovation: Focus on efficiency improvements, reduced emissions, and automation.
- Regulatory Frameworks: Stringent environmental regulations and safety standards.
- Competitive Product Substitutes: Renewable energy sources, pipeline gas.
- End-User Demographics: Primarily utilities, industrial consumers, and LNG exporters.
- M&A Trends: Moderate activity, driven by expansion and diversification strategies.
Large Scale LNG Terminals Industry Growth Trends & Insights
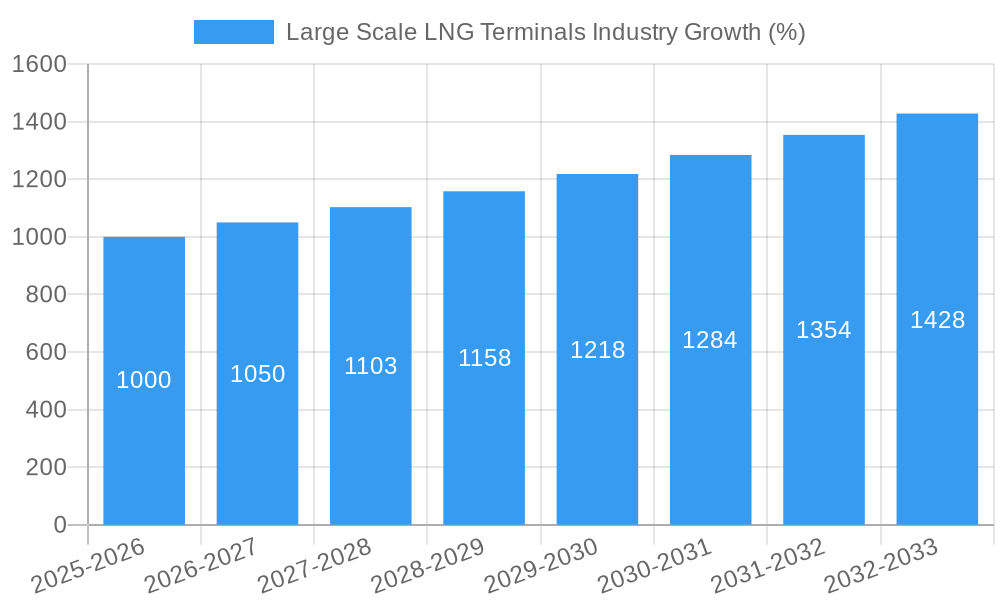
The global Large Scale LNG Terminals market witnessed robust growth during the historical period (2019-2024), with a CAGR of xx%. This growth is attributed to rising global energy demand, increasing LNG trade volumes, and the development of new LNG infrastructure projects. The market size is projected to reach $xx million by 2025 and is expected to maintain a steady CAGR of xx% during the forecast period (2025-2033), reaching $xx million by 2033. This growth is fueled by continuous technological advancements, supportive government policies, and strategic investments in new LNG projects worldwide. The adoption rate of advanced technologies, such as floating LNG terminals, is also increasing significantly, contributing to market expansion. Shifting consumer preferences towards cleaner energy sources, while still relying on natural gas as a transition fuel, further drives market growth.
Dominant Regions, Countries, or Segments in Large Scale LNG Terminals Industry
The Asia-Pacific region, particularly China and Japan, dominates the Large Scale LNG Terminals market, driven by high energy demand and extensive investments in LNG infrastructure. North America also holds a significant market share due to the abundance of shale gas resources and the growth of LNG export terminals. Onshore terminals currently represent a larger market share than offshore terminals due to lower capital costs and established infrastructure. However, the offshore segment is expected to witness substantial growth, driven by the development of floating LNG (FLNG) facilities and a need to access offshore gas resources. Similarly, Regasification facilities are currently holding a larger market share than Liquefaction facilities.
- Asia-Pacific: High energy demand, government support, and strategic investments.
- North America: Abundant shale gas resources, and growth of LNG export terminals.
- Europe: Increasing demand for LNG due to energy security concerns.
- Onshore Terminals: Lower capital costs, established infrastructure.
- Offshore Terminals (FLNG): Access to offshore gas resources, adaptability.
- Regasification: Rising LNG import demand.
- Liquefaction: High in regions with significant LNG production.
Large Scale LNG Terminals Industry Product Landscape
The Large Scale LNG Terminals industry offers a diverse range of products, including onshore and offshore terminals, with varying capacities and technological features. Innovations focus on enhancing efficiency, safety, and environmental performance. Advanced technologies such as automated systems, cryogenic storage tanks, and advanced vaporization systems are improving the overall performance and reliability of these terminals. Unique selling propositions include reduced environmental impact, optimized operational efficiency, and enhanced safety features.
Key Drivers, Barriers & Challenges in Large Scale LNG Terminals Industry
Key Drivers:
- Rising global energy demand, particularly in Asia-Pacific.
- Increasing LNG trade volumes and diversification of supply sources.
- Government policies promoting LNG infrastructure development.
- Technological advancements in LNG liquefaction and regasification.
Key Challenges:
- High capital costs associated with constructing new LNG terminals.
- Environmental concerns related to LNG production and transportation.
- Geopolitical risks and uncertainties impacting LNG supply chains.
- Competition from renewable energy sources. Estimated reduction in market size due to renewable penetration by 2033: $xx million
Emerging Opportunities in Large Scale LNG Terminals Industry
- Expansion into developing markets with high growth potential.
- Development of small-scale LNG terminals to serve remote areas.
- Integration of renewable energy sources into LNG terminals.
- Application of digital technologies to enhance operational efficiency.
Growth Accelerators in the Large Scale LNG Terminals Industry
Technological breakthroughs in liquefaction and regasification technologies, strategic partnerships to facilitate project development, and expansion into new markets are key catalysts for long-term growth. Government support through favorable policies and investment incentives further accelerate market expansion.
Key Players Shaping the Large Scale LNG Terminals Industry Market
- Tokyo Gas Co Ltd
- Shell PLC
- Exxon Mobil Corporation
- British Petroleum (BP) PLC
- Tokyo Electric Power Company Holding Inc
- Cheniere Energy Inc
- China National Offshore Oil Corporation (CNOOC)
- Chevron Corporation
- Petronet LNG Ltd
- TotalEnergies SE
Notable Milestones in Large Scale LNG Terminals Industry Sector
- November 2022: Germany completed construction of its first floating LNG terminal at Wilhelmshaven.
- November 2022: China initiated expansion of its Yangshan port LNG facility, investing USD 2.37 billion.
In-Depth Large Scale LNG Terminals Industry Market Outlook
The future of the Large Scale LNG Terminals market appears promising, driven by sustained global energy demand, ongoing investments in LNG infrastructure, and technological advancements. Strategic partnerships and diversification strategies will be crucial for market players to capitalize on emerging opportunities and navigate the evolving energy landscape. Continued innovation and adaptation to changing regulatory environments will be essential for long-term success.
Large Scale LNG Terminals Industry Segmentation
-
1. Location of Deployment
- 1.1. Onshore
- 1.2. Offshore
-
2. Operation
- 2.1. Liquefaction
- 2.2. Regasification
Large Scale LNG Terminals Industry Segmentation By Geography
- 1. North America
- 2. Asia Pacific
- 3. Europe
- 4. South America
- 5. Middle East
Large Scale LNG Terminals Industry REPORT HIGHLIGHTS
| Aspects | Details |
|---|---|
| Study Period | 2019-2033 |
| Base Year | 2024 |
| Estimated Year | 2025 |
| Forecast Period | 2025-2033 |
| Historical Period | 2019-2024 |
| Growth Rate | CAGR of > 5.00% from 2019-2033 |
| Segmentation |
|
Table of Contents
- 1. Introduction
- 1.1. Research Scope
- 1.2. Market Segmentation
- 1.3. Research Methodology
- 1.4. Definitions and Assumptions
- 2. Executive Summary
- 2.1. Introduction
- 3. Market Dynamics
- 3.1. Introduction
- 3.2. Market Drivers
- 3.2.1. 4.; Increasing Demand for Sales of Commercial Vehicles4.; Increasing Deployment of Retail Fuel Outlets Across Various Countries
- 3.3. Market Restrains
- 3.3.1. 4.; Growing Penetration and Demand for Electric Vehicles
- 3.4. Market Trends
- 3.4.1. Regasification LNG Terminals to Dominate the Market
- 4. Market Factor Analysis
- 4.1. Porters Five Forces
- 4.2. Supply/Value Chain
- 4.3. PESTEL analysis
- 4.4. Market Entropy
- 4.5. Patent/Trademark Analysis
- 5. Global Large Scale LNG Terminals Industry Analysis, Insights and Forecast, 2019-2031
- 5.1. Market Analysis, Insights and Forecast - by Location of Deployment
- 5.1.1. Onshore
- 5.1.2. Offshore
- 5.2. Market Analysis, Insights and Forecast - by Operation
- 5.2.1. Liquefaction
- 5.2.2. Regasification
- 5.3. Market Analysis, Insights and Forecast - by Region
- 5.3.1. North America
- 5.3.2. Asia Pacific
- 5.3.3. Europe
- 5.3.4. South America
- 5.3.5. Middle East
- 5.1. Market Analysis, Insights and Forecast - by Location of Deployment
- 6. North America Large Scale LNG Terminals Industry Analysis, Insights and Forecast, 2019-2031
- 6.1. Market Analysis, Insights and Forecast - by Location of Deployment
- 6.1.1. Onshore
- 6.1.2. Offshore
- 6.2. Market Analysis, Insights and Forecast - by Operation
- 6.2.1. Liquefaction
- 6.2.2. Regasification
- 6.1. Market Analysis, Insights and Forecast - by Location of Deployment
- 7. Asia Pacific Large Scale LNG Terminals Industry Analysis, Insights and Forecast, 2019-2031
- 7.1. Market Analysis, Insights and Forecast - by Location of Deployment
- 7.1.1. Onshore
- 7.1.2. Offshore
- 7.2. Market Analysis, Insights and Forecast - by Operation
- 7.2.1. Liquefaction
- 7.2.2. Regasification
- 7.1. Market Analysis, Insights and Forecast - by Location of Deployment
- 8. Europe Large Scale LNG Terminals Industry Analysis, Insights and Forecast, 2019-2031
- 8.1. Market Analysis, Insights and Forecast - by Location of Deployment
- 8.1.1. Onshore
- 8.1.2. Offshore
- 8.2. Market Analysis, Insights and Forecast - by Operation
- 8.2.1. Liquefaction
- 8.2.2. Regasification
- 8.1. Market Analysis, Insights and Forecast - by Location of Deployment
- 9. South America Large Scale LNG Terminals Industry Analysis, Insights and Forecast, 2019-2031
- 9.1. Market Analysis, Insights and Forecast - by Location of Deployment
- 9.1.1. Onshore
- 9.1.2. Offshore
- 9.2. Market Analysis, Insights and Forecast - by Operation
- 9.2.1. Liquefaction
- 9.2.2. Regasification
- 9.1. Market Analysis, Insights and Forecast - by Location of Deployment
- 10. Middle East Large Scale LNG Terminals Industry Analysis, Insights and Forecast, 2019-2031
- 10.1. Market Analysis, Insights and Forecast - by Location of Deployment
- 10.1.1. Onshore
- 10.1.2. Offshore
- 10.2. Market Analysis, Insights and Forecast - by Operation
- 10.2.1. Liquefaction
- 10.2.2. Regasification
- 10.1. Market Analysis, Insights and Forecast - by Location of Deployment
- 11. North America Large Scale LNG Terminals Industry Analysis, Insights and Forecast, 2019-2031
- 11.1. Market Analysis, Insights and Forecast - By Country/Sub-region
- 11.1.1 United States
- 11.1.2 Canada
- 11.1.3 Mexico
- 12. Europe Large Scale LNG Terminals Industry Analysis, Insights and Forecast, 2019-2031
- 12.1. Market Analysis, Insights and Forecast - By Country/Sub-region
- 12.1.1 Germany
- 12.1.2 United Kingdom
- 12.1.3 France
- 12.1.4 Spain
- 12.1.5 Italy
- 12.1.6 Spain
- 12.1.7 Belgium
- 12.1.8 Netherland
- 12.1.9 Nordics
- 12.1.10 Rest of Europe
- 13. Asia Pacific Large Scale LNG Terminals Industry Analysis, Insights and Forecast, 2019-2031
- 13.1. Market Analysis, Insights and Forecast - By Country/Sub-region
- 13.1.1 China
- 13.1.2 Japan
- 13.1.3 India
- 13.1.4 South Korea
- 13.1.5 Southeast Asia
- 13.1.6 Australia
- 13.1.7 Indonesia
- 13.1.8 Phillipes
- 13.1.9 Singapore
- 13.1.10 Thailandc
- 13.1.11 Rest of Asia Pacific
- 14. South America Large Scale LNG Terminals Industry Analysis, Insights and Forecast, 2019-2031
- 14.1. Market Analysis, Insights and Forecast - By Country/Sub-region
- 14.1.1 Brazil
- 14.1.2 Argentina
- 14.1.3 Peru
- 14.1.4 Chile
- 14.1.5 Colombia
- 14.1.6 Ecuador
- 14.1.7 Venezuela
- 14.1.8 Rest of South America
- 15. North America Large Scale LNG Terminals Industry Analysis, Insights and Forecast, 2019-2031
- 15.1. Market Analysis, Insights and Forecast - By Country/Sub-region
- 15.1.1 United States
- 15.1.2 Canada
- 15.1.3 Mexico
- 16. MEA Large Scale LNG Terminals Industry Analysis, Insights and Forecast, 2019-2031
- 16.1. Market Analysis, Insights and Forecast - By Country/Sub-region
- 16.1.1 United Arab Emirates
- 16.1.2 Saudi Arabia
- 16.1.3 South Africa
- 16.1.4 Rest of Middle East and Africa
- 17. Competitive Analysis
- 17.1. Global Market Share Analysis 2024
- 17.2. Company Profiles
- 17.2.1 Tokyo Gas Co Ltd
- 17.2.1.1. Overview
- 17.2.1.2. Products
- 17.2.1.3. SWOT Analysis
- 17.2.1.4. Recent Developments
- 17.2.1.5. Financials (Based on Availability)
- 17.2.2 Shell PLC
- 17.2.2.1. Overview
- 17.2.2.2. Products
- 17.2.2.3. SWOT Analysis
- 17.2.2.4. Recent Developments
- 17.2.2.5. Financials (Based on Availability)
- 17.2.3 Exxon Mobil Corporation
- 17.2.3.1. Overview
- 17.2.3.2. Products
- 17.2.3.3. SWOT Analysis
- 17.2.3.4. Recent Developments
- 17.2.3.5. Financials (Based on Availability)
- 17.2.4 British Petroleum (BP) PLC
- 17.2.4.1. Overview
- 17.2.4.2. Products
- 17.2.4.3. SWOT Analysis
- 17.2.4.4. Recent Developments
- 17.2.4.5. Financials (Based on Availability)
- 17.2.5 Tokyo Electric Power Company Holding Inc
- 17.2.5.1. Overview
- 17.2.5.2. Products
- 17.2.5.3. SWOT Analysis
- 17.2.5.4. Recent Developments
- 17.2.5.5. Financials (Based on Availability)
- 17.2.6 Cheniere Energy Inc
- 17.2.6.1. Overview
- 17.2.6.2. Products
- 17.2.6.3. SWOT Analysis
- 17.2.6.4. Recent Developments
- 17.2.6.5. Financials (Based on Availability)
- 17.2.7 China National Offshore Oil Corporation (CNOOC)
- 17.2.7.1. Overview
- 17.2.7.2. Products
- 17.2.7.3. SWOT Analysis
- 17.2.7.4. Recent Developments
- 17.2.7.5. Financials (Based on Availability)
- 17.2.8 Chevron Corporation
- 17.2.8.1. Overview
- 17.2.8.2. Products
- 17.2.8.3. SWOT Analysis
- 17.2.8.4. Recent Developments
- 17.2.8.5. Financials (Based on Availability)
- 17.2.9 Petronet LNG Ltd*List Not Exhaustive
- 17.2.9.1. Overview
- 17.2.9.2. Products
- 17.2.9.3. SWOT Analysis
- 17.2.9.4. Recent Developments
- 17.2.9.5. Financials (Based on Availability)
- 17.2.10 TotalEnergies SE
- 17.2.10.1. Overview
- 17.2.10.2. Products
- 17.2.10.3. SWOT Analysis
- 17.2.10.4. Recent Developments
- 17.2.10.5. Financials (Based on Availability)
- 17.2.1 Tokyo Gas Co Ltd
List of Figures
- Figure 1: Global Large Scale LNG Terminals Industry Revenue Breakdown (Million, %) by Region 2024 & 2032
- Figure 2: North America Large Scale LNG Terminals Industry Revenue (Million), by Country 2024 & 2032
- Figure 3: North America Large Scale LNG Terminals Industry Revenue Share (%), by Country 2024 & 2032
- Figure 4: Europe Large Scale LNG Terminals Industry Revenue (Million), by Country 2024 & 2032
- Figure 5: Europe Large Scale LNG Terminals Industry Revenue Share (%), by Country 2024 & 2032
- Figure 6: Asia Pacific Large Scale LNG Terminals Industry Revenue (Million), by Country 2024 & 2032
- Figure 7: Asia Pacific Large Scale LNG Terminals Industry Revenue Share (%), by Country 2024 & 2032
- Figure 8: South America Large Scale LNG Terminals Industry Revenue (Million), by Country 2024 & 2032
- Figure 9: South America Large Scale LNG Terminals Industry Revenue Share (%), by Country 2024 & 2032
- Figure 10: North America Large Scale LNG Terminals Industry Revenue (Million), by Country 2024 & 2032
- Figure 11: North America Large Scale LNG Terminals Industry Revenue Share (%), by Country 2024 & 2032
- Figure 12: MEA Large Scale LNG Terminals Industry Revenue (Million), by Country 2024 & 2032
- Figure 13: MEA Large Scale LNG Terminals Industry Revenue Share (%), by Country 2024 & 2032
- Figure 14: North America Large Scale LNG Terminals Industry Revenue (Million), by Location of Deployment 2024 & 2032
- Figure 15: North America Large Scale LNG Terminals Industry Revenue Share (%), by Location of Deployment 2024 & 2032
- Figure 16: North America Large Scale LNG Terminals Industry Revenue (Million), by Operation 2024 & 2032
- Figure 17: North America Large Scale LNG Terminals Industry Revenue Share (%), by Operation 2024 & 2032
- Figure 18: North America Large Scale LNG Terminals Industry Revenue (Million), by Country 2024 & 2032
- Figure 19: North America Large Scale LNG Terminals Industry Revenue Share (%), by Country 2024 & 2032
- Figure 20: Asia Pacific Large Scale LNG Terminals Industry Revenue (Million), by Location of Deployment 2024 & 2032
- Figure 21: Asia Pacific Large Scale LNG Terminals Industry Revenue Share (%), by Location of Deployment 2024 & 2032
- Figure 22: Asia Pacific Large Scale LNG Terminals Industry Revenue (Million), by Operation 2024 & 2032
- Figure 23: Asia Pacific Large Scale LNG Terminals Industry Revenue Share (%), by Operation 2024 & 2032
- Figure 24: Asia Pacific Large Scale LNG Terminals Industry Revenue (Million), by Country 2024 & 2032
- Figure 25: Asia Pacific Large Scale LNG Terminals Industry Revenue Share (%), by Country 2024 & 2032
- Figure 26: Europe Large Scale LNG Terminals Industry Revenue (Million), by Location of Deployment 2024 & 2032
- Figure 27: Europe Large Scale LNG Terminals Industry Revenue Share (%), by Location of Deployment 2024 & 2032
- Figure 28: Europe Large Scale LNG Terminals Industry Revenue (Million), by Operation 2024 & 2032
- Figure 29: Europe Large Scale LNG Terminals Industry Revenue Share (%), by Operation 2024 & 2032
- Figure 30: Europe Large Scale LNG Terminals Industry Revenue (Million), by Country 2024 & 2032
- Figure 31: Europe Large Scale LNG Terminals Industry Revenue Share (%), by Country 2024 & 2032
- Figure 32: South America Large Scale LNG Terminals Industry Revenue (Million), by Location of Deployment 2024 & 2032
- Figure 33: South America Large Scale LNG Terminals Industry Revenue Share (%), by Location of Deployment 2024 & 2032
- Figure 34: South America Large Scale LNG Terminals Industry Revenue (Million), by Operation 2024 & 2032
- Figure 35: South America Large Scale LNG Terminals Industry Revenue Share (%), by Operation 2024 & 2032
- Figure 36: South America Large Scale LNG Terminals Industry Revenue (Million), by Country 2024 & 2032
- Figure 37: South America Large Scale LNG Terminals Industry Revenue Share (%), by Country 2024 & 2032
- Figure 38: Middle East Large Scale LNG Terminals Industry Revenue (Million), by Location of Deployment 2024 & 2032
- Figure 39: Middle East Large Scale LNG Terminals Industry Revenue Share (%), by Location of Deployment 2024 & 2032
- Figure 40: Middle East Large Scale LNG Terminals Industry Revenue (Million), by Operation 2024 & 2032
- Figure 41: Middle East Large Scale LNG Terminals Industry Revenue Share (%), by Operation 2024 & 2032
- Figure 42: Middle East Large Scale LNG Terminals Industry Revenue (Million), by Country 2024 & 2032
- Figure 43: Middle East Large Scale LNG Terminals Industry Revenue Share (%), by Country 2024 & 2032
List of Tables
- Table 1: Global Large Scale LNG Terminals Industry Revenue Million Forecast, by Region 2019 & 2032
- Table 2: Global Large Scale LNG Terminals Industry Revenue Million Forecast, by Location of Deployment 2019 & 2032
- Table 3: Global Large Scale LNG Terminals Industry Revenue Million Forecast, by Operation 2019 & 2032
- Table 4: Global Large Scale LNG Terminals Industry Revenue Million Forecast, by Region 2019 & 2032
- Table 5: Global Large Scale LNG Terminals Industry Revenue Million Forecast, by Country 2019 & 2032
- Table 6: United States Large Scale LNG Terminals Industry Revenue (Million) Forecast, by Application 2019 & 2032
- Table 7: Canada Large Scale LNG Terminals Industry Revenue (Million) Forecast, by Application 2019 & 2032
- Table 8: Mexico Large Scale LNG Terminals Industry Revenue (Million) Forecast, by Application 2019 & 2032
- Table 9: Global Large Scale LNG Terminals Industry Revenue Million Forecast, by Country 2019 & 2032
- Table 10: Germany Large Scale LNG Terminals Industry Revenue (Million) Forecast, by Application 2019 & 2032
- Table 11: United Kingdom Large Scale LNG Terminals Industry Revenue (Million) Forecast, by Application 2019 & 2032
- Table 12: France Large Scale LNG Terminals Industry Revenue (Million) Forecast, by Application 2019 & 2032
- Table 13: Spain Large Scale LNG Terminals Industry Revenue (Million) Forecast, by Application 2019 & 2032
- Table 14: Italy Large Scale LNG Terminals Industry Revenue (Million) Forecast, by Application 2019 & 2032
- Table 15: Spain Large Scale LNG Terminals Industry Revenue (Million) Forecast, by Application 2019 & 2032
- Table 16: Belgium Large Scale LNG Terminals Industry Revenue (Million) Forecast, by Application 2019 & 2032
- Table 17: Netherland Large Scale LNG Terminals Industry Revenue (Million) Forecast, by Application 2019 & 2032
- Table 18: Nordics Large Scale LNG Terminals Industry Revenue (Million) Forecast, by Application 2019 & 2032
- Table 19: Rest of Europe Large Scale LNG Terminals Industry Revenue (Million) Forecast, by Application 2019 & 2032
- Table 20: Global Large Scale LNG Terminals Industry Revenue Million Forecast, by Country 2019 & 2032
- Table 21: China Large Scale LNG Terminals Industry Revenue (Million) Forecast, by Application 2019 & 2032
- Table 22: Japan Large Scale LNG Terminals Industry Revenue (Million) Forecast, by Application 2019 & 2032
- Table 23: India Large Scale LNG Terminals Industry Revenue (Million) Forecast, by Application 2019 & 2032
- Table 24: South Korea Large Scale LNG Terminals Industry Revenue (Million) Forecast, by Application 2019 & 2032
- Table 25: Southeast Asia Large Scale LNG Terminals Industry Revenue (Million) Forecast, by Application 2019 & 2032
- Table 26: Australia Large Scale LNG Terminals Industry Revenue (Million) Forecast, by Application 2019 & 2032
- Table 27: Indonesia Large Scale LNG Terminals Industry Revenue (Million) Forecast, by Application 2019 & 2032
- Table 28: Phillipes Large Scale LNG Terminals Industry Revenue (Million) Forecast, by Application 2019 & 2032
- Table 29: Singapore Large Scale LNG Terminals Industry Revenue (Million) Forecast, by Application 2019 & 2032
- Table 30: Thailandc Large Scale LNG Terminals Industry Revenue (Million) Forecast, by Application 2019 & 2032
- Table 31: Rest of Asia Pacific Large Scale LNG Terminals Industry Revenue (Million) Forecast, by Application 2019 & 2032
- Table 32: Global Large Scale LNG Terminals Industry Revenue Million Forecast, by Country 2019 & 2032
- Table 33: Brazil Large Scale LNG Terminals Industry Revenue (Million) Forecast, by Application 2019 & 2032
- Table 34: Argentina Large Scale LNG Terminals Industry Revenue (Million) Forecast, by Application 2019 & 2032
- Table 35: Peru Large Scale LNG Terminals Industry Revenue (Million) Forecast, by Application 2019 & 2032
- Table 36: Chile Large Scale LNG Terminals Industry Revenue (Million) Forecast, by Application 2019 & 2032
- Table 37: Colombia Large Scale LNG Terminals Industry Revenue (Million) Forecast, by Application 2019 & 2032
- Table 38: Ecuador Large Scale LNG Terminals Industry Revenue (Million) Forecast, by Application 2019 & 2032
- Table 39: Venezuela Large Scale LNG Terminals Industry Revenue (Million) Forecast, by Application 2019 & 2032
- Table 40: Rest of South America Large Scale LNG Terminals Industry Revenue (Million) Forecast, by Application 2019 & 2032
- Table 41: Global Large Scale LNG Terminals Industry Revenue Million Forecast, by Country 2019 & 2032
- Table 42: United States Large Scale LNG Terminals Industry Revenue (Million) Forecast, by Application 2019 & 2032
- Table 43: Canada Large Scale LNG Terminals Industry Revenue (Million) Forecast, by Application 2019 & 2032
- Table 44: Mexico Large Scale LNG Terminals Industry Revenue (Million) Forecast, by Application 2019 & 2032
- Table 45: Global Large Scale LNG Terminals Industry Revenue Million Forecast, by Country 2019 & 2032
- Table 46: United Arab Emirates Large Scale LNG Terminals Industry Revenue (Million) Forecast, by Application 2019 & 2032
- Table 47: Saudi Arabia Large Scale LNG Terminals Industry Revenue (Million) Forecast, by Application 2019 & 2032
- Table 48: South Africa Large Scale LNG Terminals Industry Revenue (Million) Forecast, by Application 2019 & 2032
- Table 49: Rest of Middle East and Africa Large Scale LNG Terminals Industry Revenue (Million) Forecast, by Application 2019 & 2032
- Table 50: Global Large Scale LNG Terminals Industry Revenue Million Forecast, by Location of Deployment 2019 & 2032
- Table 51: Global Large Scale LNG Terminals Industry Revenue Million Forecast, by Operation 2019 & 2032
- Table 52: Global Large Scale LNG Terminals Industry Revenue Million Forecast, by Country 2019 & 2032
- Table 53: Global Large Scale LNG Terminals Industry Revenue Million Forecast, by Location of Deployment 2019 & 2032
- Table 54: Global Large Scale LNG Terminals Industry Revenue Million Forecast, by Operation 2019 & 2032
- Table 55: Global Large Scale LNG Terminals Industry Revenue Million Forecast, by Country 2019 & 2032
- Table 56: Global Large Scale LNG Terminals Industry Revenue Million Forecast, by Location of Deployment 2019 & 2032
- Table 57: Global Large Scale LNG Terminals Industry Revenue Million Forecast, by Operation 2019 & 2032
- Table 58: Global Large Scale LNG Terminals Industry Revenue Million Forecast, by Country 2019 & 2032
- Table 59: Global Large Scale LNG Terminals Industry Revenue Million Forecast, by Location of Deployment 2019 & 2032
- Table 60: Global Large Scale LNG Terminals Industry Revenue Million Forecast, by Operation 2019 & 2032
- Table 61: Global Large Scale LNG Terminals Industry Revenue Million Forecast, by Country 2019 & 2032
- Table 62: Global Large Scale LNG Terminals Industry Revenue Million Forecast, by Location of Deployment 2019 & 2032
- Table 63: Global Large Scale LNG Terminals Industry Revenue Million Forecast, by Operation 2019 & 2032
- Table 64: Global Large Scale LNG Terminals Industry Revenue Million Forecast, by Country 2019 & 2032
Frequently Asked Questions
1. What is the projected Compound Annual Growth Rate (CAGR) of the Large Scale LNG Terminals Industry?
The projected CAGR is approximately > 5.00%.
2. Which companies are prominent players in the Large Scale LNG Terminals Industry?
Key companies in the market include Tokyo Gas Co Ltd, Shell PLC, Exxon Mobil Corporation, British Petroleum (BP) PLC, Tokyo Electric Power Company Holding Inc, Cheniere Energy Inc, China National Offshore Oil Corporation (CNOOC), Chevron Corporation, Petronet LNG Ltd*List Not Exhaustive, TotalEnergies SE.
3. What are the main segments of the Large Scale LNG Terminals Industry?
The market segments include Location of Deployment, Operation.
4. Can you provide details about the market size?
The market size is estimated to be USD XX Million as of 2022.
5. What are some drivers contributing to market growth?
4.; Increasing Demand for Sales of Commercial Vehicles4.; Increasing Deployment of Retail Fuel Outlets Across Various Countries.
6. What are the notable trends driving market growth?
Regasification LNG Terminals to Dominate the Market.
7. Are there any restraints impacting market growth?
4.; Growing Penetration and Demand for Electric Vehicles.
8. Can you provide examples of recent developments in the market?
November 2022: Germany finished the construction of its first floating LNG terminal at the North Sea port of Wilhelmshaven, as the country scrambles to obtain additional LNG and transition away from Russian pipeline gas.
9. What pricing options are available for accessing the report?
Pricing options include single-user, multi-user, and enterprise licenses priced at USD 4750, USD 5250, and USD 8750 respectively.
10. Is the market size provided in terms of value or volume?
The market size is provided in terms of value, measured in Million.
11. Are there any specific market keywords associated with the report?
Yes, the market keyword associated with the report is "Large Scale LNG Terminals Industry," which aids in identifying and referencing the specific market segment covered.
12. How do I determine which pricing option suits my needs best?
The pricing options vary based on user requirements and access needs. Individual users may opt for single-user licenses, while businesses requiring broader access may choose multi-user or enterprise licenses for cost-effective access to the report.
13. Are there any additional resources or data provided in the Large Scale LNG Terminals Industry report?
While the report offers comprehensive insights, it's advisable to review the specific contents or supplementary materials provided to ascertain if additional resources or data are available.
14. How can I stay updated on further developments or reports in the Large Scale LNG Terminals Industry?
To stay informed about further developments, trends, and reports in the Large Scale LNG Terminals Industry, consider subscribing to industry newsletters, following relevant companies and organizations, or regularly checking reputable industry news sources and publications.
Methodology
Step 1 - Identification of Relevant Samples Size from Population Database


Step 2 - Approaches for Defining Global Market Size (Value, Volume* & Price*)

Note*: In applicable scenarios
Step 3 - Data Sources
Primary Research
- Web Analytics
- Survey Reports
- Research Institute
- Latest Research Reports
- Opinion Leaders
Secondary Research
- Annual Reports
- White Paper
- Latest Press Release
- Industry Association
- Paid Database
- Investor Presentations

Step 4 - Data Triangulation
Involves using different sources of information in order to increase the validity of a study
These sources are likely to be stakeholders in a program - participants, other researchers, program staff, other community members, and so on.
Then we put all data in single framework & apply various statistical tools to find out the dynamic on the market.
During the analysis stage, feedback from the stakeholder groups would be compared to determine areas of agreement as well as areas of divergence


