Key Insights
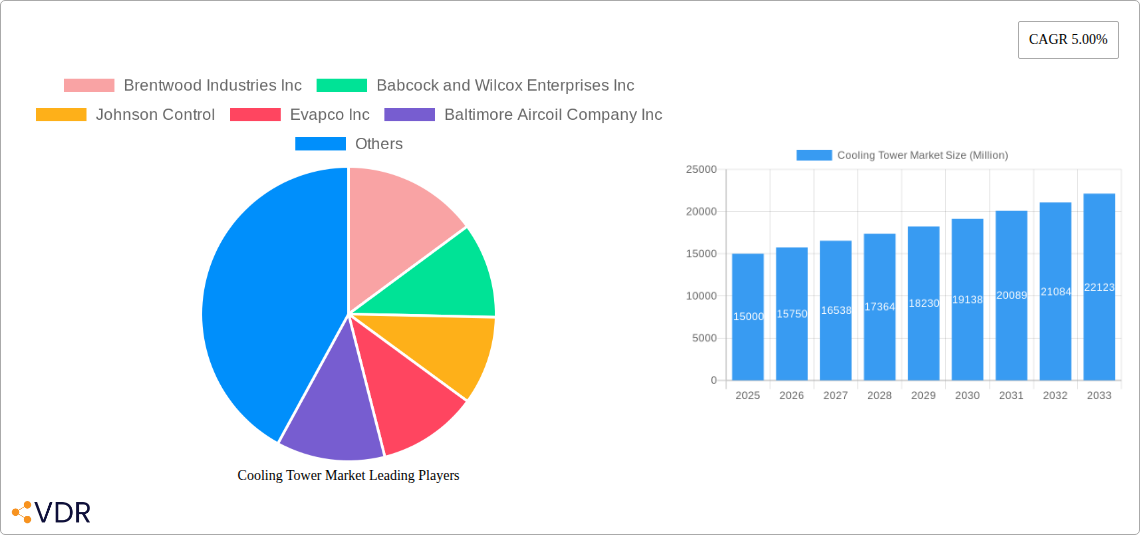
The global cooling tower market, valued at approximately $4.4 billion in 2025, is projected for significant expansion, exhibiting a Compound Annual Growth Rate (CAGR) of 5.1% from 2025 to 2033. This growth is propelled by increasing demand for efficient thermal management across key sectors including power generation, oil & gas, HVACR, and chemical processing. Stringent environmental regulations promoting energy efficiency and water conservation are further driving the adoption of advanced solutions like dry and hybrid cooling towers. Industrial infrastructure development, particularly in the rapidly growing Asia Pacific and MEA regions, also contributes to market expansion. While evaporative cooling towers remain popular due to cost-effectiveness, dry and hybrid variants are gaining traction for their water-saving capabilities.
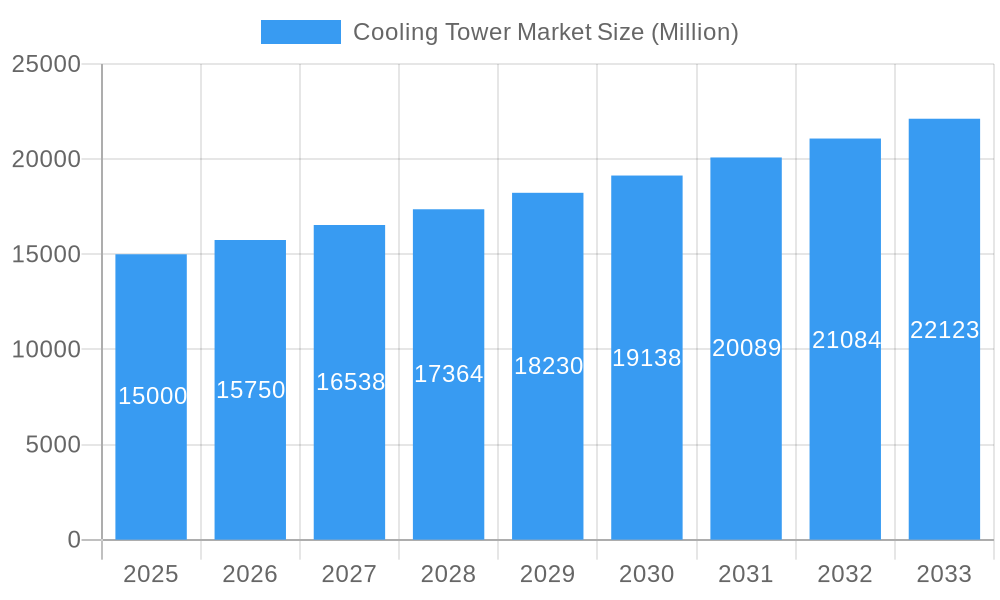
Cooling Tower Market Market Size (In Billion)
Market growth may be tempered by raw material price volatility, impacting manufacturing costs. Operational challenges, such as scaling and fouling requiring consistent maintenance, and environmental concerns related to water usage and Legionella risk, necessitate robust operational protocols. The market is expected to pivot towards innovations focused on enhanced energy efficiency, reduced water consumption, and environmental sustainability. While North America and Europe currently dominate, Asia Pacific's rapid industrialization is poised for substantial market growth.
Cooling Tower Market Company Market Share
Cooling Tower Market Report: 2019-2033
This comprehensive report provides an in-depth analysis of the global cooling tower market, encompassing market dynamics, growth trends, regional performance, and competitive landscape. With a study period spanning 2019-2033, a base year of 2025, and a forecast period of 2025-2033, this report is an invaluable resource for industry professionals, investors, and strategic decision-makers. The report covers key segments including Evaporative Cooling Tower, Dry Cooling Tower, and Hybrid Cooling Tower, across applications such as the Oil Industry, HVACR, Chemical Industry, and Power Generation. The market size is presented in million units.
Cooling Tower Market Dynamics & Structure
This section analyzes the intricate dynamics shaping the cooling tower market, incorporating both quantitative and qualitative insights. Market concentration is assessed, revealing the dominance of key players and the potential for future consolidation. Technological advancements, particularly in energy efficiency and water conservation, are examined alongside regulatory frameworks impacting design and deployment. The report also evaluates competitive substitutes and explores emerging trends in mergers and acquisitions (M&A).
- Market Concentration: The market exhibits a moderately concentrated structure with a few dominant players holding significant market share (xx%). Smaller players specialize in niche applications or regional markets.
- Technological Innovation: Key drivers include advancements in materials science (e.g., corrosion-resistant materials), improved heat transfer technologies, and the integration of smart controls for enhanced efficiency. Barriers to innovation include high R&D costs and the need for robust testing and certification.
- Regulatory Landscape: Stringent environmental regulations, particularly concerning water usage and greenhouse gas emissions, are significantly impacting the market, driving demand for energy-efficient and water-saving cooling tower designs.
- M&A Activity: The past five years have witnessed xx M&A deals in the cooling tower sector, primarily focused on expanding geographical reach and acquiring specialized technologies.
Cooling Tower Market Growth Trends & Insights
This section provides a detailed analysis of the cooling tower market's growth trajectory, leveraging both historical data and future projections. It examines market size evolution, adoption rates across various segments, the impact of technological disruptions, and shifts in consumer behavior. Specific metrics like the Compound Annual Growth Rate (CAGR) and market penetration rates are provided to offer a comprehensive understanding of market growth. The market is expected to experience a CAGR of xx% during the forecast period (2025-2033), driven by factors such as increasing demand from power generation and industrial sectors.
- Market Size Evolution: The global cooling tower market size was valued at xx million units in 2024 and is projected to reach xx million units by 2033.
- Adoption Rates: Adoption rates are highest in the power generation sector (xx%), followed by the chemical industry (xx%).
- Technological Disruptions: The emergence of advanced materials and energy-efficient designs are driving significant market disruption.
- Consumer Behavior: A rising focus on sustainability and reduced environmental impact is shaping consumer purchasing decisions.
Dominant Regions, Countries, or Segments in Cooling Tower Market
This section identifies the leading regions, countries, and segments driving market growth within the cooling tower industry. Factors influencing this dominance are analyzed, considering market share, growth potential, and underlying economic conditions.
- Leading Region: Asia-Pacific is projected to be the dominant region, driven by rapid industrialization and infrastructure development. North America and Europe will also show significant growth.
- Dominant Application: Power generation remains the leading application segment, followed by the chemical industry and HVACR. The oil and gas industry is experiencing moderate growth.
- Leading Flow Type: Crossflow cooling towers currently hold the largest market share due to their cost-effectiveness. However, counterflow towers are gaining traction due to improved efficiency.
- Leading Type: Evaporative cooling towers dominate the market due to their established technology and lower initial cost. Dry and hybrid cooling towers are growing in popularity, particularly in regions with water scarcity.
Key Drivers: Increased investment in infrastructure, rising energy consumption in developing countries, and stringent environmental regulations are key growth drivers.
Cooling Tower Market Product Landscape
The cooling tower market offers a diverse range of products, each tailored to specific applications and performance requirements. This section details product innovations, applications, and performance metrics, highlighting unique selling propositions and technological advancements that are shaping competitive dynamics. Recent innovations focus on enhanced energy efficiency, reduced water consumption, and simplified maintenance.
Key Drivers, Barriers & Challenges in Cooling Tower Market
Key Drivers:
- Increasing demand from power generation and industrial sectors.
- Stringent environmental regulations promoting energy efficiency and water conservation.
- Technological advancements leading to improved performance and reduced operational costs.
Key Challenges & Restraints:
- High initial investment costs can hinder adoption, particularly in smaller companies.
- Water scarcity in certain regions restricts the use of traditional evaporative cooling towers.
- Supply chain disruptions can impact manufacturing and delivery timelines.
Emerging Opportunities in Cooling Tower Market
- Untapped Markets: Developing economies present significant growth opportunities, particularly in regions with expanding industrial sectors and limited cooling infrastructure.
- Innovative Applications: Emerging applications in data centers and renewable energy projects are driving demand for specialized cooling tower solutions.
- Evolving Consumer Preferences: A growing focus on sustainability is driving demand for eco-friendly cooling tower designs.
Growth Accelerators in the Cooling Tower Market Industry
Technological breakthroughs in heat transfer technology, materials science, and automation are accelerating market growth. Strategic partnerships between manufacturers and end-users are also fostering innovation and expanding market reach. Aggressive market expansion strategies, particularly in emerging markets, are creating significant growth opportunities.
Key Players Shaping the Cooling Tower Market Market
- Brentwood Industries Inc
- Babcock and Wilcox Enterprises Inc
- Johnson Controls Johnson Controls
- Evapco Inc Evapco Inc
- Baltimore Aircoil Company Inc Baltimore Aircoil Company Inc
- Artech Cooling Towers Pvt Ltd
- SPX Cooling Tech LLC SPX FLOW
- Hamon and CIE Hamon
- Thermax Limited Thermax Limited
- Enexio Management Gmbh
Notable Milestones in Cooling Tower Market Sector
- February 2023: Baltimore Aircoil Company (BAC) launched the TrilliumSeries Adiabatic Cooler, emphasizing energy efficiency and reduced water usage.
- November 2022: Russia completed the installation of a 179m-tall cooling tower at the Kursk II nuclear power plant, the tallest in the country.
In-Depth Cooling Tower Market Market Outlook
The cooling tower market is poised for sustained growth, driven by ongoing industrialization, increasing energy demands, and the pressing need for sustainable cooling solutions. Strategic investments in R&D, coupled with strategic partnerships and aggressive market expansion strategies, will further propel market expansion in the coming years. The focus on energy efficiency, water conservation, and environmentally friendly designs will be key drivers of future market success.
Cooling Tower Market Segmentation
-
1. Application
- 1.1. Oil Industry
- 1.2. HVACR
- 1.3. Chemical Industry
- 1.4. Power Generation
- 1.5. Others
-
2. Flow Type
- 2.1. Cross Flow
- 2.2. Counter Flow
-
3. Type
- 3.1. Evaporative Cooling Tower
- 3.2. Dry Cooling Tower
- 3.3. Hybrid Cooling Tower
Cooling Tower Market Segmentation By Geography
-
1. North America
- 1.1. United States
- 1.2. Canada
- 1.3. Rest of North America
-
2. Europe
- 2.1. Germany
- 2.2. France
- 2.3. United Kingdom
- 2.4. Russia
- 2.5. Rest of Europe
-
3. Asia Pacific
- 3.1. China
- 3.2. India
- 3.3. Australia
- 3.4. Malaysia
- 3.5. Rest of Asia Pacific
-
4. Middle East and Africa
- 4.1. Saudi Arabia
- 4.2. United Arab Emirates
- 4.3. Nigeria
- 4.4. Rest of Middle East and Africa
-
5. South America
- 5.1. Brazil
- 5.2. Argentina
- 5.3. Columbia
- 5.4. Rest of South America
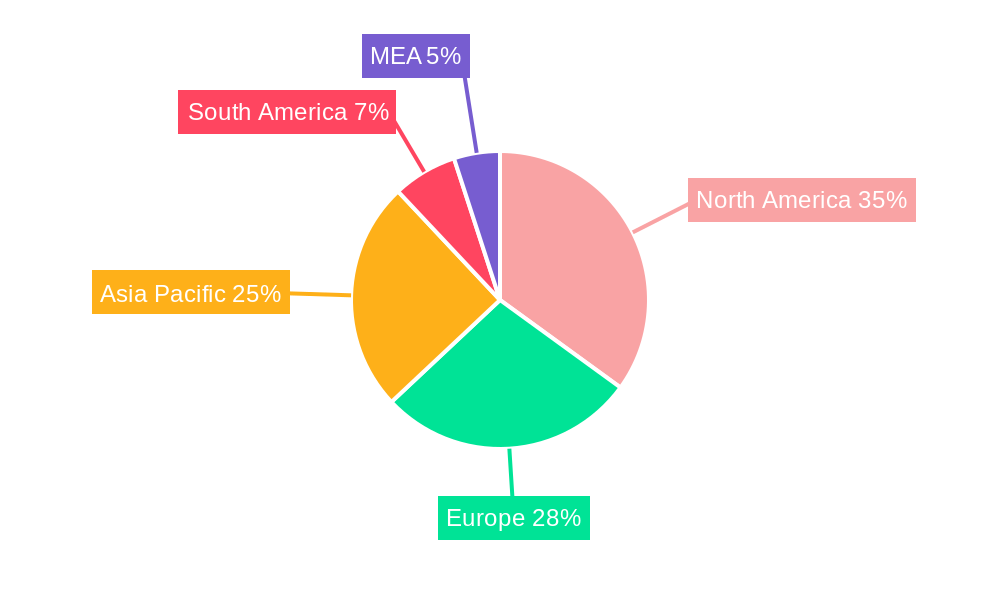
Cooling Tower Market Regional Market Share
Geographic Coverage of Cooling Tower Market
Cooling Tower Market REPORT HIGHLIGHTS
| Aspects | Details |
|---|---|
| Study Period | 2020-2034 |
| Base Year | 2025 |
| Estimated Year | 2026 |
| Forecast Period | 2026-2034 |
| Historical Period | 2020-2025 |
| Growth Rate | CAGR of 5.1% from 2020-2034 |
| Segmentation |
|
Table of Contents
- 1. Introduction
- 1.1. Research Scope
- 1.2. Market Segmentation
- 1.3. Research Objective
- 1.4. Definitions and Assumptions
- 2. Executive Summary
- 2.1. Market Snapshot
- 3. Market Dynamics
- 3.1. Market Drivers
- 3.2. Market Restrains
- 3.3. Market Trends
- 3.4. Market Opportunities
- 4. Market Factor Analysis
- 4.1. Porters Five Forces
- 4.1.1. Bargaining Power of Suppliers
- 4.1.2. Bargaining Power of Buyers
- 4.1.3. Threat of New Entrants
- 4.1.4. Threat of Substitutes
- 4.1.5. Competitive Rivalry
- 4.2. PESTEL analysis
- 4.3. BCG Analysis
- 4.3.1. Stars (High Growth, High Market Share)
- 4.3.2. Cash Cows (Low Growth, High Market Share)
- 4.3.3. Question Mark (High Growth, Low Market Share)
- 4.3.4. Dogs (Low Growth, Low Market Share)
- 4.4. Ansoff Matrix Analysis
- 4.5. Supply Chain Analysis
- 4.6. Regulatory Landscape
- 4.7. Current Market Potential and Opportunity Assessment (TAM–SAM–SOM Framework)
- 4.8. VDR Analyst Note
- 4.1. Porters Five Forces
- 5. Market Analysis, Insights and Forecast 2021-2033
- 5.1. Market Analysis, Insights and Forecast - by Application
- 5.1.1. Oil Industry
- 5.1.2. HVACR
- 5.1.3. Chemical Industry
- 5.1.4. Power Generation
- 5.1.5. Others
- 5.2. Market Analysis, Insights and Forecast - by Flow Type
- 5.2.1. Cross Flow
- 5.2.2. Counter Flow
- 5.3. Market Analysis, Insights and Forecast - by Type
- 5.3.1. Evaporative Cooling Tower
- 5.3.2. Dry Cooling Tower
- 5.3.3. Hybrid Cooling Tower
- 5.4. Market Analysis, Insights and Forecast - by Region
- 5.4.1. North America
- 5.4.2. Europe
- 5.4.3. Asia Pacific
- 5.4.4. Middle East and Africa
- 5.4.5. South America
- 5.1. Market Analysis, Insights and Forecast - by Application
- 6. Global Cooling Tower Market Analysis, Insights and Forecast, 2021-2033
- 6.1. Market Analysis, Insights and Forecast - by Application
- 6.1.1. Oil Industry
- 6.1.2. HVACR
- 6.1.3. Chemical Industry
- 6.1.4. Power Generation
- 6.1.5. Others
- 6.2. Market Analysis, Insights and Forecast - by Flow Type
- 6.2.1. Cross Flow
- 6.2.2. Counter Flow
- 6.3. Market Analysis, Insights and Forecast - by Type
- 6.3.1. Evaporative Cooling Tower
- 6.3.2. Dry Cooling Tower
- 6.3.3. Hybrid Cooling Tower
- 6.1. Market Analysis, Insights and Forecast - by Application
- 7. North America Cooling Tower Market Analysis, Insights and Forecast, 2021-2033
- 7.1. Market Analysis, Insights and Forecast - by Application
- 7.1.1. Oil Industry
- 7.1.2. HVACR
- 7.1.3. Chemical Industry
- 7.1.4. Power Generation
- 7.1.5. Others
- 7.2. Market Analysis, Insights and Forecast - by Flow Type
- 7.2.1. Cross Flow
- 7.2.2. Counter Flow
- 7.3. Market Analysis, Insights and Forecast - by Type
- 7.3.1. Evaporative Cooling Tower
- 7.3.2. Dry Cooling Tower
- 7.3.3. Hybrid Cooling Tower
- 7.1. Market Analysis, Insights and Forecast - by Application
- 8. Europe Cooling Tower Market Analysis, Insights and Forecast, 2021-2033
- 8.1. Market Analysis, Insights and Forecast - by Application
- 8.1.1. Oil Industry
- 8.1.2. HVACR
- 8.1.3. Chemical Industry
- 8.1.4. Power Generation
- 8.1.5. Others
- 8.2. Market Analysis, Insights and Forecast - by Flow Type
- 8.2.1. Cross Flow
- 8.2.2. Counter Flow
- 8.3. Market Analysis, Insights and Forecast - by Type
- 8.3.1. Evaporative Cooling Tower
- 8.3.2. Dry Cooling Tower
- 8.3.3. Hybrid Cooling Tower
- 8.1. Market Analysis, Insights and Forecast - by Application
- 9. Asia Pacific Cooling Tower Market Analysis, Insights and Forecast, 2021-2033
- 9.1. Market Analysis, Insights and Forecast - by Application
- 9.1.1. Oil Industry
- 9.1.2. HVACR
- 9.1.3. Chemical Industry
- 9.1.4. Power Generation
- 9.1.5. Others
- 9.2. Market Analysis, Insights and Forecast - by Flow Type
- 9.2.1. Cross Flow
- 9.2.2. Counter Flow
- 9.3. Market Analysis, Insights and Forecast - by Type
- 9.3.1. Evaporative Cooling Tower
- 9.3.2. Dry Cooling Tower
- 9.3.3. Hybrid Cooling Tower
- 9.1. Market Analysis, Insights and Forecast - by Application
- 10. Middle East and Africa Cooling Tower Market Analysis, Insights and Forecast, 2021-2033
- 10.1. Market Analysis, Insights and Forecast - by Application
- 10.1.1. Oil Industry
- 10.1.2. HVACR
- 10.1.3. Chemical Industry
- 10.1.4. Power Generation
- 10.1.5. Others
- 10.2. Market Analysis, Insights and Forecast - by Flow Type
- 10.2.1. Cross Flow
- 10.2.2. Counter Flow
- 10.3. Market Analysis, Insights and Forecast - by Type
- 10.3.1. Evaporative Cooling Tower
- 10.3.2. Dry Cooling Tower
- 10.3.3. Hybrid Cooling Tower
- 10.1. Market Analysis, Insights and Forecast - by Application
- 11. South America Cooling Tower Market Analysis, Insights and Forecast, 2021-2033
- 11.1. Market Analysis, Insights and Forecast - by Application
- 11.1.1. Oil Industry
- 11.1.2. HVACR
- 11.1.3. Chemical Industry
- 11.1.4. Power Generation
- 11.1.5. Others
- 11.2. Market Analysis, Insights and Forecast - by Flow Type
- 11.2.1. Cross Flow
- 11.2.2. Counter Flow
- 11.3. Market Analysis, Insights and Forecast - by Type
- 11.3.1. Evaporative Cooling Tower
- 11.3.2. Dry Cooling Tower
- 11.3.3. Hybrid Cooling Tower
- 11.1. Market Analysis, Insights and Forecast - by Application
- 12. Competitive Analysis
- 12.1. Company Profiles
- 12.1.1 Brentwood Industries Inc
- 12.1.1.1. Company Overview
- 12.1.1.2. Products
- 12.1.1.3. Company Financials
- 12.1.1.4. SWOT Analysis
- 12.1.2 Babcock and Wilcox Enterprises Inc
- 12.1.2.1. Company Overview
- 12.1.2.2. Products
- 12.1.2.3. Company Financials
- 12.1.2.4. SWOT Analysis
- 12.1.3 Johnson Control
- 12.1.3.1. Company Overview
- 12.1.3.2. Products
- 12.1.3.3. Company Financials
- 12.1.3.4. SWOT Analysis
- 12.1.4 Evapco Inc
- 12.1.4.1. Company Overview
- 12.1.4.2. Products
- 12.1.4.3. Company Financials
- 12.1.4.4. SWOT Analysis
- 12.1.5 Baltimore Aircoil Company Inc
- 12.1.5.1. Company Overview
- 12.1.5.2. Products
- 12.1.5.3. Company Financials
- 12.1.5.4. SWOT Analysis
- 12.1.6 Artech Cooling Towers Pvt Ltd
- 12.1.6.1. Company Overview
- 12.1.6.2. Products
- 12.1.6.3. Company Financials
- 12.1.6.4. SWOT Analysis
- 12.1.7 SPX Cooling Tech LLC
- 12.1.7.1. Company Overview
- 12.1.7.2. Products
- 12.1.7.3. Company Financials
- 12.1.7.4. SWOT Analysis
- 12.1.8 Hamon and CIE
- 12.1.8.1. Company Overview
- 12.1.8.2. Products
- 12.1.8.3. Company Financials
- 12.1.8.4. SWOT Analysis
- 12.1.9 Thermax Limited*List Not Exhaustive
- 12.1.9.1. Company Overview
- 12.1.9.2. Products
- 12.1.9.3. Company Financials
- 12.1.9.4. SWOT Analysis
- 12.1.10 Enexio Management Gmbh
- 12.1.10.1. Company Overview
- 12.1.10.2. Products
- 12.1.10.3. Company Financials
- 12.1.10.4. SWOT Analysis
- 12.1.1 Brentwood Industries Inc
- 12.2. Market Entropy
- 12.2.1 Company's Key Areas Served
- 12.2.2 Recent Developments
- 12.3. Company Market Share Analysis 2025
- 12.3.1 Top 5 Companies Market Share Analysis
- 12.3.2 Top 3 Companies Market Share Analysis
- 12.4. List of Potential Customers
- 13. Research Methodology
List of Figures
- Figure 1: Global Cooling Tower Market Revenue Breakdown (billion, %) by Region 2025 & 2033
- Figure 2: Global Cooling Tower Market Volume Breakdown (K Unit, %) by Region 2025 & 2033
- Figure 3: North America Cooling Tower Market Revenue (billion), by Application 2025 & 2033
- Figure 4: North America Cooling Tower Market Volume (K Unit), by Application 2025 & 2033
- Figure 5: North America Cooling Tower Market Revenue Share (%), by Application 2025 & 2033
- Figure 6: North America Cooling Tower Market Volume Share (%), by Application 2025 & 2033
- Figure 7: North America Cooling Tower Market Revenue (billion), by Flow Type 2025 & 2033
- Figure 8: North America Cooling Tower Market Volume (K Unit), by Flow Type 2025 & 2033
- Figure 9: North America Cooling Tower Market Revenue Share (%), by Flow Type 2025 & 2033
- Figure 10: North America Cooling Tower Market Volume Share (%), by Flow Type 2025 & 2033
- Figure 11: North America Cooling Tower Market Revenue (billion), by Type 2025 & 2033
- Figure 12: North America Cooling Tower Market Volume (K Unit), by Type 2025 & 2033
- Figure 13: North America Cooling Tower Market Revenue Share (%), by Type 2025 & 2033
- Figure 14: North America Cooling Tower Market Volume Share (%), by Type 2025 & 2033
- Figure 15: North America Cooling Tower Market Revenue (billion), by Country 2025 & 2033
- Figure 16: North America Cooling Tower Market Volume (K Unit), by Country 2025 & 2033
- Figure 17: North America Cooling Tower Market Revenue Share (%), by Country 2025 & 2033
- Figure 18: North America Cooling Tower Market Volume Share (%), by Country 2025 & 2033
- Figure 19: Europe Cooling Tower Market Revenue (billion), by Application 2025 & 2033
- Figure 20: Europe Cooling Tower Market Volume (K Unit), by Application 2025 & 2033
- Figure 21: Europe Cooling Tower Market Revenue Share (%), by Application 2025 & 2033
- Figure 22: Europe Cooling Tower Market Volume Share (%), by Application 2025 & 2033
- Figure 23: Europe Cooling Tower Market Revenue (billion), by Flow Type 2025 & 2033
- Figure 24: Europe Cooling Tower Market Volume (K Unit), by Flow Type 2025 & 2033
- Figure 25: Europe Cooling Tower Market Revenue Share (%), by Flow Type 2025 & 2033
- Figure 26: Europe Cooling Tower Market Volume Share (%), by Flow Type 2025 & 2033
- Figure 27: Europe Cooling Tower Market Revenue (billion), by Type 2025 & 2033
- Figure 28: Europe Cooling Tower Market Volume (K Unit), by Type 2025 & 2033
- Figure 29: Europe Cooling Tower Market Revenue Share (%), by Type 2025 & 2033
- Figure 30: Europe Cooling Tower Market Volume Share (%), by Type 2025 & 2033
- Figure 31: Europe Cooling Tower Market Revenue (billion), by Country 2025 & 2033
- Figure 32: Europe Cooling Tower Market Volume (K Unit), by Country 2025 & 2033
- Figure 33: Europe Cooling Tower Market Revenue Share (%), by Country 2025 & 2033
- Figure 34: Europe Cooling Tower Market Volume Share (%), by Country 2025 & 2033
- Figure 35: Asia Pacific Cooling Tower Market Revenue (billion), by Application 2025 & 2033
- Figure 36: Asia Pacific Cooling Tower Market Volume (K Unit), by Application 2025 & 2033
- Figure 37: Asia Pacific Cooling Tower Market Revenue Share (%), by Application 2025 & 2033
- Figure 38: Asia Pacific Cooling Tower Market Volume Share (%), by Application 2025 & 2033
- Figure 39: Asia Pacific Cooling Tower Market Revenue (billion), by Flow Type 2025 & 2033
- Figure 40: Asia Pacific Cooling Tower Market Volume (K Unit), by Flow Type 2025 & 2033
- Figure 41: Asia Pacific Cooling Tower Market Revenue Share (%), by Flow Type 2025 & 2033
- Figure 42: Asia Pacific Cooling Tower Market Volume Share (%), by Flow Type 2025 & 2033
- Figure 43: Asia Pacific Cooling Tower Market Revenue (billion), by Type 2025 & 2033
- Figure 44: Asia Pacific Cooling Tower Market Volume (K Unit), by Type 2025 & 2033
- Figure 45: Asia Pacific Cooling Tower Market Revenue Share (%), by Type 2025 & 2033
- Figure 46: Asia Pacific Cooling Tower Market Volume Share (%), by Type 2025 & 2033
- Figure 47: Asia Pacific Cooling Tower Market Revenue (billion), by Country 2025 & 2033
- Figure 48: Asia Pacific Cooling Tower Market Volume (K Unit), by Country 2025 & 2033
- Figure 49: Asia Pacific Cooling Tower Market Revenue Share (%), by Country 2025 & 2033
- Figure 50: Asia Pacific Cooling Tower Market Volume Share (%), by Country 2025 & 2033
- Figure 51: Middle East and Africa Cooling Tower Market Revenue (billion), by Application 2025 & 2033
- Figure 52: Middle East and Africa Cooling Tower Market Volume (K Unit), by Application 2025 & 2033
- Figure 53: Middle East and Africa Cooling Tower Market Revenue Share (%), by Application 2025 & 2033
- Figure 54: Middle East and Africa Cooling Tower Market Volume Share (%), by Application 2025 & 2033
- Figure 55: Middle East and Africa Cooling Tower Market Revenue (billion), by Flow Type 2025 & 2033
- Figure 56: Middle East and Africa Cooling Tower Market Volume (K Unit), by Flow Type 2025 & 2033
- Figure 57: Middle East and Africa Cooling Tower Market Revenue Share (%), by Flow Type 2025 & 2033
- Figure 58: Middle East and Africa Cooling Tower Market Volume Share (%), by Flow Type 2025 & 2033
- Figure 59: Middle East and Africa Cooling Tower Market Revenue (billion), by Type 2025 & 2033
- Figure 60: Middle East and Africa Cooling Tower Market Volume (K Unit), by Type 2025 & 2033
- Figure 61: Middle East and Africa Cooling Tower Market Revenue Share (%), by Type 2025 & 2033
- Figure 62: Middle East and Africa Cooling Tower Market Volume Share (%), by Type 2025 & 2033
- Figure 63: Middle East and Africa Cooling Tower Market Revenue (billion), by Country 2025 & 2033
- Figure 64: Middle East and Africa Cooling Tower Market Volume (K Unit), by Country 2025 & 2033
- Figure 65: Middle East and Africa Cooling Tower Market Revenue Share (%), by Country 2025 & 2033
- Figure 66: Middle East and Africa Cooling Tower Market Volume Share (%), by Country 2025 & 2033
- Figure 67: South America Cooling Tower Market Revenue (billion), by Application 2025 & 2033
- Figure 68: South America Cooling Tower Market Volume (K Unit), by Application 2025 & 2033
- Figure 69: South America Cooling Tower Market Revenue Share (%), by Application 2025 & 2033
- Figure 70: South America Cooling Tower Market Volume Share (%), by Application 2025 & 2033
- Figure 71: South America Cooling Tower Market Revenue (billion), by Flow Type 2025 & 2033
- Figure 72: South America Cooling Tower Market Volume (K Unit), by Flow Type 2025 & 2033
- Figure 73: South America Cooling Tower Market Revenue Share (%), by Flow Type 2025 & 2033
- Figure 74: South America Cooling Tower Market Volume Share (%), by Flow Type 2025 & 2033
- Figure 75: South America Cooling Tower Market Revenue (billion), by Type 2025 & 2033
- Figure 76: South America Cooling Tower Market Volume (K Unit), by Type 2025 & 2033
- Figure 77: South America Cooling Tower Market Revenue Share (%), by Type 2025 & 2033
- Figure 78: South America Cooling Tower Market Volume Share (%), by Type 2025 & 2033
- Figure 79: South America Cooling Tower Market Revenue (billion), by Country 2025 & 2033
- Figure 80: South America Cooling Tower Market Volume (K Unit), by Country 2025 & 2033
- Figure 81: South America Cooling Tower Market Revenue Share (%), by Country 2025 & 2033
- Figure 82: South America Cooling Tower Market Volume Share (%), by Country 2025 & 2033
List of Tables
- Table 1: Global Cooling Tower Market Revenue billion Forecast, by Application 2020 & 2033
- Table 2: Global Cooling Tower Market Volume K Unit Forecast, by Application 2020 & 2033
- Table 3: Global Cooling Tower Market Revenue billion Forecast, by Flow Type 2020 & 2033
- Table 4: Global Cooling Tower Market Volume K Unit Forecast, by Flow Type 2020 & 2033
- Table 5: Global Cooling Tower Market Revenue billion Forecast, by Type 2020 & 2033
- Table 6: Global Cooling Tower Market Volume K Unit Forecast, by Type 2020 & 2033
- Table 7: Global Cooling Tower Market Revenue billion Forecast, by Region 2020 & 2033
- Table 8: Global Cooling Tower Market Volume K Unit Forecast, by Region 2020 & 2033
- Table 9: Global Cooling Tower Market Revenue billion Forecast, by Application 2020 & 2033
- Table 10: Global Cooling Tower Market Volume K Unit Forecast, by Application 2020 & 2033
- Table 11: Global Cooling Tower Market Revenue billion Forecast, by Flow Type 2020 & 2033
- Table 12: Global Cooling Tower Market Volume K Unit Forecast, by Flow Type 2020 & 2033
- Table 13: Global Cooling Tower Market Revenue billion Forecast, by Type 2020 & 2033
- Table 14: Global Cooling Tower Market Volume K Unit Forecast, by Type 2020 & 2033
- Table 15: Global Cooling Tower Market Revenue billion Forecast, by Country 2020 & 2033
- Table 16: Global Cooling Tower Market Volume K Unit Forecast, by Country 2020 & 2033
- Table 17: United States Cooling Tower Market Revenue (billion) Forecast, by Application 2020 & 2033
- Table 18: United States Cooling Tower Market Volume (K Unit) Forecast, by Application 2020 & 2033
- Table 19: Canada Cooling Tower Market Revenue (billion) Forecast, by Application 2020 & 2033
- Table 20: Canada Cooling Tower Market Volume (K Unit) Forecast, by Application 2020 & 2033
- Table 21: Rest of North America Cooling Tower Market Revenue (billion) Forecast, by Application 2020 & 2033
- Table 22: Rest of North America Cooling Tower Market Volume (K Unit) Forecast, by Application 2020 & 2033
- Table 23: Global Cooling Tower Market Revenue billion Forecast, by Application 2020 & 2033
- Table 24: Global Cooling Tower Market Volume K Unit Forecast, by Application 2020 & 2033
- Table 25: Global Cooling Tower Market Revenue billion Forecast, by Flow Type 2020 & 2033
- Table 26: Global Cooling Tower Market Volume K Unit Forecast, by Flow Type 2020 & 2033
- Table 27: Global Cooling Tower Market Revenue billion Forecast, by Type 2020 & 2033
- Table 28: Global Cooling Tower Market Volume K Unit Forecast, by Type 2020 & 2033
- Table 29: Global Cooling Tower Market Revenue billion Forecast, by Country 2020 & 2033
- Table 30: Global Cooling Tower Market Volume K Unit Forecast, by Country 2020 & 2033
- Table 31: Germany Cooling Tower Market Revenue (billion) Forecast, by Application 2020 & 2033
- Table 32: Germany Cooling Tower Market Volume (K Unit) Forecast, by Application 2020 & 2033
- Table 33: France Cooling Tower Market Revenue (billion) Forecast, by Application 2020 & 2033
- Table 34: France Cooling Tower Market Volume (K Unit) Forecast, by Application 2020 & 2033
- Table 35: United Kingdom Cooling Tower Market Revenue (billion) Forecast, by Application 2020 & 2033
- Table 36: United Kingdom Cooling Tower Market Volume (K Unit) Forecast, by Application 2020 & 2033
- Table 37: Russia Cooling Tower Market Revenue (billion) Forecast, by Application 2020 & 2033
- Table 38: Russia Cooling Tower Market Volume (K Unit) Forecast, by Application 2020 & 2033
- Table 39: Rest of Europe Cooling Tower Market Revenue (billion) Forecast, by Application 2020 & 2033
- Table 40: Rest of Europe Cooling Tower Market Volume (K Unit) Forecast, by Application 2020 & 2033
- Table 41: Global Cooling Tower Market Revenue billion Forecast, by Application 2020 & 2033
- Table 42: Global Cooling Tower Market Volume K Unit Forecast, by Application 2020 & 2033
- Table 43: Global Cooling Tower Market Revenue billion Forecast, by Flow Type 2020 & 2033
- Table 44: Global Cooling Tower Market Volume K Unit Forecast, by Flow Type 2020 & 2033
- Table 45: Global Cooling Tower Market Revenue billion Forecast, by Type 2020 & 2033
- Table 46: Global Cooling Tower Market Volume K Unit Forecast, by Type 2020 & 2033
- Table 47: Global Cooling Tower Market Revenue billion Forecast, by Country 2020 & 2033
- Table 48: Global Cooling Tower Market Volume K Unit Forecast, by Country 2020 & 2033
- Table 49: China Cooling Tower Market Revenue (billion) Forecast, by Application 2020 & 2033
- Table 50: China Cooling Tower Market Volume (K Unit) Forecast, by Application 2020 & 2033
- Table 51: India Cooling Tower Market Revenue (billion) Forecast, by Application 2020 & 2033
- Table 52: India Cooling Tower Market Volume (K Unit) Forecast, by Application 2020 & 2033
- Table 53: Australia Cooling Tower Market Revenue (billion) Forecast, by Application 2020 & 2033
- Table 54: Australia Cooling Tower Market Volume (K Unit) Forecast, by Application 2020 & 2033
- Table 55: Malaysia Cooling Tower Market Revenue (billion) Forecast, by Application 2020 & 2033
- Table 56: Malaysia Cooling Tower Market Volume (K Unit) Forecast, by Application 2020 & 2033
- Table 57: Rest of Asia Pacific Cooling Tower Market Revenue (billion) Forecast, by Application 2020 & 2033
- Table 58: Rest of Asia Pacific Cooling Tower Market Volume (K Unit) Forecast, by Application 2020 & 2033
- Table 59: Global Cooling Tower Market Revenue billion Forecast, by Application 2020 & 2033
- Table 60: Global Cooling Tower Market Volume K Unit Forecast, by Application 2020 & 2033
- Table 61: Global Cooling Tower Market Revenue billion Forecast, by Flow Type 2020 & 2033
- Table 62: Global Cooling Tower Market Volume K Unit Forecast, by Flow Type 2020 & 2033
- Table 63: Global Cooling Tower Market Revenue billion Forecast, by Type 2020 & 2033
- Table 64: Global Cooling Tower Market Volume K Unit Forecast, by Type 2020 & 2033
- Table 65: Global Cooling Tower Market Revenue billion Forecast, by Country 2020 & 2033
- Table 66: Global Cooling Tower Market Volume K Unit Forecast, by Country 2020 & 2033
- Table 67: Saudi Arabia Cooling Tower Market Revenue (billion) Forecast, by Application 2020 & 2033
- Table 68: Saudi Arabia Cooling Tower Market Volume (K Unit) Forecast, by Application 2020 & 2033
- Table 69: United Arab Emirates Cooling Tower Market Revenue (billion) Forecast, by Application 2020 & 2033
- Table 70: United Arab Emirates Cooling Tower Market Volume (K Unit) Forecast, by Application 2020 & 2033
- Table 71: Nigeria Cooling Tower Market Revenue (billion) Forecast, by Application 2020 & 2033
- Table 72: Nigeria Cooling Tower Market Volume (K Unit) Forecast, by Application 2020 & 2033
- Table 73: Rest of Middle East and Africa Cooling Tower Market Revenue (billion) Forecast, by Application 2020 & 2033
- Table 74: Rest of Middle East and Africa Cooling Tower Market Volume (K Unit) Forecast, by Application 2020 & 2033
- Table 75: Global Cooling Tower Market Revenue billion Forecast, by Application 2020 & 2033
- Table 76: Global Cooling Tower Market Volume K Unit Forecast, by Application 2020 & 2033
- Table 77: Global Cooling Tower Market Revenue billion Forecast, by Flow Type 2020 & 2033
- Table 78: Global Cooling Tower Market Volume K Unit Forecast, by Flow Type 2020 & 2033
- Table 79: Global Cooling Tower Market Revenue billion Forecast, by Type 2020 & 2033
- Table 80: Global Cooling Tower Market Volume K Unit Forecast, by Type 2020 & 2033
- Table 81: Global Cooling Tower Market Revenue billion Forecast, by Country 2020 & 2033
- Table 82: Global Cooling Tower Market Volume K Unit Forecast, by Country 2020 & 2033
- Table 83: Brazil Cooling Tower Market Revenue (billion) Forecast, by Application 2020 & 2033
- Table 84: Brazil Cooling Tower Market Volume (K Unit) Forecast, by Application 2020 & 2033
- Table 85: Argentina Cooling Tower Market Revenue (billion) Forecast, by Application 2020 & 2033
- Table 86: Argentina Cooling Tower Market Volume (K Unit) Forecast, by Application 2020 & 2033
- Table 87: Columbia Cooling Tower Market Revenue (billion) Forecast, by Application 2020 & 2033
- Table 88: Columbia Cooling Tower Market Volume (K Unit) Forecast, by Application 2020 & 2033
- Table 89: Rest of South America Cooling Tower Market Revenue (billion) Forecast, by Application 2020 & 2033
- Table 90: Rest of South America Cooling Tower Market Volume (K Unit) Forecast, by Application 2020 & 2033
Frequently Asked Questions
1. What is the projected Compound Annual Growth Rate (CAGR) of the Cooling Tower Market?
The projected CAGR is approximately 5.1%.
2. Which companies are prominent players in the Cooling Tower Market?
Key companies in the market include Brentwood Industries Inc, Babcock and Wilcox Enterprises Inc, Johnson Control, Evapco Inc, Baltimore Aircoil Company Inc, Artech Cooling Towers Pvt Ltd, SPX Cooling Tech LLC, Hamon and CIE, Thermax Limited*List Not Exhaustive, Enexio Management Gmbh.
3. What are the main segments of the Cooling Tower Market?
The market segments include Application, Flow Type, Type.
4. Can you provide details about the market size?
The market size is estimated to be USD 4.4 billion as of 2022.
5. What are some drivers contributing to market growth?
4.; Falling Costs of Green And Blue Hydrogen Generation4.; Rising Demand from The Automotive Sector.
6. What are the notable trends driving market growth?
Power Generation Expected to Witness Growth.
7. Are there any restraints impacting market growth?
4.; Competition for Alternative Energy Source.
8. Can you provide examples of recent developments in the market?
In February 2023, Baltimore Aircoil Company (BAC) revealed its new TrilliumSeries Adiabatic Cooler. This adiabatic cooling Tower is ideal for energy efficiency and limited water use applications. The design maximizes both water and energy efficiency, ultimately minimizing costs. In addition, the TrilliumSeries Cooler is designed to make installation and ongoing maintenance simple.
9. What pricing options are available for accessing the report?
Pricing options include single-user, multi-user, and enterprise licenses priced at USD 4750, USD 5250, and USD 8750 respectively.
10. Is the market size provided in terms of value or volume?
The market size is provided in terms of value, measured in billion and volume, measured in K Unit.
11. Are there any specific market keywords associated with the report?
Yes, the market keyword associated with the report is "Cooling Tower Market," which aids in identifying and referencing the specific market segment covered.
12. How do I determine which pricing option suits my needs best?
The pricing options vary based on user requirements and access needs. Individual users may opt for single-user licenses, while businesses requiring broader access may choose multi-user or enterprise licenses for cost-effective access to the report.
13. Are there any additional resources or data provided in the Cooling Tower Market report?
While the report offers comprehensive insights, it's advisable to review the specific contents or supplementary materials provided to ascertain if additional resources or data are available.
14. How can I stay updated on further developments or reports in the Cooling Tower Market?
To stay informed about further developments, trends, and reports in the Cooling Tower Market, consider subscribing to industry newsletters, following relevant companies and organizations, or regularly checking reputable industry news sources and publications.
Methodology
Step 1 - Identification of Relevant Samples Size from Population Database


Step 2 - Approaches for Defining Global Market Size (Value, Volume* & Price*)

Note*: In applicable scenarios
Step 3 - Data Sources
Primary Research
- Web Analytics
- Survey Reports
- Research Institute
- Latest Research Reports
- Opinion Leaders
Secondary Research
- Annual Reports
- White Paper
- Latest Press Release
- Industry Association
- Paid Database
- Investor Presentations

Step 4 - Data Triangulation
Involves using different sources of information in order to increase the validity of a study
These sources are likely to be stakeholders in a program - participants, other researchers, program staff, other community members, and so on.
Then we put all data in single framework & apply various statistical tools to find out the dynamic on the market.
During the analysis stage, feedback from the stakeholder groups would be compared to determine areas of agreement as well as areas of divergence

