
Key Insights
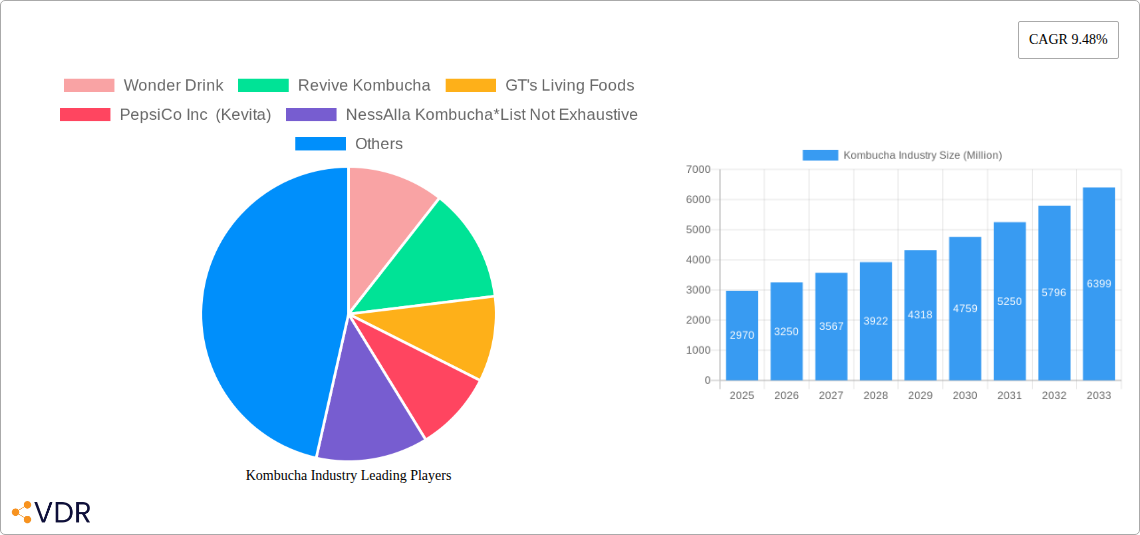
The global kombucha market, valued at $2.97 billion in 2025, is experiencing robust growth, projected to expand at a CAGR of 9.48% from 2025 to 2033. This expansion is fueled by several key drivers. The rising consumer awareness of health and wellness, coupled with the increasing demand for functional beverages with probiotic benefits, is a significant factor. Kombucha's naturally fermented nature and perceived health advantages, such as improved gut health and boosted immunity, resonate strongly with health-conscious consumers. Furthermore, the burgeoning popularity of vegan and plant-based diets is indirectly contributing to kombucha's growth, as it aligns with these lifestyle choices. Product innovation, including the introduction of diverse flavors and convenient packaging formats (e.g., ready-to-drink bottles), is also playing a crucial role in broadening the appeal of kombucha beyond its core consumer base. The shift towards online retail channels provides further accessibility and market expansion opportunities for kombucha brands.
However, certain challenges remain. The relatively higher price point of kombucha compared to other beverages can be a barrier to entry for price-sensitive consumers. Ensuring consistent quality and taste across different batches, and managing consumer perception related to the sometimes-strong, acquired taste of traditional kombucha, are further considerations for market players. Effective marketing and education initiatives are therefore necessary to overcome these barriers and further stimulate market growth. The competitive landscape is also becoming increasingly crowded, with established players alongside new entrants constantly striving for market share. Successful brands will need to differentiate themselves through strong branding, targeted marketing, and continuous product innovation to maintain their position in this dynamic and evolving market.
Kombucha Industry Market Report: 2019-2033
This comprehensive report provides an in-depth analysis of the Kombucha industry, encompassing market dynamics, growth trends, competitive landscape, and future outlook. The study period covers 2019-2033, with 2025 as the base and estimated year. The report offers crucial insights for industry professionals, investors, and stakeholders seeking to navigate this dynamic market. The report segments the market by Type (Original/Regular, Flavored) and Distribution Channel (Supermarkets/Hypermarkets, Specialist Stores, Convenience Stores, Online Retailers, Other Distribution Channels) to provide a granular understanding of market behavior.
Kombucha Industry Market Dynamics & Structure
The Kombucha market, valued at xx Million units in 2024, exhibits a moderately fragmented structure. While key players like GT's Living Foods, PepsiCo Inc (Kevita), and Health-Ade hold significant market share, numerous smaller players and regional brands contribute to the overall market dynamics. Technological innovation, particularly in fermentation techniques and flavor development, is a significant growth driver. However, regulatory frameworks concerning labeling and production processes present both challenges and opportunities for innovation. The market is witnessing increased competition from functional beverages, including sparkling water and herbal infusions.
- Market Concentration: Moderately fragmented, with a few major players and numerous smaller companies.
- Technological Innovation: Focus on improved fermentation processes, flavor profiles, and packaging solutions.
- Regulatory Framework: Varying regulations across different regions regarding labeling, health claims, and production standards.
- Competitive Substitutes: Sparkling water, herbal infusions, and other functional beverages.
- End-User Demographics: Primarily health-conscious millennials and Gen Z consumers, but expanding into broader demographics.
- M&A Trends: A moderate level of M&A activity, with larger players acquiring smaller brands to expand their product portfolios and market reach. The volume of M&A deals is estimated at xx in the past five years.
Kombucha Industry Growth Trends & Insights
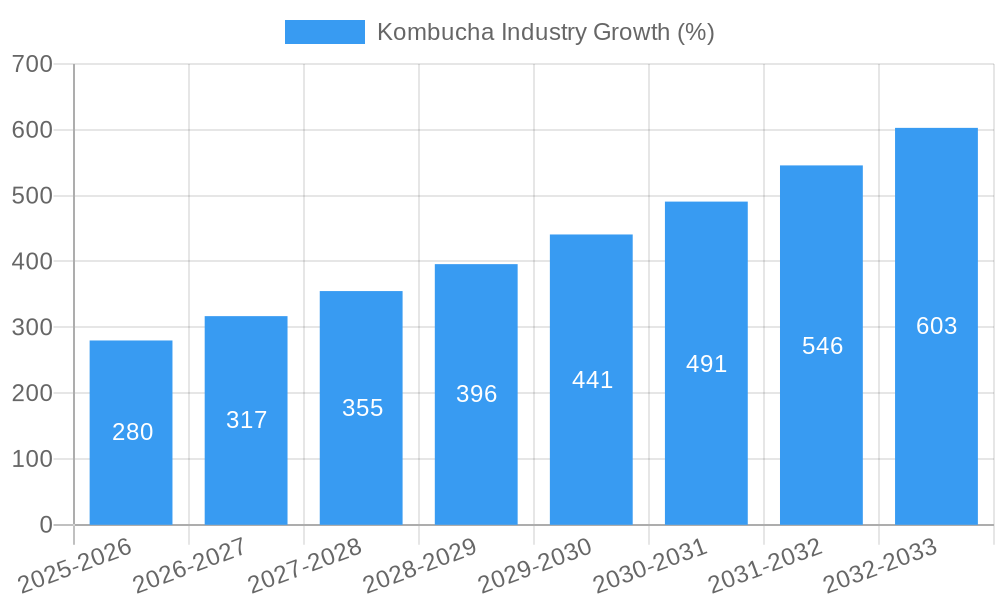
The global Kombucha market is experiencing robust growth, driven by increasing consumer demand for healthier and functional beverages. The market size is projected to reach xx Million units by 2033, exhibiting a CAGR of xx% during the forecast period (2025-2033). This growth is fueled by rising health consciousness, increased disposable incomes, and changing consumer preferences towards natural and organic products. The adoption rate of Kombucha is particularly high among millennials and Gen Z, who are more likely to seek out healthier alternatives to traditional sugary drinks. Technological advancements are also playing a pivotal role, enhancing production efficiency and expanding flavor options. Shifts in consumer behavior, such as increased demand for convenience and online purchasing, are creating new growth opportunities in the market. This market growth is further fueled by the introduction of innovative formats, such as ready-to-drink Kombucha and instant Kombucha mixes.
Dominant Regions, Countries, or Segments in Kombucha Industry
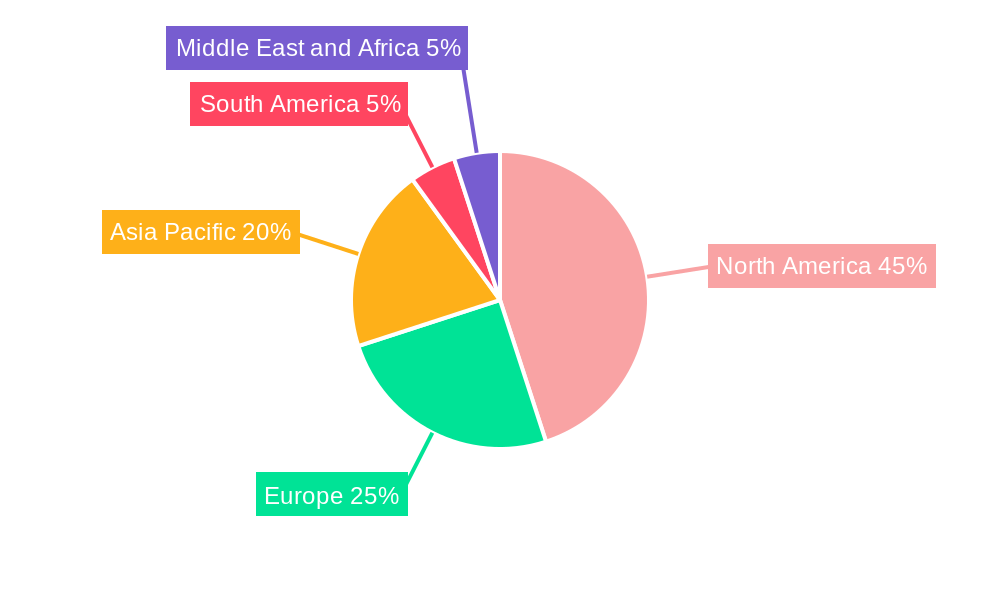
North America currently dominates the global Kombucha market, driven by high consumer awareness, strong brand presence, and established distribution networks. Within North America, the U.S. holds the largest market share. Europe follows as a significant market, demonstrating robust growth potential due to rising health consciousness and increasing adoption rates. The Flavored segment holds the largest market share within the By Type category, owing to its diverse taste profiles and broader consumer appeal. Within the distribution channel segment, Supermarkets/Hypermarkets represent the leading channel, followed by Specialist Stores, reflecting Kombucha’s growing mainstream presence.
- Key Drivers (North America): High consumer health awareness, established distribution channels, strong brand presence.
- Key Drivers (Europe): Increasing health consciousness, rising disposable incomes, growing adoption of healthier beverage options.
- Flavored Segment Dominance: Wide variety of flavor profiles cater to diverse consumer preferences.
- Supermarkets/Hypermarkets: Convenient access and wide reach contribute to significant market share.
Kombucha Industry Product Landscape
The Kombucha market features a diverse range of products, encompassing traditional and flavored varieties. Product innovation focuses on enhancing taste profiles, introducing functional ingredients, and exploring new packaging formats such as cans and smaller bottles for convenience. The key selling propositions focus on health benefits (probiotics, antioxidants), natural ingredients, and diverse flavor options. Recent innovations include the launch of ready-to-drink Kombucha and instant Kombucha formulas, which cater to the demand for convenience and ease of consumption.
Key Drivers, Barriers & Challenges in Kombucha Industry
Key Drivers:
- Rising health consciousness and increasing demand for functional beverages.
- Growing popularity of natural and organic products.
- Expanding distribution channels and increased market penetration.
- Technological advancements in production and packaging.
Key Challenges:
- Competition from other functional beverages and soft drinks.
- Maintaining consistent product quality and taste.
- High production costs and the need for specialized equipment.
- Regulatory hurdles and labeling requirements vary across regions. The impact of these hurdles has led to a xx% reduction in new product launches compared to initial estimations.
Emerging Opportunities in Kombucha Industry
- Expanding into new markets in Asia and Latin America.
- Developing innovative flavor profiles and functional ingredients.
- Exploring new packaging options and formats (e.g., single-serve pouches, concentrates).
- Collaborating with food and beverage companies to create co-branded products.
Growth Accelerators in the Kombucha Industry
The long-term growth of the Kombucha market hinges on several factors, including technological advancements to enhance production efficiency and reduce costs, strategic partnerships with food and beverage companies to expand distribution and reach new consumer segments, successful marketing strategies to build brand awareness and loyalty, and successful expansion into new and underserved markets, both domestically and internationally.
Key Players Shaping the Kombucha Industry Market
- Wonder Drink
- Revive Kombucha
- GT's Living Foods
- PepsiCo Inc (Kevita)
- NessAlla Kombucha
- Brew Dr Kombucha
- Makana Beverages Inc
- Hain Celestial
- Humm Kombucha LLC
- Health-Ade
Notable Milestones in Kombucha Industry Sector
- February 2022: Brew Dr. launched "Just Peachy," a peach-flavored kombucha.
- February 2022: Superfoods Company launched an "instant kombucha" formula.
- March 2021: Health-Ade Kombucha launched Health-Ade Mixers, kombucha-based cocktail bases.
In-Depth Kombucha Industry Market Outlook
The Kombucha market is poised for sustained growth over the next decade, fueled by continued expansion into new markets and product diversification. The development of innovative products, strategic alliances, and effective marketing strategies will play a pivotal role in shaping the market landscape and unlocking significant opportunities for both established and emerging players. The focus on health and wellness will continue to drive consumer demand.
Kombucha Industry Segmentation
-
1. Type
- 1.1. Original/Regular
- 1.2. Flavored
-
2. Distribution Channel
- 2.1. Supermarkets/Hypermarkets
- 2.2. Specialist Stores
- 2.3. Convenience Stores
- 2.4. Online Retailers
- 2.5. Other Distribution Channel
Kombucha Industry Segmentation By Geography
-
1. North America
- 1.1. United States
- 1.2. Canada
- 1.3. Mexico
- 1.4. Rest of North America
-
2. Europe
- 2.1. Spain
- 2.2. United Kingdom
- 2.3. Germany
- 2.4. France
- 2.5. Italy
- 2.6. Russia
- 2.7. Rest of Europe
-
3. Asia Pacific
- 3.1. China
- 3.2. Japan
- 3.3. India
- 3.4. Australia
- 3.5. Rest of Asia Pacific
-
4. South America
- 4.1. Brazil
- 4.2. Argentina
- 4.3. Rest of South America
-
5. Middle East and Africa
- 5.1. South Africa
- 5.2. Saudi Arabia
- 5.3. Rest of Middle East and Africa
Kombucha Industry REPORT HIGHLIGHTS
| Aspects | Details |
|---|---|
| Study Period | 2019-2033 |
| Base Year | 2024 |
| Estimated Year | 2025 |
| Forecast Period | 2025-2033 |
| Historical Period | 2019-2024 |
| Growth Rate | CAGR of 9.48% from 2019-2033 |
| Segmentation |
|
Table of Contents
- 1. Introduction
- 1.1. Research Scope
- 1.2. Market Segmentation
- 1.3. Research Methodology
- 1.4. Definitions and Assumptions
- 2. Executive Summary
- 2.1. Introduction
- 3. Market Dynamics
- 3.1. Introduction
- 3.2. Market Drivers
- 3.2.1. Increasing application of Gelatin in healthcare and pharmaceutical sector
- 3.3. Market Restrains
- 3.3.1. Rising demand for clean label products
- 3.4. Market Trends
- 3.4.1. Rising Health Awareness Among Consumers
- 4. Market Factor Analysis
- 4.1. Porters Five Forces
- 4.2. Supply/Value Chain
- 4.3. PESTEL analysis
- 4.4. Market Entropy
- 4.5. Patent/Trademark Analysis
- 5. Global Kombucha Industry Analysis, Insights and Forecast, 2019-2031
- 5.1. Market Analysis, Insights and Forecast - by Type
- 5.1.1. Original/Regular
- 5.1.2. Flavored
- 5.2. Market Analysis, Insights and Forecast - by Distribution Channel
- 5.2.1. Supermarkets/Hypermarkets
- 5.2.2. Specialist Stores
- 5.2.3. Convenience Stores
- 5.2.4. Online Retailers
- 5.2.5. Other Distribution Channel
- 5.3. Market Analysis, Insights and Forecast - by Region
- 5.3.1. North America
- 5.3.2. Europe
- 5.3.3. Asia Pacific
- 5.3.4. South America
- 5.3.5. Middle East and Africa
- 5.1. Market Analysis, Insights and Forecast - by Type
- 6. North America Kombucha Industry Analysis, Insights and Forecast, 2019-2031
- 6.1. Market Analysis, Insights and Forecast - by Type
- 6.1.1. Original/Regular
- 6.1.2. Flavored
- 6.2. Market Analysis, Insights and Forecast - by Distribution Channel
- 6.2.1. Supermarkets/Hypermarkets
- 6.2.2. Specialist Stores
- 6.2.3. Convenience Stores
- 6.2.4. Online Retailers
- 6.2.5. Other Distribution Channel
- 6.1. Market Analysis, Insights and Forecast - by Type
- 7. Europe Kombucha Industry Analysis, Insights and Forecast, 2019-2031
- 7.1. Market Analysis, Insights and Forecast - by Type
- 7.1.1. Original/Regular
- 7.1.2. Flavored
- 7.2. Market Analysis, Insights and Forecast - by Distribution Channel
- 7.2.1. Supermarkets/Hypermarkets
- 7.2.2. Specialist Stores
- 7.2.3. Convenience Stores
- 7.2.4. Online Retailers
- 7.2.5. Other Distribution Channel
- 7.1. Market Analysis, Insights and Forecast - by Type
- 8. Asia Pacific Kombucha Industry Analysis, Insights and Forecast, 2019-2031
- 8.1. Market Analysis, Insights and Forecast - by Type
- 8.1.1. Original/Regular
- 8.1.2. Flavored
- 8.2. Market Analysis, Insights and Forecast - by Distribution Channel
- 8.2.1. Supermarkets/Hypermarkets
- 8.2.2. Specialist Stores
- 8.2.3. Convenience Stores
- 8.2.4. Online Retailers
- 8.2.5. Other Distribution Channel
- 8.1. Market Analysis, Insights and Forecast - by Type
- 9. South America Kombucha Industry Analysis, Insights and Forecast, 2019-2031
- 9.1. Market Analysis, Insights and Forecast - by Type
- 9.1.1. Original/Regular
- 9.1.2. Flavored
- 9.2. Market Analysis, Insights and Forecast - by Distribution Channel
- 9.2.1. Supermarkets/Hypermarkets
- 9.2.2. Specialist Stores
- 9.2.3. Convenience Stores
- 9.2.4. Online Retailers
- 9.2.5. Other Distribution Channel
- 9.1. Market Analysis, Insights and Forecast - by Type
- 10. Middle East and Africa Kombucha Industry Analysis, Insights and Forecast, 2019-2031
- 10.1. Market Analysis, Insights and Forecast - by Type
- 10.1.1. Original/Regular
- 10.1.2. Flavored
- 10.2. Market Analysis, Insights and Forecast - by Distribution Channel
- 10.2.1. Supermarkets/Hypermarkets
- 10.2.2. Specialist Stores
- 10.2.3. Convenience Stores
- 10.2.4. Online Retailers
- 10.2.5. Other Distribution Channel
- 10.1. Market Analysis, Insights and Forecast - by Type
- 11. North America Kombucha Industry Analysis, Insights and Forecast, 2019-2031
- 11.1. Market Analysis, Insights and Forecast - By Country/Sub-region
- 11.1.1 United States
- 11.1.2 Canada
- 11.1.3 Mexico
- 11.1.4 Rest of North America
- 12. Europe Kombucha Industry Analysis, Insights and Forecast, 2019-2031
- 12.1. Market Analysis, Insights and Forecast - By Country/Sub-region
- 12.1.1 Spain
- 12.1.2 United Kingdom
- 12.1.3 Germany
- 12.1.4 France
- 12.1.5 Italy
- 12.1.6 Russia
- 12.1.7 Rest of Europe
- 13. Asia Pacific Kombucha Industry Analysis, Insights and Forecast, 2019-2031
- 13.1. Market Analysis, Insights and Forecast - By Country/Sub-region
- 13.1.1 China
- 13.1.2 Japan
- 13.1.3 India
- 13.1.4 Australia
- 13.1.5 Rest of Asia Pacific
- 14. South America Kombucha Industry Analysis, Insights and Forecast, 2019-2031
- 14.1. Market Analysis, Insights and Forecast - By Country/Sub-region
- 14.1.1 Brazil
- 14.1.2 Argentina
- 14.1.3 Rest of South America
- 15. Middle East and Africa Kombucha Industry Analysis, Insights and Forecast, 2019-2031
- 15.1. Market Analysis, Insights and Forecast - By Country/Sub-region
- 15.1.1 South Africa
- 15.1.2 Saudi Arabia
- 15.1.3 Rest of Middle East and Africa
- 16. Competitive Analysis
- 16.1. Global Market Share Analysis 2024
- 16.2. Company Profiles
- 16.2.1 Wonder Drink
- 16.2.1.1. Overview
- 16.2.1.2. Products
- 16.2.1.3. SWOT Analysis
- 16.2.1.4. Recent Developments
- 16.2.1.5. Financials (Based on Availability)
- 16.2.2 Revive Kombucha
- 16.2.2.1. Overview
- 16.2.2.2. Products
- 16.2.2.3. SWOT Analysis
- 16.2.2.4. Recent Developments
- 16.2.2.5. Financials (Based on Availability)
- 16.2.3 GT's Living Foods
- 16.2.3.1. Overview
- 16.2.3.2. Products
- 16.2.3.3. SWOT Analysis
- 16.2.3.4. Recent Developments
- 16.2.3.5. Financials (Based on Availability)
- 16.2.4 PepsiCo Inc (Kevita)
- 16.2.4.1. Overview
- 16.2.4.2. Products
- 16.2.4.3. SWOT Analysis
- 16.2.4.4. Recent Developments
- 16.2.4.5. Financials (Based on Availability)
- 16.2.5 NessAlla Kombucha*List Not Exhaustive
- 16.2.5.1. Overview
- 16.2.5.2. Products
- 16.2.5.3. SWOT Analysis
- 16.2.5.4. Recent Developments
- 16.2.5.5. Financials (Based on Availability)
- 16.2.6 Brew Dr Kombucha
- 16.2.6.1. Overview
- 16.2.6.2. Products
- 16.2.6.3. SWOT Analysis
- 16.2.6.4. Recent Developments
- 16.2.6.5. Financials (Based on Availability)
- 16.2.7 Makana Beverages Inc
- 16.2.7.1. Overview
- 16.2.7.2. Products
- 16.2.7.3. SWOT Analysis
- 16.2.7.4. Recent Developments
- 16.2.7.5. Financials (Based on Availability)
- 16.2.8 Hain Celestial
- 16.2.8.1. Overview
- 16.2.8.2. Products
- 16.2.8.3. SWOT Analysis
- 16.2.8.4. Recent Developments
- 16.2.8.5. Financials (Based on Availability)
- 16.2.9 Humm Kombucha LLC
- 16.2.9.1. Overview
- 16.2.9.2. Products
- 16.2.9.3. SWOT Analysis
- 16.2.9.4. Recent Developments
- 16.2.9.5. Financials (Based on Availability)
- 16.2.10 Health-Ade
- 16.2.10.1. Overview
- 16.2.10.2. Products
- 16.2.10.3. SWOT Analysis
- 16.2.10.4. Recent Developments
- 16.2.10.5. Financials (Based on Availability)
- 16.2.1 Wonder Drink
List of Figures
- Figure 1: Global Kombucha Industry Revenue Breakdown (Million, %) by Region 2024 & 2032
- Figure 2: North America Kombucha Industry Revenue (Million), by Country 2024 & 2032
- Figure 3: North America Kombucha Industry Revenue Share (%), by Country 2024 & 2032
- Figure 4: Europe Kombucha Industry Revenue (Million), by Country 2024 & 2032
- Figure 5: Europe Kombucha Industry Revenue Share (%), by Country 2024 & 2032
- Figure 6: Asia Pacific Kombucha Industry Revenue (Million), by Country 2024 & 2032
- Figure 7: Asia Pacific Kombucha Industry Revenue Share (%), by Country 2024 & 2032
- Figure 8: South America Kombucha Industry Revenue (Million), by Country 2024 & 2032
- Figure 9: South America Kombucha Industry Revenue Share (%), by Country 2024 & 2032
- Figure 10: Middle East and Africa Kombucha Industry Revenue (Million), by Country 2024 & 2032
- Figure 11: Middle East and Africa Kombucha Industry Revenue Share (%), by Country 2024 & 2032
- Figure 12: North America Kombucha Industry Revenue (Million), by Type 2024 & 2032
- Figure 13: North America Kombucha Industry Revenue Share (%), by Type 2024 & 2032
- Figure 14: North America Kombucha Industry Revenue (Million), by Distribution Channel 2024 & 2032
- Figure 15: North America Kombucha Industry Revenue Share (%), by Distribution Channel 2024 & 2032
- Figure 16: North America Kombucha Industry Revenue (Million), by Country 2024 & 2032
- Figure 17: North America Kombucha Industry Revenue Share (%), by Country 2024 & 2032
- Figure 18: Europe Kombucha Industry Revenue (Million), by Type 2024 & 2032
- Figure 19: Europe Kombucha Industry Revenue Share (%), by Type 2024 & 2032
- Figure 20: Europe Kombucha Industry Revenue (Million), by Distribution Channel 2024 & 2032
- Figure 21: Europe Kombucha Industry Revenue Share (%), by Distribution Channel 2024 & 2032
- Figure 22: Europe Kombucha Industry Revenue (Million), by Country 2024 & 2032
- Figure 23: Europe Kombucha Industry Revenue Share (%), by Country 2024 & 2032
- Figure 24: Asia Pacific Kombucha Industry Revenue (Million), by Type 2024 & 2032
- Figure 25: Asia Pacific Kombucha Industry Revenue Share (%), by Type 2024 & 2032
- Figure 26: Asia Pacific Kombucha Industry Revenue (Million), by Distribution Channel 2024 & 2032
- Figure 27: Asia Pacific Kombucha Industry Revenue Share (%), by Distribution Channel 2024 & 2032
- Figure 28: Asia Pacific Kombucha Industry Revenue (Million), by Country 2024 & 2032
- Figure 29: Asia Pacific Kombucha Industry Revenue Share (%), by Country 2024 & 2032
- Figure 30: South America Kombucha Industry Revenue (Million), by Type 2024 & 2032
- Figure 31: South America Kombucha Industry Revenue Share (%), by Type 2024 & 2032
- Figure 32: South America Kombucha Industry Revenue (Million), by Distribution Channel 2024 & 2032
- Figure 33: South America Kombucha Industry Revenue Share (%), by Distribution Channel 2024 & 2032
- Figure 34: South America Kombucha Industry Revenue (Million), by Country 2024 & 2032
- Figure 35: South America Kombucha Industry Revenue Share (%), by Country 2024 & 2032
- Figure 36: Middle East and Africa Kombucha Industry Revenue (Million), by Type 2024 & 2032
- Figure 37: Middle East and Africa Kombucha Industry Revenue Share (%), by Type 2024 & 2032
- Figure 38: Middle East and Africa Kombucha Industry Revenue (Million), by Distribution Channel 2024 & 2032
- Figure 39: Middle East and Africa Kombucha Industry Revenue Share (%), by Distribution Channel 2024 & 2032
- Figure 40: Middle East and Africa Kombucha Industry Revenue (Million), by Country 2024 & 2032
- Figure 41: Middle East and Africa Kombucha Industry Revenue Share (%), by Country 2024 & 2032
List of Tables
- Table 1: Global Kombucha Industry Revenue Million Forecast, by Region 2019 & 2032
- Table 2: Global Kombucha Industry Revenue Million Forecast, by Type 2019 & 2032
- Table 3: Global Kombucha Industry Revenue Million Forecast, by Distribution Channel 2019 & 2032
- Table 4: Global Kombucha Industry Revenue Million Forecast, by Region 2019 & 2032
- Table 5: Global Kombucha Industry Revenue Million Forecast, by Country 2019 & 2032
- Table 6: United States Kombucha Industry Revenue (Million) Forecast, by Application 2019 & 2032
- Table 7: Canada Kombucha Industry Revenue (Million) Forecast, by Application 2019 & 2032
- Table 8: Mexico Kombucha Industry Revenue (Million) Forecast, by Application 2019 & 2032
- Table 9: Rest of North America Kombucha Industry Revenue (Million) Forecast, by Application 2019 & 2032
- Table 10: Global Kombucha Industry Revenue Million Forecast, by Country 2019 & 2032
- Table 11: Spain Kombucha Industry Revenue (Million) Forecast, by Application 2019 & 2032
- Table 12: United Kingdom Kombucha Industry Revenue (Million) Forecast, by Application 2019 & 2032
- Table 13: Germany Kombucha Industry Revenue (Million) Forecast, by Application 2019 & 2032
- Table 14: France Kombucha Industry Revenue (Million) Forecast, by Application 2019 & 2032
- Table 15: Italy Kombucha Industry Revenue (Million) Forecast, by Application 2019 & 2032
- Table 16: Russia Kombucha Industry Revenue (Million) Forecast, by Application 2019 & 2032
- Table 17: Rest of Europe Kombucha Industry Revenue (Million) Forecast, by Application 2019 & 2032
- Table 18: Global Kombucha Industry Revenue Million Forecast, by Country 2019 & 2032
- Table 19: China Kombucha Industry Revenue (Million) Forecast, by Application 2019 & 2032
- Table 20: Japan Kombucha Industry Revenue (Million) Forecast, by Application 2019 & 2032
- Table 21: India Kombucha Industry Revenue (Million) Forecast, by Application 2019 & 2032
- Table 22: Australia Kombucha Industry Revenue (Million) Forecast, by Application 2019 & 2032
- Table 23: Rest of Asia Pacific Kombucha Industry Revenue (Million) Forecast, by Application 2019 & 2032
- Table 24: Global Kombucha Industry Revenue Million Forecast, by Country 2019 & 2032
- Table 25: Brazil Kombucha Industry Revenue (Million) Forecast, by Application 2019 & 2032
- Table 26: Argentina Kombucha Industry Revenue (Million) Forecast, by Application 2019 & 2032
- Table 27: Rest of South America Kombucha Industry Revenue (Million) Forecast, by Application 2019 & 2032
- Table 28: Global Kombucha Industry Revenue Million Forecast, by Country 2019 & 2032
- Table 29: South Africa Kombucha Industry Revenue (Million) Forecast, by Application 2019 & 2032
- Table 30: Saudi Arabia Kombucha Industry Revenue (Million) Forecast, by Application 2019 & 2032
- Table 31: Rest of Middle East and Africa Kombucha Industry Revenue (Million) Forecast, by Application 2019 & 2032
- Table 32: Global Kombucha Industry Revenue Million Forecast, by Type 2019 & 2032
- Table 33: Global Kombucha Industry Revenue Million Forecast, by Distribution Channel 2019 & 2032
- Table 34: Global Kombucha Industry Revenue Million Forecast, by Country 2019 & 2032
- Table 35: United States Kombucha Industry Revenue (Million) Forecast, by Application 2019 & 2032
- Table 36: Canada Kombucha Industry Revenue (Million) Forecast, by Application 2019 & 2032
- Table 37: Mexico Kombucha Industry Revenue (Million) Forecast, by Application 2019 & 2032
- Table 38: Rest of North America Kombucha Industry Revenue (Million) Forecast, by Application 2019 & 2032
- Table 39: Global Kombucha Industry Revenue Million Forecast, by Type 2019 & 2032
- Table 40: Global Kombucha Industry Revenue Million Forecast, by Distribution Channel 2019 & 2032
- Table 41: Global Kombucha Industry Revenue Million Forecast, by Country 2019 & 2032
- Table 42: Spain Kombucha Industry Revenue (Million) Forecast, by Application 2019 & 2032
- Table 43: United Kingdom Kombucha Industry Revenue (Million) Forecast, by Application 2019 & 2032
- Table 44: Germany Kombucha Industry Revenue (Million) Forecast, by Application 2019 & 2032
- Table 45: France Kombucha Industry Revenue (Million) Forecast, by Application 2019 & 2032
- Table 46: Italy Kombucha Industry Revenue (Million) Forecast, by Application 2019 & 2032
- Table 47: Russia Kombucha Industry Revenue (Million) Forecast, by Application 2019 & 2032
- Table 48: Rest of Europe Kombucha Industry Revenue (Million) Forecast, by Application 2019 & 2032
- Table 49: Global Kombucha Industry Revenue Million Forecast, by Type 2019 & 2032
- Table 50: Global Kombucha Industry Revenue Million Forecast, by Distribution Channel 2019 & 2032
- Table 51: Global Kombucha Industry Revenue Million Forecast, by Country 2019 & 2032
- Table 52: China Kombucha Industry Revenue (Million) Forecast, by Application 2019 & 2032
- Table 53: Japan Kombucha Industry Revenue (Million) Forecast, by Application 2019 & 2032
- Table 54: India Kombucha Industry Revenue (Million) Forecast, by Application 2019 & 2032
- Table 55: Australia Kombucha Industry Revenue (Million) Forecast, by Application 2019 & 2032
- Table 56: Rest of Asia Pacific Kombucha Industry Revenue (Million) Forecast, by Application 2019 & 2032
- Table 57: Global Kombucha Industry Revenue Million Forecast, by Type 2019 & 2032
- Table 58: Global Kombucha Industry Revenue Million Forecast, by Distribution Channel 2019 & 2032
- Table 59: Global Kombucha Industry Revenue Million Forecast, by Country 2019 & 2032
- Table 60: Brazil Kombucha Industry Revenue (Million) Forecast, by Application 2019 & 2032
- Table 61: Argentina Kombucha Industry Revenue (Million) Forecast, by Application 2019 & 2032
- Table 62: Rest of South America Kombucha Industry Revenue (Million) Forecast, by Application 2019 & 2032
- Table 63: Global Kombucha Industry Revenue Million Forecast, by Type 2019 & 2032
- Table 64: Global Kombucha Industry Revenue Million Forecast, by Distribution Channel 2019 & 2032
- Table 65: Global Kombucha Industry Revenue Million Forecast, by Country 2019 & 2032
- Table 66: South Africa Kombucha Industry Revenue (Million) Forecast, by Application 2019 & 2032
- Table 67: Saudi Arabia Kombucha Industry Revenue (Million) Forecast, by Application 2019 & 2032
- Table 68: Rest of Middle East and Africa Kombucha Industry Revenue (Million) Forecast, by Application 2019 & 2032
Frequently Asked Questions
1. What is the projected Compound Annual Growth Rate (CAGR) of the Kombucha Industry?
The projected CAGR is approximately 9.48%.
2. Which companies are prominent players in the Kombucha Industry?
Key companies in the market include Wonder Drink, Revive Kombucha, GT's Living Foods, PepsiCo Inc (Kevita), NessAlla Kombucha*List Not Exhaustive, Brew Dr Kombucha, Makana Beverages Inc, Hain Celestial, Humm Kombucha LLC, Health-Ade.
3. What are the main segments of the Kombucha Industry?
The market segments include Type, Distribution Channel.
4. Can you provide details about the market size?
The market size is estimated to be USD 2.97 Million as of 2022.
5. What are some drivers contributing to market growth?
Increasing application of Gelatin in healthcare and pharmaceutical sector.
6. What are the notable trends driving market growth?
Rising Health Awareness Among Consumers.
7. Are there any restraints impacting market growth?
Rising demand for clean label products.
8. Can you provide examples of recent developments in the market?
February 2022: Brew Dr. launched their first-ever peach-flavored kombucha, Just Peachy. It is made with high-quality loose-leaf green tea and then blends in five varieties of organic peaches. The result is a delicious balance of sweet, ripe, and tart flavors, with hints of honey and summer flowers.
9. What pricing options are available for accessing the report?
Pricing options include single-user, multi-user, and enterprise licenses priced at USD 4750, USD 5250, and USD 8750 respectively.
10. Is the market size provided in terms of value or volume?
The market size is provided in terms of value, measured in Million.
11. Are there any specific market keywords associated with the report?
Yes, the market keyword associated with the report is "Kombucha Industry," which aids in identifying and referencing the specific market segment covered.
12. How do I determine which pricing option suits my needs best?
The pricing options vary based on user requirements and access needs. Individual users may opt for single-user licenses, while businesses requiring broader access may choose multi-user or enterprise licenses for cost-effective access to the report.
13. Are there any additional resources or data provided in the Kombucha Industry report?
While the report offers comprehensive insights, it's advisable to review the specific contents or supplementary materials provided to ascertain if additional resources or data are available.
14. How can I stay updated on further developments or reports in the Kombucha Industry?
To stay informed about further developments, trends, and reports in the Kombucha Industry, consider subscribing to industry newsletters, following relevant companies and organizations, or regularly checking reputable industry news sources and publications.
Methodology
Step 1 - Identification of Relevant Samples Size from Population Database


Step 2 - Approaches for Defining Global Market Size (Value, Volume* & Price*)

Note*: In applicable scenarios
Step 3 - Data Sources
Primary Research
- Web Analytics
- Survey Reports
- Research Institute
- Latest Research Reports
- Opinion Leaders
Secondary Research
- Annual Reports
- White Paper
- Latest Press Release
- Industry Association
- Paid Database
- Investor Presentations

Step 4 - Data Triangulation
Involves using different sources of information in order to increase the validity of a study
These sources are likely to be stakeholders in a program - participants, other researchers, program staff, other community members, and so on.
Then we put all data in single framework & apply various statistical tools to find out the dynamic on the market.
During the analysis stage, feedback from the stakeholder groups would be compared to determine areas of agreement as well as areas of divergence


