
Key Insights
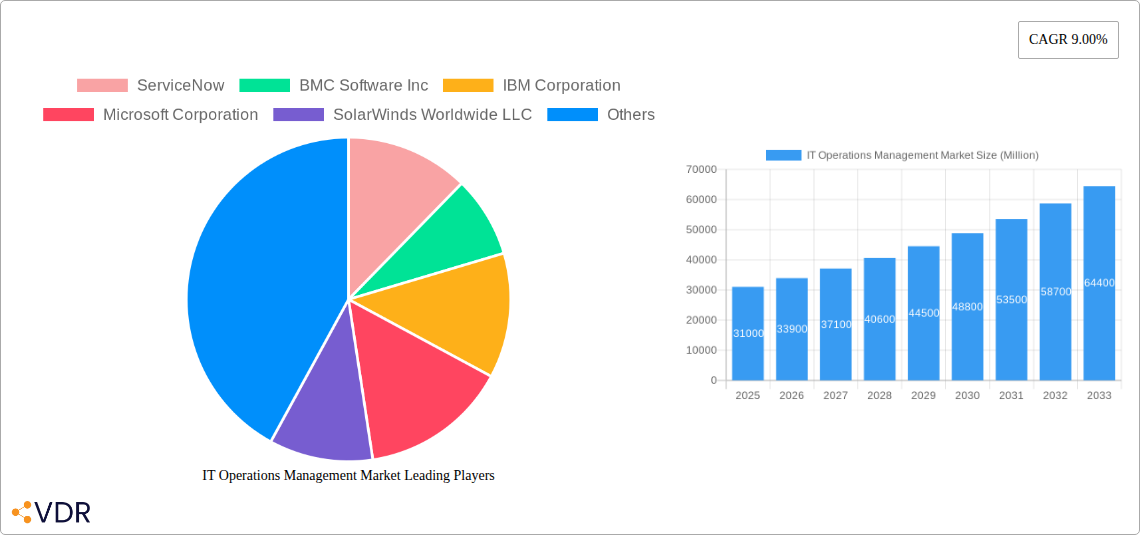
The IT Operations Management (ITOM) market is experiencing robust growth, projected to reach \$31 billion in 2025 and maintain a Compound Annual Growth Rate (CAGR) of 9% through 2033. This expansion is driven by several key factors. The increasing complexity of IT infrastructure, fueled by cloud adoption, digital transformation initiatives, and the proliferation of IoT devices, necessitates sophisticated ITOM solutions to ensure operational efficiency, optimize performance, and minimize downtime. Businesses are increasingly adopting AIOps (Artificial Intelligence for IT Operations) to leverage machine learning and automation for proactive issue identification and resolution, further boosting market growth. Furthermore, the rising demand for enhanced security and compliance necessitates robust ITOM tools capable of managing security threats and ensuring regulatory adherence. Major players like ServiceNow, IBM, and Microsoft are actively contributing to market growth through continuous innovation and strategic acquisitions.
The competitive landscape is characterized by a mix of established players and emerging niche providers. Established vendors offer comprehensive ITOM suites, while newer entrants specialize in specific areas like AIOps or cloud-native monitoring. Despite the growth, market restraints include the high initial investment costs associated with implementing ITOM solutions, the need for skilled professionals to effectively manage these systems, and the complexities of integrating ITOM with existing IT infrastructure. However, these challenges are being mitigated by the availability of cloud-based ITOM solutions, which offer scalability and reduced upfront investment. The market segmentation reveals a strong demand for solutions across various verticals, including finance, healthcare, and retail, underscoring the broad applicability of ITOM across diverse industries. Future growth is expected to be particularly strong in regions with rapidly expanding digital economies and high rates of cloud adoption.
IT Operations Management Market: A Comprehensive Report (2019-2033)
This comprehensive report offers an in-depth analysis of the IT Operations Management market, encompassing market dynamics, growth trends, regional dominance, product landscape, key players, and future outlook. The study period covers 2019-2033, with a base year of 2025 and a forecast period of 2025-2033. This report is invaluable for IT professionals, investors, and anyone seeking to understand this rapidly evolving market segment. The parent market is IT Infrastructure Management, and this report focuses on the child market of IT Operations Management.
IT Operations Management Market Dynamics & Structure
The IT Operations Management market is characterized by moderate concentration, with several key players holding significant market share. The market size in 2025 is estimated at $xx Million. Technological innovation, particularly in areas like AI-powered automation and cloud-based solutions, is a primary growth driver. Stringent regulatory compliance requirements in various sectors, coupled with the increasing adoption of hybrid cloud environments, significantly influence market dynamics. Competitive pressures from substitute products, such as open-source solutions, remain a challenge.
- Market Concentration: Moderately concentrated, with top 5 players holding approximately 60% market share in 2025.
- Technological Innovation: AI, Machine Learning (ML), and automation are key drivers, boosting efficiency and reducing operational costs.
- Regulatory Frameworks: Compliance mandates (e.g., GDPR, HIPAA) drive adoption of robust IT operations management tools.
- Competitive Substitutes: Open-source solutions and emerging technologies offer competitive alternatives.
- End-User Demographics: Primarily large enterprises and government agencies, with increasing adoption by SMEs.
- M&A Trends: A moderate level of M&A activity, driven by strategic acquisitions to expand capabilities and market reach. The number of deals closed in 2024 is estimated at xx.
IT Operations Management Market Growth Trends & Insights
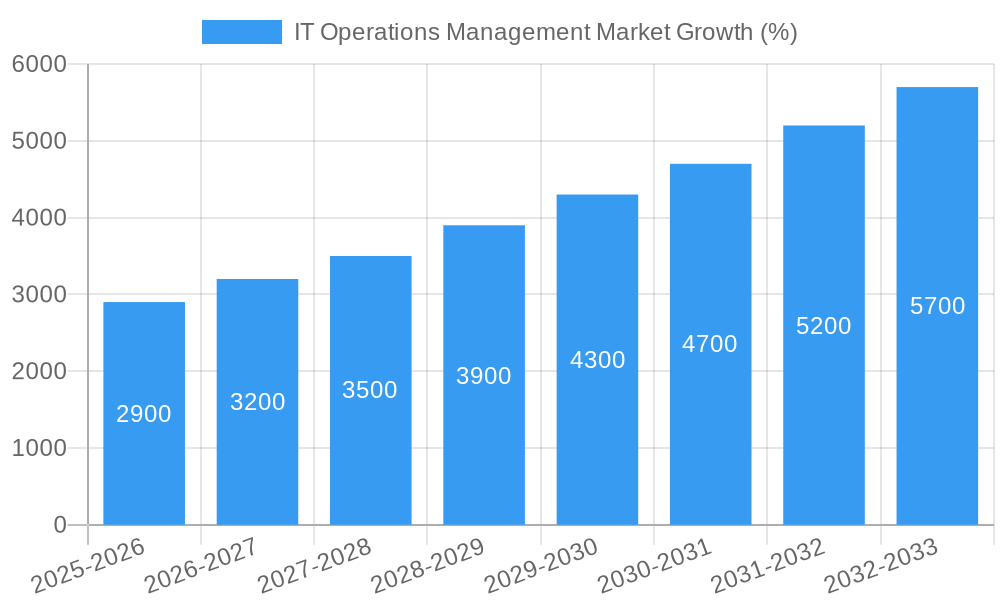
The IT Operations Management market is experiencing robust growth, driven by the increasing complexity of IT infrastructures, the proliferation of cloud services, and the rising demand for enhanced operational efficiency. The market is projected to witness a Compound Annual Growth Rate (CAGR) of xx% during the forecast period (2025-2033), reaching an estimated value of $xx Million by 2033. This growth is fuelled by the rising adoption of digital transformation strategies across various industry verticals and the increasing need for proactive IT management. Market penetration is currently estimated at xx%, with significant potential for further growth, especially in developing economies. The shift towards cloud-native architectures, the adoption of DevOps practices, and the increasing importance of data security are key factors influencing market growth.
Dominant Regions, Countries, or Segments in IT Operations Management Market
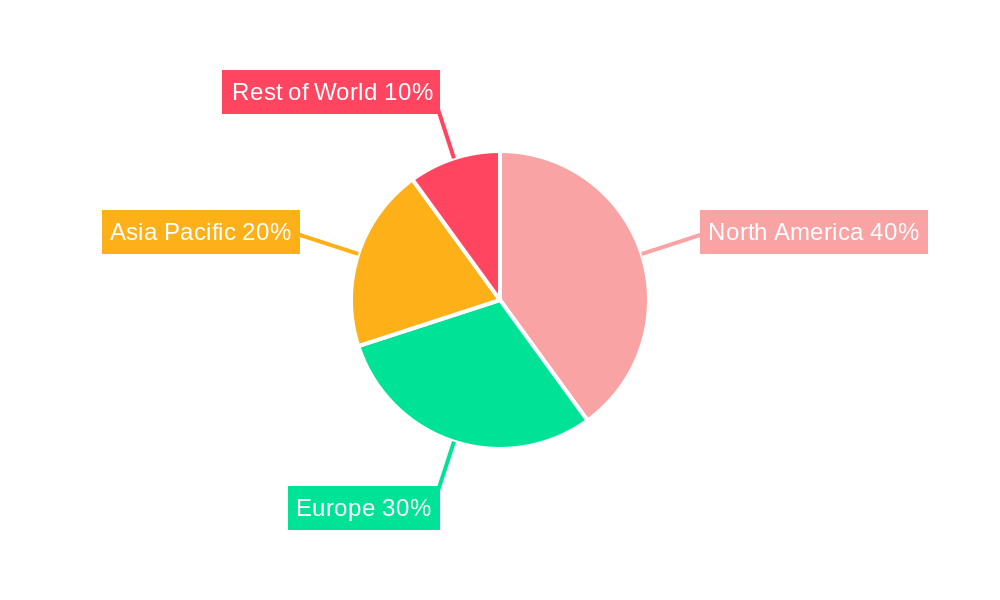
North America currently holds the largest market share in the IT Operations Management market, driven by high technology adoption rates, robust digital infrastructure, and the presence of major technology vendors. Europe and Asia-Pacific are also witnessing significant growth, propelled by increasing digitalization efforts and rising demand for IT services.
- North America: Dominant market share due to high tech adoption and presence of major vendors. Strong regulatory frameworks further drive demand.
- Europe: Growing market driven by increasing digital transformation initiatives across various sectors.
- Asia-Pacific: Rapid growth fueled by increasing IT spending and technological advancements in key economies like China and India.
- Key Drivers: Robust digital infrastructure, strong government support for digital initiatives, increasing IT budgets across industries, and a skilled workforce.
IT Operations Management Market Product Landscape
The IT Operations Management market offers a diverse range of products, including monitoring tools, automation platforms, service management solutions, and security information and event management (SIEM) systems. These products are designed to enhance operational efficiency, improve application performance, and strengthen cybersecurity posture. Recent innovations focus on AI-powered analytics, predictive capabilities, and seamless integration with cloud platforms. Unique selling propositions include simplified management interfaces, improved real-time visibility, and enhanced scalability.
Key Drivers, Barriers & Challenges in IT Operations Management Market
Key Drivers:
- The increasing complexity of IT infrastructure.
- The rise of cloud computing and hybrid cloud environments.
- The growing need for improved operational efficiency and reduced costs.
- The increasing demand for enhanced security and compliance.
Key Challenges:
- The high cost of implementation and maintenance.
- The lack of skilled professionals.
- The complexity of integrating different IT systems.
- Competitive pressure from open-source alternatives. This results in an estimated xx% reduction in market growth potential annually.
Emerging Opportunities in IT Operations Management Market
- Expanding into untapped markets, particularly in developing economies.
- Developing AI-powered solutions for proactive IT management.
- Integrating IT operations management with DevOps and cloud-native technologies.
- Focusing on enhancing cybersecurity and compliance capabilities.
Growth Accelerators in the IT Operations Management Market Industry
Strategic partnerships between IT operations management vendors and cloud providers are accelerating market growth. Further technological advancements, particularly in areas such as artificial intelligence (AI) and machine learning (ML), are creating opportunities for enhanced automation, predictive analytics, and improved decision-making. Expansion into new markets and the development of innovative solutions tailored to specific industry needs are also key catalysts.
Key Players Shaping the IT Operations Management Market Market
- ServiceNow
- BMC Software Inc
- IBM Corporation
- Microsoft Corporation
- SolarWinds Worldwide LLC
- Splunk Inc (Cisco Systems Inc)
- Broadcom
- Open Text Corporation
- Zoho Corporation Pvt Ltd
- Dynatrace LLC
- New Relic Inc
- Datadog
- Hewlett Packard Enterprise Development LP
- Dell Inc
- PagerDuty Inc
- ScienceLogi
Notable Milestones in IT Operations Management Market Sector
- August 2024: Hewlett Packard Enterprise (HPE) announced the acquisition of Morpheus Data, enhancing its HPE GreenLake cloud offering with multi-vendor and multi-cloud capabilities.
- July 2024: Operative IQ launched a new facilities management module, providing organizations with a unified platform to access and manage facility-related data.
In-Depth IT Operations Management Market Market Outlook
The IT Operations Management market is poised for sustained growth, driven by continuous technological advancements, increasing digital transformation initiatives, and the rising demand for efficient and secure IT operations. The market presents significant opportunities for innovative vendors offering AI-powered solutions, cloud-based platforms, and enhanced security features. Strategic partnerships and market expansion into developing economies will further fuel long-term growth and create lucrative opportunities for players in this dynamic market.
IT Operations Management Market Segmentation
-
1. Solution Type
- 1.1. Network and Infrastructure Management
- 1.2. Application Performance Management
- 1.3. Configuration Management
- 1.4. Cloud and Hybrid IT Management
- 1.5. IT Operations Analytics
- 1.6. Automation and Orchestration
-
2. Deployment
- 2.1. On Premise
- 2.2. Cloud Based
- 2.3. Hybrid
-
3. End User Vertical
- 3.1. BFSI
- 3.2. IT and Telecom
- 3.3. Healthcare
- 3.4. Retail
- 3.5. Manufacturing
- 3.6. Government and Public Sector
- 3.7. Energy and Utilities
IT Operations Management Market Segmentation By Geography
- 1. North America
- 2. Europe
- 3. Asia
- 4. Australia and New Zealand
- 5. Latin America
- 6. Middle East and Africa
IT Operations Management Market REPORT HIGHLIGHTS
| Aspects | Details |
|---|---|
| Study Period | 2019-2033 |
| Base Year | 2024 |
| Estimated Year | 2025 |
| Forecast Period | 2025-2033 |
| Historical Period | 2019-2024 |
| Growth Rate | CAGR of 9.00% from 2019-2033 |
| Segmentation |
|
Table of Contents
- 1. Introduction
- 1.1. Research Scope
- 1.2. Market Segmentation
- 1.3. Research Methodology
- 1.4. Definitions and Assumptions
- 2. Executive Summary
- 2.1. Introduction
- 3. Market Dynamics
- 3.1. Introduction
- 3.2. Market Drivers
- 3.2.1. Increasing IT Complexity; Adoption of AI and Automation
- 3.3. Market Restrains
- 3.3.1. Increasing IT Complexity; Adoption of AI and Automation
- 3.4. Market Trends
- 3.4.1. IT and Telecom Sector Witnessing Demand
- 4. Market Factor Analysis
- 4.1. Porters Five Forces
- 4.2. Supply/Value Chain
- 4.3. PESTEL analysis
- 4.4. Market Entropy
- 4.5. Patent/Trademark Analysis
- 5. Global IT Operations Management Market Analysis, Insights and Forecast, 2019-2031
- 5.1. Market Analysis, Insights and Forecast - by Solution Type
- 5.1.1. Network and Infrastructure Management
- 5.1.2. Application Performance Management
- 5.1.3. Configuration Management
- 5.1.4. Cloud and Hybrid IT Management
- 5.1.5. IT Operations Analytics
- 5.1.6. Automation and Orchestration
- 5.2. Market Analysis, Insights and Forecast - by Deployment
- 5.2.1. On Premise
- 5.2.2. Cloud Based
- 5.2.3. Hybrid
- 5.3. Market Analysis, Insights and Forecast - by End User Vertical
- 5.3.1. BFSI
- 5.3.2. IT and Telecom
- 5.3.3. Healthcare
- 5.3.4. Retail
- 5.3.5. Manufacturing
- 5.3.6. Government and Public Sector
- 5.3.7. Energy and Utilities
- 5.4. Market Analysis, Insights and Forecast - by Region
- 5.4.1. North America
- 5.4.2. Europe
- 5.4.3. Asia
- 5.4.4. Australia and New Zealand
- 5.4.5. Latin America
- 5.4.6. Middle East and Africa
- 5.1. Market Analysis, Insights and Forecast - by Solution Type
- 6. North America IT Operations Management Market Analysis, Insights and Forecast, 2019-2031
- 6.1. Market Analysis, Insights and Forecast - by Solution Type
- 6.1.1. Network and Infrastructure Management
- 6.1.2. Application Performance Management
- 6.1.3. Configuration Management
- 6.1.4. Cloud and Hybrid IT Management
- 6.1.5. IT Operations Analytics
- 6.1.6. Automation and Orchestration
- 6.2. Market Analysis, Insights and Forecast - by Deployment
- 6.2.1. On Premise
- 6.2.2. Cloud Based
- 6.2.3. Hybrid
- 6.3. Market Analysis, Insights and Forecast - by End User Vertical
- 6.3.1. BFSI
- 6.3.2. IT and Telecom
- 6.3.3. Healthcare
- 6.3.4. Retail
- 6.3.5. Manufacturing
- 6.3.6. Government and Public Sector
- 6.3.7. Energy and Utilities
- 6.1. Market Analysis, Insights and Forecast - by Solution Type
- 7. Europe IT Operations Management Market Analysis, Insights and Forecast, 2019-2031
- 7.1. Market Analysis, Insights and Forecast - by Solution Type
- 7.1.1. Network and Infrastructure Management
- 7.1.2. Application Performance Management
- 7.1.3. Configuration Management
- 7.1.4. Cloud and Hybrid IT Management
- 7.1.5. IT Operations Analytics
- 7.1.6. Automation and Orchestration
- 7.2. Market Analysis, Insights and Forecast - by Deployment
- 7.2.1. On Premise
- 7.2.2. Cloud Based
- 7.2.3. Hybrid
- 7.3. Market Analysis, Insights and Forecast - by End User Vertical
- 7.3.1. BFSI
- 7.3.2. IT and Telecom
- 7.3.3. Healthcare
- 7.3.4. Retail
- 7.3.5. Manufacturing
- 7.3.6. Government and Public Sector
- 7.3.7. Energy and Utilities
- 7.1. Market Analysis, Insights and Forecast - by Solution Type
- 8. Asia IT Operations Management Market Analysis, Insights and Forecast, 2019-2031
- 8.1. Market Analysis, Insights and Forecast - by Solution Type
- 8.1.1. Network and Infrastructure Management
- 8.1.2. Application Performance Management
- 8.1.3. Configuration Management
- 8.1.4. Cloud and Hybrid IT Management
- 8.1.5. IT Operations Analytics
- 8.1.6. Automation and Orchestration
- 8.2. Market Analysis, Insights and Forecast - by Deployment
- 8.2.1. On Premise
- 8.2.2. Cloud Based
- 8.2.3. Hybrid
- 8.3. Market Analysis, Insights and Forecast - by End User Vertical
- 8.3.1. BFSI
- 8.3.2. IT and Telecom
- 8.3.3. Healthcare
- 8.3.4. Retail
- 8.3.5. Manufacturing
- 8.3.6. Government and Public Sector
- 8.3.7. Energy and Utilities
- 8.1. Market Analysis, Insights and Forecast - by Solution Type
- 9. Australia and New Zealand IT Operations Management Market Analysis, Insights and Forecast, 2019-2031
- 9.1. Market Analysis, Insights and Forecast - by Solution Type
- 9.1.1. Network and Infrastructure Management
- 9.1.2. Application Performance Management
- 9.1.3. Configuration Management
- 9.1.4. Cloud and Hybrid IT Management
- 9.1.5. IT Operations Analytics
- 9.1.6. Automation and Orchestration
- 9.2. Market Analysis, Insights and Forecast - by Deployment
- 9.2.1. On Premise
- 9.2.2. Cloud Based
- 9.2.3. Hybrid
- 9.3. Market Analysis, Insights and Forecast - by End User Vertical
- 9.3.1. BFSI
- 9.3.2. IT and Telecom
- 9.3.3. Healthcare
- 9.3.4. Retail
- 9.3.5. Manufacturing
- 9.3.6. Government and Public Sector
- 9.3.7. Energy and Utilities
- 9.1. Market Analysis, Insights and Forecast - by Solution Type
- 10. Latin America IT Operations Management Market Analysis, Insights and Forecast, 2019-2031
- 10.1. Market Analysis, Insights and Forecast - by Solution Type
- 10.1.1. Network and Infrastructure Management
- 10.1.2. Application Performance Management
- 10.1.3. Configuration Management
- 10.1.4. Cloud and Hybrid IT Management
- 10.1.5. IT Operations Analytics
- 10.1.6. Automation and Orchestration
- 10.2. Market Analysis, Insights and Forecast - by Deployment
- 10.2.1. On Premise
- 10.2.2. Cloud Based
- 10.2.3. Hybrid
- 10.3. Market Analysis, Insights and Forecast - by End User Vertical
- 10.3.1. BFSI
- 10.3.2. IT and Telecom
- 10.3.3. Healthcare
- 10.3.4. Retail
- 10.3.5. Manufacturing
- 10.3.6. Government and Public Sector
- 10.3.7. Energy and Utilities
- 10.1. Market Analysis, Insights and Forecast - by Solution Type
- 11. Middle East and Africa IT Operations Management Market Analysis, Insights and Forecast, 2019-2031
- 11.1. Market Analysis, Insights and Forecast - by Solution Type
- 11.1.1. Network and Infrastructure Management
- 11.1.2. Application Performance Management
- 11.1.3. Configuration Management
- 11.1.4. Cloud and Hybrid IT Management
- 11.1.5. IT Operations Analytics
- 11.1.6. Automation and Orchestration
- 11.2. Market Analysis, Insights and Forecast - by Deployment
- 11.2.1. On Premise
- 11.2.2. Cloud Based
- 11.2.3. Hybrid
- 11.3. Market Analysis, Insights and Forecast - by End User Vertical
- 11.3.1. BFSI
- 11.3.2. IT and Telecom
- 11.3.3. Healthcare
- 11.3.4. Retail
- 11.3.5. Manufacturing
- 11.3.6. Government and Public Sector
- 11.3.7. Energy and Utilities
- 11.1. Market Analysis, Insights and Forecast - by Solution Type
- 12. Competitive Analysis
- 12.1. Global Market Share Analysis 2024
- 12.2. Company Profiles
- 12.2.1 ServiceNow
- 12.2.1.1. Overview
- 12.2.1.2. Products
- 12.2.1.3. SWOT Analysis
- 12.2.1.4. Recent Developments
- 12.2.1.5. Financials (Based on Availability)
- 12.2.2 BMC Software Inc
- 12.2.2.1. Overview
- 12.2.2.2. Products
- 12.2.2.3. SWOT Analysis
- 12.2.2.4. Recent Developments
- 12.2.2.5. Financials (Based on Availability)
- 12.2.3 IBM Corporation
- 12.2.3.1. Overview
- 12.2.3.2. Products
- 12.2.3.3. SWOT Analysis
- 12.2.3.4. Recent Developments
- 12.2.3.5. Financials (Based on Availability)
- 12.2.4 Microsoft Corporation
- 12.2.4.1. Overview
- 12.2.4.2. Products
- 12.2.4.3. SWOT Analysis
- 12.2.4.4. Recent Developments
- 12.2.4.5. Financials (Based on Availability)
- 12.2.5 SolarWinds Worldwide LLC
- 12.2.5.1. Overview
- 12.2.5.2. Products
- 12.2.5.3. SWOT Analysis
- 12.2.5.4. Recent Developments
- 12.2.5.5. Financials (Based on Availability)
- 12.2.6 Splunk Inc (Cisco Systems Inc)
- 12.2.6.1. Overview
- 12.2.6.2. Products
- 12.2.6.3. SWOT Analysis
- 12.2.6.4. Recent Developments
- 12.2.6.5. Financials (Based on Availability)
- 12.2.7 Broadcom
- 12.2.7.1. Overview
- 12.2.7.2. Products
- 12.2.7.3. SWOT Analysis
- 12.2.7.4. Recent Developments
- 12.2.7.5. Financials (Based on Availability)
- 12.2.8 Open Text Corporation
- 12.2.8.1. Overview
- 12.2.8.2. Products
- 12.2.8.3. SWOT Analysis
- 12.2.8.4. Recent Developments
- 12.2.8.5. Financials (Based on Availability)
- 12.2.9 Zoho Corporation Pvt Ltd
- 12.2.9.1. Overview
- 12.2.9.2. Products
- 12.2.9.3. SWOT Analysis
- 12.2.9.4. Recent Developments
- 12.2.9.5. Financials (Based on Availability)
- 12.2.10 Dynatrace LLC
- 12.2.10.1. Overview
- 12.2.10.2. Products
- 12.2.10.3. SWOT Analysis
- 12.2.10.4. Recent Developments
- 12.2.10.5. Financials (Based on Availability)
- 12.2.11 New Relic Inc
- 12.2.11.1. Overview
- 12.2.11.2. Products
- 12.2.11.3. SWOT Analysis
- 12.2.11.4. Recent Developments
- 12.2.11.5. Financials (Based on Availability)
- 12.2.12 Datadog
- 12.2.12.1. Overview
- 12.2.12.2. Products
- 12.2.12.3. SWOT Analysis
- 12.2.12.4. Recent Developments
- 12.2.12.5. Financials (Based on Availability)
- 12.2.13 Hewlett Packard Enterprise Development LP
- 12.2.13.1. Overview
- 12.2.13.2. Products
- 12.2.13.3. SWOT Analysis
- 12.2.13.4. Recent Developments
- 12.2.13.5. Financials (Based on Availability)
- 12.2.14 Dell Inc
- 12.2.14.1. Overview
- 12.2.14.2. Products
- 12.2.14.3. SWOT Analysis
- 12.2.14.4. Recent Developments
- 12.2.14.5. Financials (Based on Availability)
- 12.2.15 PagerDuty Inc
- 12.2.15.1. Overview
- 12.2.15.2. Products
- 12.2.15.3. SWOT Analysis
- 12.2.15.4. Recent Developments
- 12.2.15.5. Financials (Based on Availability)
- 12.2.16 ScienceLogi
- 12.2.16.1. Overview
- 12.2.16.2. Products
- 12.2.16.3. SWOT Analysis
- 12.2.16.4. Recent Developments
- 12.2.16.5. Financials (Based on Availability)
- 12.2.1 ServiceNow
List of Figures
- Figure 1: Global IT Operations Management Market Revenue Breakdown (Million, %) by Region 2024 & 2032
- Figure 2: Global IT Operations Management Market Volume Breakdown (Billion, %) by Region 2024 & 2032
- Figure 3: North America IT Operations Management Market Revenue (Million), by Solution Type 2024 & 2032
- Figure 4: North America IT Operations Management Market Volume (Billion), by Solution Type 2024 & 2032
- Figure 5: North America IT Operations Management Market Revenue Share (%), by Solution Type 2024 & 2032
- Figure 6: North America IT Operations Management Market Volume Share (%), by Solution Type 2024 & 2032
- Figure 7: North America IT Operations Management Market Revenue (Million), by Deployment 2024 & 2032
- Figure 8: North America IT Operations Management Market Volume (Billion), by Deployment 2024 & 2032
- Figure 9: North America IT Operations Management Market Revenue Share (%), by Deployment 2024 & 2032
- Figure 10: North America IT Operations Management Market Volume Share (%), by Deployment 2024 & 2032
- Figure 11: North America IT Operations Management Market Revenue (Million), by End User Vertical 2024 & 2032
- Figure 12: North America IT Operations Management Market Volume (Billion), by End User Vertical 2024 & 2032
- Figure 13: North America IT Operations Management Market Revenue Share (%), by End User Vertical 2024 & 2032
- Figure 14: North America IT Operations Management Market Volume Share (%), by End User Vertical 2024 & 2032
- Figure 15: North America IT Operations Management Market Revenue (Million), by Country 2024 & 2032
- Figure 16: North America IT Operations Management Market Volume (Billion), by Country 2024 & 2032
- Figure 17: North America IT Operations Management Market Revenue Share (%), by Country 2024 & 2032
- Figure 18: North America IT Operations Management Market Volume Share (%), by Country 2024 & 2032
- Figure 19: Europe IT Operations Management Market Revenue (Million), by Solution Type 2024 & 2032
- Figure 20: Europe IT Operations Management Market Volume (Billion), by Solution Type 2024 & 2032
- Figure 21: Europe IT Operations Management Market Revenue Share (%), by Solution Type 2024 & 2032
- Figure 22: Europe IT Operations Management Market Volume Share (%), by Solution Type 2024 & 2032
- Figure 23: Europe IT Operations Management Market Revenue (Million), by Deployment 2024 & 2032
- Figure 24: Europe IT Operations Management Market Volume (Billion), by Deployment 2024 & 2032
- Figure 25: Europe IT Operations Management Market Revenue Share (%), by Deployment 2024 & 2032
- Figure 26: Europe IT Operations Management Market Volume Share (%), by Deployment 2024 & 2032
- Figure 27: Europe IT Operations Management Market Revenue (Million), by End User Vertical 2024 & 2032
- Figure 28: Europe IT Operations Management Market Volume (Billion), by End User Vertical 2024 & 2032
- Figure 29: Europe IT Operations Management Market Revenue Share (%), by End User Vertical 2024 & 2032
- Figure 30: Europe IT Operations Management Market Volume Share (%), by End User Vertical 2024 & 2032
- Figure 31: Europe IT Operations Management Market Revenue (Million), by Country 2024 & 2032
- Figure 32: Europe IT Operations Management Market Volume (Billion), by Country 2024 & 2032
- Figure 33: Europe IT Operations Management Market Revenue Share (%), by Country 2024 & 2032
- Figure 34: Europe IT Operations Management Market Volume Share (%), by Country 2024 & 2032
- Figure 35: Asia IT Operations Management Market Revenue (Million), by Solution Type 2024 & 2032
- Figure 36: Asia IT Operations Management Market Volume (Billion), by Solution Type 2024 & 2032
- Figure 37: Asia IT Operations Management Market Revenue Share (%), by Solution Type 2024 & 2032
- Figure 38: Asia IT Operations Management Market Volume Share (%), by Solution Type 2024 & 2032
- Figure 39: Asia IT Operations Management Market Revenue (Million), by Deployment 2024 & 2032
- Figure 40: Asia IT Operations Management Market Volume (Billion), by Deployment 2024 & 2032
- Figure 41: Asia IT Operations Management Market Revenue Share (%), by Deployment 2024 & 2032
- Figure 42: Asia IT Operations Management Market Volume Share (%), by Deployment 2024 & 2032
- Figure 43: Asia IT Operations Management Market Revenue (Million), by End User Vertical 2024 & 2032
- Figure 44: Asia IT Operations Management Market Volume (Billion), by End User Vertical 2024 & 2032
- Figure 45: Asia IT Operations Management Market Revenue Share (%), by End User Vertical 2024 & 2032
- Figure 46: Asia IT Operations Management Market Volume Share (%), by End User Vertical 2024 & 2032
- Figure 47: Asia IT Operations Management Market Revenue (Million), by Country 2024 & 2032
- Figure 48: Asia IT Operations Management Market Volume (Billion), by Country 2024 & 2032
- Figure 49: Asia IT Operations Management Market Revenue Share (%), by Country 2024 & 2032
- Figure 50: Asia IT Operations Management Market Volume Share (%), by Country 2024 & 2032
- Figure 51: Australia and New Zealand IT Operations Management Market Revenue (Million), by Solution Type 2024 & 2032
- Figure 52: Australia and New Zealand IT Operations Management Market Volume (Billion), by Solution Type 2024 & 2032
- Figure 53: Australia and New Zealand IT Operations Management Market Revenue Share (%), by Solution Type 2024 & 2032
- Figure 54: Australia and New Zealand IT Operations Management Market Volume Share (%), by Solution Type 2024 & 2032
- Figure 55: Australia and New Zealand IT Operations Management Market Revenue (Million), by Deployment 2024 & 2032
- Figure 56: Australia and New Zealand IT Operations Management Market Volume (Billion), by Deployment 2024 & 2032
- Figure 57: Australia and New Zealand IT Operations Management Market Revenue Share (%), by Deployment 2024 & 2032
- Figure 58: Australia and New Zealand IT Operations Management Market Volume Share (%), by Deployment 2024 & 2032
- Figure 59: Australia and New Zealand IT Operations Management Market Revenue (Million), by End User Vertical 2024 & 2032
- Figure 60: Australia and New Zealand IT Operations Management Market Volume (Billion), by End User Vertical 2024 & 2032
- Figure 61: Australia and New Zealand IT Operations Management Market Revenue Share (%), by End User Vertical 2024 & 2032
- Figure 62: Australia and New Zealand IT Operations Management Market Volume Share (%), by End User Vertical 2024 & 2032
- Figure 63: Australia and New Zealand IT Operations Management Market Revenue (Million), by Country 2024 & 2032
- Figure 64: Australia and New Zealand IT Operations Management Market Volume (Billion), by Country 2024 & 2032
- Figure 65: Australia and New Zealand IT Operations Management Market Revenue Share (%), by Country 2024 & 2032
- Figure 66: Australia and New Zealand IT Operations Management Market Volume Share (%), by Country 2024 & 2032
- Figure 67: Latin America IT Operations Management Market Revenue (Million), by Solution Type 2024 & 2032
- Figure 68: Latin America IT Operations Management Market Volume (Billion), by Solution Type 2024 & 2032
- Figure 69: Latin America IT Operations Management Market Revenue Share (%), by Solution Type 2024 & 2032
- Figure 70: Latin America IT Operations Management Market Volume Share (%), by Solution Type 2024 & 2032
- Figure 71: Latin America IT Operations Management Market Revenue (Million), by Deployment 2024 & 2032
- Figure 72: Latin America IT Operations Management Market Volume (Billion), by Deployment 2024 & 2032
- Figure 73: Latin America IT Operations Management Market Revenue Share (%), by Deployment 2024 & 2032
- Figure 74: Latin America IT Operations Management Market Volume Share (%), by Deployment 2024 & 2032
- Figure 75: Latin America IT Operations Management Market Revenue (Million), by End User Vertical 2024 & 2032
- Figure 76: Latin America IT Operations Management Market Volume (Billion), by End User Vertical 2024 & 2032
- Figure 77: Latin America IT Operations Management Market Revenue Share (%), by End User Vertical 2024 & 2032
- Figure 78: Latin America IT Operations Management Market Volume Share (%), by End User Vertical 2024 & 2032
- Figure 79: Latin America IT Operations Management Market Revenue (Million), by Country 2024 & 2032
- Figure 80: Latin America IT Operations Management Market Volume (Billion), by Country 2024 & 2032
- Figure 81: Latin America IT Operations Management Market Revenue Share (%), by Country 2024 & 2032
- Figure 82: Latin America IT Operations Management Market Volume Share (%), by Country 2024 & 2032
- Figure 83: Middle East and Africa IT Operations Management Market Revenue (Million), by Solution Type 2024 & 2032
- Figure 84: Middle East and Africa IT Operations Management Market Volume (Billion), by Solution Type 2024 & 2032
- Figure 85: Middle East and Africa IT Operations Management Market Revenue Share (%), by Solution Type 2024 & 2032
- Figure 86: Middle East and Africa IT Operations Management Market Volume Share (%), by Solution Type 2024 & 2032
- Figure 87: Middle East and Africa IT Operations Management Market Revenue (Million), by Deployment 2024 & 2032
- Figure 88: Middle East and Africa IT Operations Management Market Volume (Billion), by Deployment 2024 & 2032
- Figure 89: Middle East and Africa IT Operations Management Market Revenue Share (%), by Deployment 2024 & 2032
- Figure 90: Middle East and Africa IT Operations Management Market Volume Share (%), by Deployment 2024 & 2032
- Figure 91: Middle East and Africa IT Operations Management Market Revenue (Million), by End User Vertical 2024 & 2032
- Figure 92: Middle East and Africa IT Operations Management Market Volume (Billion), by End User Vertical 2024 & 2032
- Figure 93: Middle East and Africa IT Operations Management Market Revenue Share (%), by End User Vertical 2024 & 2032
- Figure 94: Middle East and Africa IT Operations Management Market Volume Share (%), by End User Vertical 2024 & 2032
- Figure 95: Middle East and Africa IT Operations Management Market Revenue (Million), by Country 2024 & 2032
- Figure 96: Middle East and Africa IT Operations Management Market Volume (Billion), by Country 2024 & 2032
- Figure 97: Middle East and Africa IT Operations Management Market Revenue Share (%), by Country 2024 & 2032
- Figure 98: Middle East and Africa IT Operations Management Market Volume Share (%), by Country 2024 & 2032
List of Tables
- Table 1: Global IT Operations Management Market Revenue Million Forecast, by Region 2019 & 2032
- Table 2: Global IT Operations Management Market Volume Billion Forecast, by Region 2019 & 2032
- Table 3: Global IT Operations Management Market Revenue Million Forecast, by Solution Type 2019 & 2032
- Table 4: Global IT Operations Management Market Volume Billion Forecast, by Solution Type 2019 & 2032
- Table 5: Global IT Operations Management Market Revenue Million Forecast, by Deployment 2019 & 2032
- Table 6: Global IT Operations Management Market Volume Billion Forecast, by Deployment 2019 & 2032
- Table 7: Global IT Operations Management Market Revenue Million Forecast, by End User Vertical 2019 & 2032
- Table 8: Global IT Operations Management Market Volume Billion Forecast, by End User Vertical 2019 & 2032
- Table 9: Global IT Operations Management Market Revenue Million Forecast, by Region 2019 & 2032
- Table 10: Global IT Operations Management Market Volume Billion Forecast, by Region 2019 & 2032
- Table 11: Global IT Operations Management Market Revenue Million Forecast, by Solution Type 2019 & 2032
- Table 12: Global IT Operations Management Market Volume Billion Forecast, by Solution Type 2019 & 2032
- Table 13: Global IT Operations Management Market Revenue Million Forecast, by Deployment 2019 & 2032
- Table 14: Global IT Operations Management Market Volume Billion Forecast, by Deployment 2019 & 2032
- Table 15: Global IT Operations Management Market Revenue Million Forecast, by End User Vertical 2019 & 2032
- Table 16: Global IT Operations Management Market Volume Billion Forecast, by End User Vertical 2019 & 2032
- Table 17: Global IT Operations Management Market Revenue Million Forecast, by Country 2019 & 2032
- Table 18: Global IT Operations Management Market Volume Billion Forecast, by Country 2019 & 2032
- Table 19: Global IT Operations Management Market Revenue Million Forecast, by Solution Type 2019 & 2032
- Table 20: Global IT Operations Management Market Volume Billion Forecast, by Solution Type 2019 & 2032
- Table 21: Global IT Operations Management Market Revenue Million Forecast, by Deployment 2019 & 2032
- Table 22: Global IT Operations Management Market Volume Billion Forecast, by Deployment 2019 & 2032
- Table 23: Global IT Operations Management Market Revenue Million Forecast, by End User Vertical 2019 & 2032
- Table 24: Global IT Operations Management Market Volume Billion Forecast, by End User Vertical 2019 & 2032
- Table 25: Global IT Operations Management Market Revenue Million Forecast, by Country 2019 & 2032
- Table 26: Global IT Operations Management Market Volume Billion Forecast, by Country 2019 & 2032
- Table 27: Global IT Operations Management Market Revenue Million Forecast, by Solution Type 2019 & 2032
- Table 28: Global IT Operations Management Market Volume Billion Forecast, by Solution Type 2019 & 2032
- Table 29: Global IT Operations Management Market Revenue Million Forecast, by Deployment 2019 & 2032
- Table 30: Global IT Operations Management Market Volume Billion Forecast, by Deployment 2019 & 2032
- Table 31: Global IT Operations Management Market Revenue Million Forecast, by End User Vertical 2019 & 2032
- Table 32: Global IT Operations Management Market Volume Billion Forecast, by End User Vertical 2019 & 2032
- Table 33: Global IT Operations Management Market Revenue Million Forecast, by Country 2019 & 2032
- Table 34: Global IT Operations Management Market Volume Billion Forecast, by Country 2019 & 2032
- Table 35: Global IT Operations Management Market Revenue Million Forecast, by Solution Type 2019 & 2032
- Table 36: Global IT Operations Management Market Volume Billion Forecast, by Solution Type 2019 & 2032
- Table 37: Global IT Operations Management Market Revenue Million Forecast, by Deployment 2019 & 2032
- Table 38: Global IT Operations Management Market Volume Billion Forecast, by Deployment 2019 & 2032
- Table 39: Global IT Operations Management Market Revenue Million Forecast, by End User Vertical 2019 & 2032
- Table 40: Global IT Operations Management Market Volume Billion Forecast, by End User Vertical 2019 & 2032
- Table 41: Global IT Operations Management Market Revenue Million Forecast, by Country 2019 & 2032
- Table 42: Global IT Operations Management Market Volume Billion Forecast, by Country 2019 & 2032
- Table 43: Global IT Operations Management Market Revenue Million Forecast, by Solution Type 2019 & 2032
- Table 44: Global IT Operations Management Market Volume Billion Forecast, by Solution Type 2019 & 2032
- Table 45: Global IT Operations Management Market Revenue Million Forecast, by Deployment 2019 & 2032
- Table 46: Global IT Operations Management Market Volume Billion Forecast, by Deployment 2019 & 2032
- Table 47: Global IT Operations Management Market Revenue Million Forecast, by End User Vertical 2019 & 2032
- Table 48: Global IT Operations Management Market Volume Billion Forecast, by End User Vertical 2019 & 2032
- Table 49: Global IT Operations Management Market Revenue Million Forecast, by Country 2019 & 2032
- Table 50: Global IT Operations Management Market Volume Billion Forecast, by Country 2019 & 2032
- Table 51: Global IT Operations Management Market Revenue Million Forecast, by Solution Type 2019 & 2032
- Table 52: Global IT Operations Management Market Volume Billion Forecast, by Solution Type 2019 & 2032
- Table 53: Global IT Operations Management Market Revenue Million Forecast, by Deployment 2019 & 2032
- Table 54: Global IT Operations Management Market Volume Billion Forecast, by Deployment 2019 & 2032
- Table 55: Global IT Operations Management Market Revenue Million Forecast, by End User Vertical 2019 & 2032
- Table 56: Global IT Operations Management Market Volume Billion Forecast, by End User Vertical 2019 & 2032
- Table 57: Global IT Operations Management Market Revenue Million Forecast, by Country 2019 & 2032
- Table 58: Global IT Operations Management Market Volume Billion Forecast, by Country 2019 & 2032
Frequently Asked Questions
1. What is the projected Compound Annual Growth Rate (CAGR) of the IT Operations Management Market?
The projected CAGR is approximately 9.00%.
2. Which companies are prominent players in the IT Operations Management Market?
Key companies in the market include ServiceNow, BMC Software Inc, IBM Corporation, Microsoft Corporation, SolarWinds Worldwide LLC, Splunk Inc (Cisco Systems Inc), Broadcom, Open Text Corporation, Zoho Corporation Pvt Ltd, Dynatrace LLC, New Relic Inc, Datadog, Hewlett Packard Enterprise Development LP, Dell Inc, PagerDuty Inc, ScienceLogi.
3. What are the main segments of the IT Operations Management Market?
The market segments include Solution Type, Deployment, End User Vertical.
4. Can you provide details about the market size?
The market size is estimated to be USD 31 Million as of 2022.
5. What are some drivers contributing to market growth?
Increasing IT Complexity; Adoption of AI and Automation.
6. What are the notable trends driving market growth?
IT and Telecom Sector Witnessing Demand.
7. Are there any restraints impacting market growth?
Increasing IT Complexity; Adoption of AI and Automation.
8. Can you provide examples of recent developments in the market?
August 2024 - Hewlett Packard Enterprise (HPE) announced it is buying Morpheus Data, a leader in hybrid cloud management software. This move underscores HPE's dedication to streamlining IT complexities, further bolstering the hybrid operations features of its HPE GreenLake cloud. With Morpheus onboard, HPE GreenLake is expected to benefit from enhanced capabilities, including multi-vendor and multi-cloud application provisioning, orchestration, automation, and advanced FinOps tools for optimizing cloud costs.
9. What pricing options are available for accessing the report?
Pricing options include single-user, multi-user, and enterprise licenses priced at USD 4750, USD 5250, and USD 8750 respectively.
10. Is the market size provided in terms of value or volume?
The market size is provided in terms of value, measured in Million and volume, measured in Billion.
11. Are there any specific market keywords associated with the report?
Yes, the market keyword associated with the report is "IT Operations Management Market," which aids in identifying and referencing the specific market segment covered.
12. How do I determine which pricing option suits my needs best?
The pricing options vary based on user requirements and access needs. Individual users may opt for single-user licenses, while businesses requiring broader access may choose multi-user or enterprise licenses for cost-effective access to the report.
13. Are there any additional resources or data provided in the IT Operations Management Market report?
While the report offers comprehensive insights, it's advisable to review the specific contents or supplementary materials provided to ascertain if additional resources or data are available.
14. How can I stay updated on further developments or reports in the IT Operations Management Market?
To stay informed about further developments, trends, and reports in the IT Operations Management Market, consider subscribing to industry newsletters, following relevant companies and organizations, or regularly checking reputable industry news sources and publications.
Methodology
Step 1 - Identification of Relevant Samples Size from Population Database


Step 2 - Approaches for Defining Global Market Size (Value, Volume* & Price*)

Note*: In applicable scenarios
Step 3 - Data Sources
Primary Research
- Web Analytics
- Survey Reports
- Research Institute
- Latest Research Reports
- Opinion Leaders
Secondary Research
- Annual Reports
- White Paper
- Latest Press Release
- Industry Association
- Paid Database
- Investor Presentations

Step 4 - Data Triangulation
Involves using different sources of information in order to increase the validity of a study
These sources are likely to be stakeholders in a program - participants, other researchers, program staff, other community members, and so on.
Then we put all data in single framework & apply various statistical tools to find out the dynamic on the market.
During the analysis stage, feedback from the stakeholder groups would be compared to determine areas of agreement as well as areas of divergence


