
Key Insights
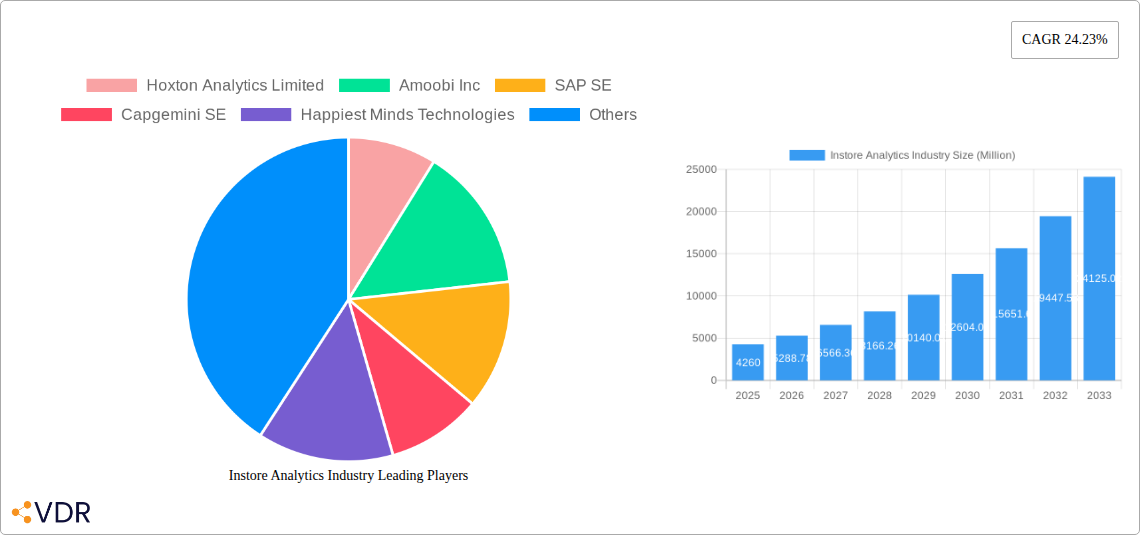
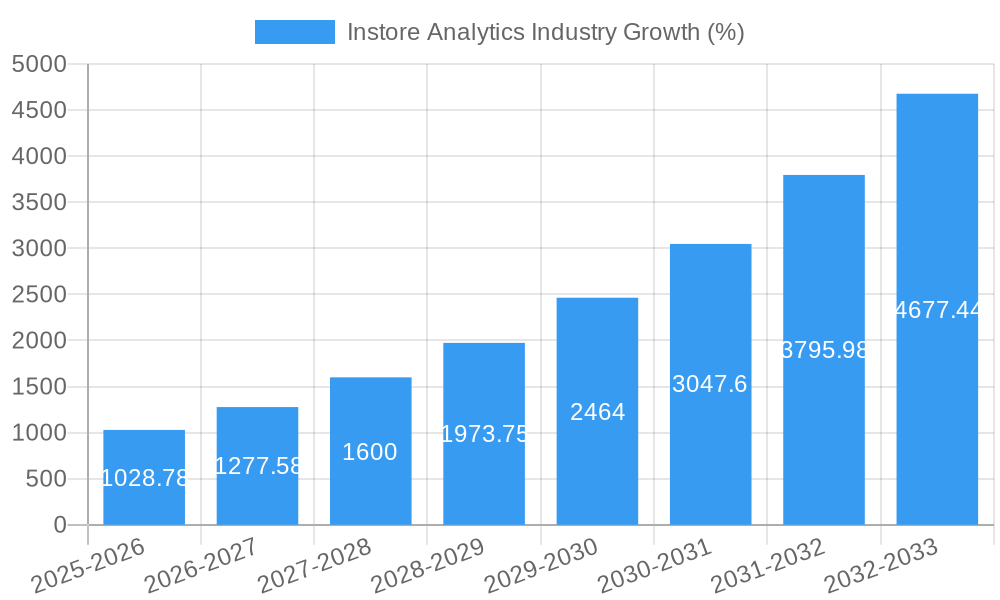
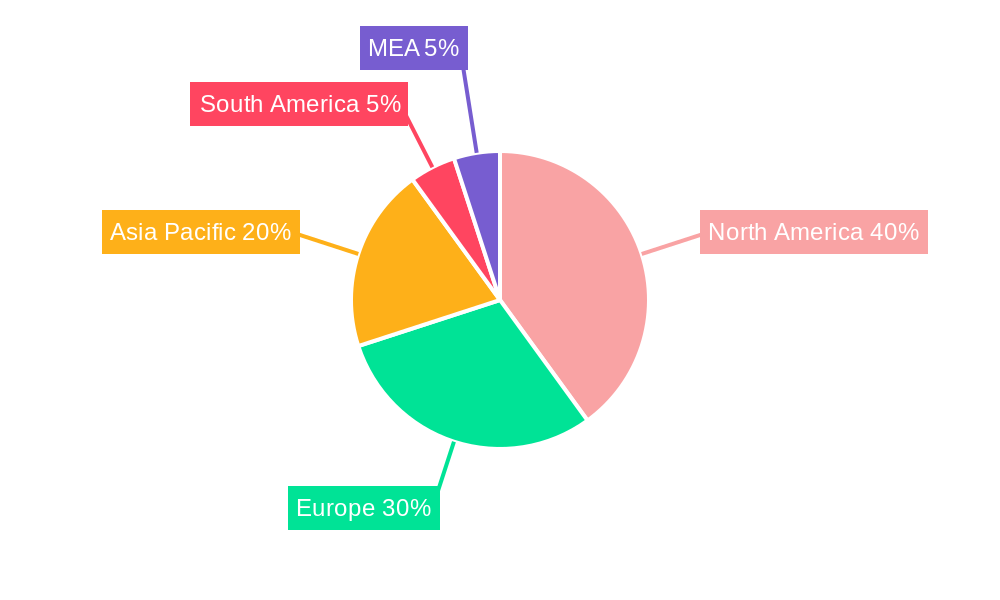
The instore analytics market, valued at $4.26 billion in 2025, is experiencing robust growth, projected to expand at a compound annual growth rate (CAGR) of 24.23% from 2025 to 2033. This significant expansion is driven by the increasing need for retailers to understand customer behavior, optimize store operations, and enhance the overall shopping experience. Key drivers include the rising adoption of advanced technologies like computer vision, AI, and IoT, enabling real-time data collection and analysis. Furthermore, the growing demand for personalized marketing strategies and improved inventory management is fueling market growth. The market is segmented by component (software and services), deployment (cloud and on-premises), organization size (large enterprises and SMEs), and application (customer management, risk and compliance, store operations, merchandise management, and others). Cloud-based solutions are gaining traction due to their scalability and cost-effectiveness. Large enterprises are the primary adopters, though SMEs are increasingly recognizing the value of instore analytics for competitive advantage. Geographically, North America currently holds a dominant market share, followed by Europe and Asia Pacific, with the latter exhibiting the highest growth potential due to increasing retail sector investments and digital transformation initiatives. However, data privacy concerns and the high initial investment costs associated with implementing instore analytics solutions pose potential restraints to market growth. Nevertheless, the overall market outlook remains positive, with continued technological advancements and increasing retailer adoption expected to drive substantial growth throughout the forecast period.
The competitive landscape is characterized by a mix of established players like SAP and Capgemini alongside specialized analytics providers such as Hoxton Analytics, Amoobi, and RetailNext. The market is witnessing strategic partnerships and collaborations between technology providers and retailers to develop tailored solutions. The ongoing focus on improving data security and ensuring compliance with relevant regulations is expected to further shape the market dynamics. The future of instore analytics hinges on the seamless integration of data from multiple sources, the development of more sophisticated analytical models, and the increasing use of artificial intelligence for predictive analytics, enabling retailers to optimize pricing, promotions, and inventory management with greater precision. This, coupled with the growing adoption of omnichannel strategies, will drive sustained growth in the instore analytics market in the coming years.
Instore Analytics Industry Market Report: 2019-2033
This comprehensive report provides a detailed analysis of the Instore Analytics market, encompassing market size, growth trends, competitive landscape, and future outlook. With a focus on parent and child markets, this report is a crucial resource for industry professionals, investors, and strategic decision-makers. The study period covers 2019-2033, with a base year of 2025 and a forecast period of 2025-2033. The historical period analyzed is 2019-2024. The market is segmented by component (Software, Services), deployment (Cloud, On-Premises), organization size (Large Enterprises, Small & Medium Enterprises), and application (Customer Management, Risk and Compliance Management, Store Operations Management, Merchandise Management, Other Applications). Key players include Hoxton Analytics Limited, Amoobi Inc, SAP SE, Capgemini SE, Happiest Minds Technologies, Cloud4Wi Inc, Motionloft Inc, Capillary Technologies, Thinkinside SRL, RetailNext Inc, and Trax Image Recognition.
Instore Analytics Industry Market Dynamics & Structure
The Instore Analytics market is experiencing significant growth driven by the increasing need for retailers to optimize store operations, enhance customer experiences, and improve decision-making. Market concentration is moderate, with several key players competing alongside numerous smaller niche players. Technological innovation, particularly in areas like AI and computer vision, is a major driver of market expansion. Regulatory frameworks related to data privacy and security significantly influence market practices. The market faces competition from traditional market research methods, but the increasing sophistication and cost-effectiveness of Instore Analytics solutions are proving to be advantageous. End-user demographics are broadly distributed across various retail sectors, including grocery, apparel, electronics, and others. The market witnesses frequent M&A activity, reflecting a push for consolidation and expansion.
- Market Concentration: Moderate, with a top 5 market share of xx%.
- Technological Innovation: Rapid advancements in AI, machine learning, and computer vision are driving product innovation.
- Regulatory Frameworks: GDPR, CCPA, and other data privacy regulations influence data collection and usage practices.
- Competitive Substitutes: Traditional market research methods, but Instore Analytics offers superior real-time insights.
- End-User Demographics: Diverse, spanning various retail sectors and business sizes.
- M&A Trends: Significant M&A activity, with xx deals recorded in the last five years, totaling approximately $xx million in value.
Instore Analytics Industry Growth Trends & Insights
The Instore Analytics market is exhibiting strong growth, with a Compound Annual Growth Rate (CAGR) of xx% during the historical period (2019-2024) and an anticipated CAGR of xx% during the forecast period (2025-2033). Market size is estimated to reach $xx million in 2025 and is projected to reach $xx million by 2033. This growth is driven by factors including increasing adoption of cloud-based solutions, rising demand for real-time data insights, and the escalating need for personalized customer experiences. Technological disruptions like the emergence of edge computing and the improvement in the accuracy of computer vision algorithms are accelerating market adoption rates. Consumer behavior shifts towards omnichannel shopping and a preference for personalized offerings further fuel market expansion. Market penetration is expected to increase from xx% in 2025 to xx% by 2033.
Dominant Regions, Countries, or Segments in Instore Analytics Industry
North America currently holds the largest market share in the Instore Analytics industry, followed by Europe and Asia Pacific. The dominance of North America is attributed to early adoption, strong technological infrastructure, and a large number of established retail players. Within segments, the Software component dominates due to its scalability and ease of integration. The Cloud deployment model shows faster growth than On-Premises due to enhanced flexibility and cost-effectiveness. Large Enterprises are the primary adopters, owing to their greater resources and investment capacity, though the SME segment is demonstrating significant growth. Customer Management and Store Operations Management applications are currently the most widely adopted, but Risk and Compliance Management is showing notable upward trends.
- Key Regional Drivers: Strong retail sector, advanced technological infrastructure, supportive government policies (North America).
- Key Segment Drivers: Software's scalability and ease of integration, Cloud's flexibility and cost-effectiveness, Large Enterprises' investment capacity.
- Market Share: North America holds approximately xx% of the market share in 2025, while Europe holds approximately xx% and Asia Pacific approximately xx%.
Instore Analytics Industry Product Landscape
The Instore Analytics product landscape is characterized by a diverse range of solutions offering varying levels of functionality and integration capabilities. Recent innovations focus on AI-powered video analytics, enabling real-time insights into customer behavior, store operations, and inventory management. Advanced analytics dashboards provide intuitive visualizations of key performance indicators (KPIs) and predictive analytics capabilities. The key selling propositions of these solutions are enhanced operational efficiency, improved customer experiences, and optimized decision-making through data-driven insights. Continuous improvements in computer vision technology and the integration of IoT devices are further driving technological advancements in the industry.
Key Drivers, Barriers & Challenges in Instore Analytics Industry
Key Drivers:
- Increasing demand for real-time data insights: Retailers are increasingly seeking real-time data to optimize operations and enhance customer experiences.
- Advancements in AI and Machine Learning: These technologies enable more accurate and insightful data analysis.
- Rising adoption of cloud-based solutions: Cloud-based solutions offer scalability, flexibility, and cost-effectiveness.
Key Challenges:
- Data privacy and security concerns: Regulations like GDPR and CCPA pose significant challenges to data collection and use.
- High initial investment costs: Implementing Instore Analytics solutions can be expensive, especially for small businesses.
- Integration complexities: Integrating Instore Analytics systems with existing IT infrastructure can be complex and time-consuming.
Emerging Opportunities in Instore Analytics Industry
- Expansion into untapped markets: Emerging economies present significant growth opportunities.
- Innovative applications: New applications in areas like loss prevention and personalized marketing are emerging.
- Integration with other technologies: Integration with IoT, blockchain, and AR/VR technologies will unlock new opportunities.
Growth Accelerators in the Instore Analytics Industry Industry
The Instore Analytics market is poised for continued growth, propelled by technological advancements in AI and machine learning, strategic partnerships between technology providers and retailers, and expansion into new geographic markets and applications. The increasing adoption of omnichannel strategies by retailers will further drive demand for sophisticated Instore Analytics solutions capable of unifying online and offline customer experiences.
Key Players Shaping the Instore Analytics Industry Market
- Hoxton Analytics Limited
- Amoobi Inc
- SAP SE
- Capgemini SE
- Happiest Minds Technologies
- Cloud4Wi Inc
- Motionloft Inc
- Capillary Technologies
- Thinkinside SRL
- RetailNext Inc
- Trax Image Recognition
Notable Milestones in Instore Analytics Industry Sector
- December 2022: JRNI partnered with Mad Mobiles to create a unified platform for managing online and in-store customer shopping experiences.
- November 2022: A California-based retail firm acquired The Retail Performance Company from Ipsos, expanding its in-store analytics capabilities in Europe and Asia.
In-Depth Instore Analytics Industry Market Outlook
The future of the Instore Analytics market looks bright, with continued growth driven by technological innovation, increasing demand for data-driven decision-making, and expansion into new markets. Strategic partnerships and mergers and acquisitions will play a crucial role in shaping the market landscape. Opportunities exist in developing innovative solutions that address the evolving needs of retailers and leverage emerging technologies like AI, IoT, and edge computing. The market is expected to see increasing consolidation as larger players acquire smaller firms, leading to increased competition and product differentiation.
Instore Analytics Industry Segmentation
-
1. Component
- 1.1. Software
- 1.2. Services
-
2. Deployment
- 2.1. Cloud
- 2.2. On-Premises
-
3. Organization Size
- 3.1. Large Enterprises
- 3.2. Small & Medium Enterprises
-
4. Application
- 4.1. Customer Management
- 4.2. Risk and Compliance Management
- 4.3. Store Operations Management
- 4.4. Merchandise Management
- 4.5. Other Applications
Instore Analytics Industry Segmentation By Geography
- 1. North America
- 2. Europe
- 3. Asia Pacific
- 4. Latin America
- 5. Middle East and Africa
Instore Analytics Industry REPORT HIGHLIGHTS
| Aspects | Details |
|---|---|
| Study Period | 2019-2033 |
| Base Year | 2024 |
| Estimated Year | 2025 |
| Forecast Period | 2025-2033 |
| Historical Period | 2019-2024 |
| Growth Rate | CAGR of 24.23% from 2019-2033 |
| Segmentation |
|
Table of Contents
- 1. Introduction
- 1.1. Research Scope
- 1.2. Market Segmentation
- 1.3. Research Methodology
- 1.4. Definitions and Assumptions
- 2. Executive Summary
- 2.1. Introduction
- 3. Market Dynamics
- 3.1. Introduction
- 3.2. Market Drivers
- 3.2.1. Increasing advantage of the Cloud; Need for Better Customer Service and Enhanced Shopping Experience; Customer Management Segment to Witness Significant Market Growth
- 3.3. Market Restrains
- 3.3.1. Lack of Personnel Skills
- 3.4. Market Trends
- 3.4.1. Customer Management Segment to Witness Significant Market Growth
- 4. Market Factor Analysis
- 4.1. Porters Five Forces
- 4.2. Supply/Value Chain
- 4.3. PESTEL analysis
- 4.4. Market Entropy
- 4.5. Patent/Trademark Analysis
- 5. Global Instore Analytics Industry Analysis, Insights and Forecast, 2019-2031
- 5.1. Market Analysis, Insights and Forecast - by Component
- 5.1.1. Software
- 5.1.2. Services
- 5.2. Market Analysis, Insights and Forecast - by Deployment
- 5.2.1. Cloud
- 5.2.2. On-Premises
- 5.3. Market Analysis, Insights and Forecast - by Organization Size
- 5.3.1. Large Enterprises
- 5.3.2. Small & Medium Enterprises
- 5.4. Market Analysis, Insights and Forecast - by Application
- 5.4.1. Customer Management
- 5.4.2. Risk and Compliance Management
- 5.4.3. Store Operations Management
- 5.4.4. Merchandise Management
- 5.4.5. Other Applications
- 5.5. Market Analysis, Insights and Forecast - by Region
- 5.5.1. North America
- 5.5.2. Europe
- 5.5.3. Asia Pacific
- 5.5.4. Latin America
- 5.5.5. Middle East and Africa
- 5.1. Market Analysis, Insights and Forecast - by Component
- 6. North America Instore Analytics Industry Analysis, Insights and Forecast, 2019-2031
- 6.1. Market Analysis, Insights and Forecast - by Component
- 6.1.1. Software
- 6.1.2. Services
- 6.2. Market Analysis, Insights and Forecast - by Deployment
- 6.2.1. Cloud
- 6.2.2. On-Premises
- 6.3. Market Analysis, Insights and Forecast - by Organization Size
- 6.3.1. Large Enterprises
- 6.3.2. Small & Medium Enterprises
- 6.4. Market Analysis, Insights and Forecast - by Application
- 6.4.1. Customer Management
- 6.4.2. Risk and Compliance Management
- 6.4.3. Store Operations Management
- 6.4.4. Merchandise Management
- 6.4.5. Other Applications
- 6.1. Market Analysis, Insights and Forecast - by Component
- 7. Europe Instore Analytics Industry Analysis, Insights and Forecast, 2019-2031
- 7.1. Market Analysis, Insights and Forecast - by Component
- 7.1.1. Software
- 7.1.2. Services
- 7.2. Market Analysis, Insights and Forecast - by Deployment
- 7.2.1. Cloud
- 7.2.2. On-Premises
- 7.3. Market Analysis, Insights and Forecast - by Organization Size
- 7.3.1. Large Enterprises
- 7.3.2. Small & Medium Enterprises
- 7.4. Market Analysis, Insights and Forecast - by Application
- 7.4.1. Customer Management
- 7.4.2. Risk and Compliance Management
- 7.4.3. Store Operations Management
- 7.4.4. Merchandise Management
- 7.4.5. Other Applications
- 7.1. Market Analysis, Insights and Forecast - by Component
- 8. Asia Pacific Instore Analytics Industry Analysis, Insights and Forecast, 2019-2031
- 8.1. Market Analysis, Insights and Forecast - by Component
- 8.1.1. Software
- 8.1.2. Services
- 8.2. Market Analysis, Insights and Forecast - by Deployment
- 8.2.1. Cloud
- 8.2.2. On-Premises
- 8.3. Market Analysis, Insights and Forecast - by Organization Size
- 8.3.1. Large Enterprises
- 8.3.2. Small & Medium Enterprises
- 8.4. Market Analysis, Insights and Forecast - by Application
- 8.4.1. Customer Management
- 8.4.2. Risk and Compliance Management
- 8.4.3. Store Operations Management
- 8.4.4. Merchandise Management
- 8.4.5. Other Applications
- 8.1. Market Analysis, Insights and Forecast - by Component
- 9. Latin America Instore Analytics Industry Analysis, Insights and Forecast, 2019-2031
- 9.1. Market Analysis, Insights and Forecast - by Component
- 9.1.1. Software
- 9.1.2. Services
- 9.2. Market Analysis, Insights and Forecast - by Deployment
- 9.2.1. Cloud
- 9.2.2. On-Premises
- 9.3. Market Analysis, Insights and Forecast - by Organization Size
- 9.3.1. Large Enterprises
- 9.3.2. Small & Medium Enterprises
- 9.4. Market Analysis, Insights and Forecast - by Application
- 9.4.1. Customer Management
- 9.4.2. Risk and Compliance Management
- 9.4.3. Store Operations Management
- 9.4.4. Merchandise Management
- 9.4.5. Other Applications
- 9.1. Market Analysis, Insights and Forecast - by Component
- 10. Middle East and Africa Instore Analytics Industry Analysis, Insights and Forecast, 2019-2031
- 10.1. Market Analysis, Insights and Forecast - by Component
- 10.1.1. Software
- 10.1.2. Services
- 10.2. Market Analysis, Insights and Forecast - by Deployment
- 10.2.1. Cloud
- 10.2.2. On-Premises
- 10.3. Market Analysis, Insights and Forecast - by Organization Size
- 10.3.1. Large Enterprises
- 10.3.2. Small & Medium Enterprises
- 10.4. Market Analysis, Insights and Forecast - by Application
- 10.4.1. Customer Management
- 10.4.2. Risk and Compliance Management
- 10.4.3. Store Operations Management
- 10.4.4. Merchandise Management
- 10.4.5. Other Applications
- 10.1. Market Analysis, Insights and Forecast - by Component
- 11. North America Instore Analytics Industry Analysis, Insights and Forecast, 2019-2031
- 11.1. Market Analysis, Insights and Forecast - By Country/Sub-region
- 11.1.1 United States
- 11.1.2 Canada
- 11.1.3 Mexico
- 12. Europe Instore Analytics Industry Analysis, Insights and Forecast, 2019-2031
- 12.1. Market Analysis, Insights and Forecast - By Country/Sub-region
- 12.1.1 Germany
- 12.1.2 United Kingdom
- 12.1.3 France
- 12.1.4 Spain
- 12.1.5 Italy
- 12.1.6 Spain
- 12.1.7 Belgium
- 12.1.8 Netherland
- 12.1.9 Nordics
- 12.1.10 Rest of Europe
- 13. Asia Pacific Instore Analytics Industry Analysis, Insights and Forecast, 2019-2031
- 13.1. Market Analysis, Insights and Forecast - By Country/Sub-region
- 13.1.1 China
- 13.1.2 Japan
- 13.1.3 India
- 13.1.4 South Korea
- 13.1.5 Southeast Asia
- 13.1.6 Australia
- 13.1.7 Indonesia
- 13.1.8 Phillipes
- 13.1.9 Singapore
- 13.1.10 Thailandc
- 13.1.11 Rest of Asia Pacific
- 14. South America Instore Analytics Industry Analysis, Insights and Forecast, 2019-2031
- 14.1. Market Analysis, Insights and Forecast - By Country/Sub-region
- 14.1.1 Brazil
- 14.1.2 Argentina
- 14.1.3 Peru
- 14.1.4 Chile
- 14.1.5 Colombia
- 14.1.6 Ecuador
- 14.1.7 Venezuela
- 14.1.8 Rest of South America
- 15. North America Instore Analytics Industry Analysis, Insights and Forecast, 2019-2031
- 15.1. Market Analysis, Insights and Forecast - By Country/Sub-region
- 15.1.1 United States
- 15.1.2 Canada
- 15.1.3 Mexico
- 16. MEA Instore Analytics Industry Analysis, Insights and Forecast, 2019-2031
- 16.1. Market Analysis, Insights and Forecast - By Country/Sub-region
- 16.1.1 United Arab Emirates
- 16.1.2 Saudi Arabia
- 16.1.3 South Africa
- 16.1.4 Rest of Middle East and Africa
- 17. Competitive Analysis
- 17.1. Global Market Share Analysis 2024
- 17.2. Company Profiles
- 17.2.1 Hoxton Analytics Limited
- 17.2.1.1. Overview
- 17.2.1.2. Products
- 17.2.1.3. SWOT Analysis
- 17.2.1.4. Recent Developments
- 17.2.1.5. Financials (Based on Availability)
- 17.2.2 Amoobi Inc
- 17.2.2.1. Overview
- 17.2.2.2. Products
- 17.2.2.3. SWOT Analysis
- 17.2.2.4. Recent Developments
- 17.2.2.5. Financials (Based on Availability)
- 17.2.3 SAP SE
- 17.2.3.1. Overview
- 17.2.3.2. Products
- 17.2.3.3. SWOT Analysis
- 17.2.3.4. Recent Developments
- 17.2.3.5. Financials (Based on Availability)
- 17.2.4 Capgemini SE
- 17.2.4.1. Overview
- 17.2.4.2. Products
- 17.2.4.3. SWOT Analysis
- 17.2.4.4. Recent Developments
- 17.2.4.5. Financials (Based on Availability)
- 17.2.5 Happiest Minds Technologies
- 17.2.5.1. Overview
- 17.2.5.2. Products
- 17.2.5.3. SWOT Analysis
- 17.2.5.4. Recent Developments
- 17.2.5.5. Financials (Based on Availability)
- 17.2.6 Cloud4Wi Inc
- 17.2.6.1. Overview
- 17.2.6.2. Products
- 17.2.6.3. SWOT Analysis
- 17.2.6.4. Recent Developments
- 17.2.6.5. Financials (Based on Availability)
- 17.2.7 Motionloft Inc
- 17.2.7.1. Overview
- 17.2.7.2. Products
- 17.2.7.3. SWOT Analysis
- 17.2.7.4. Recent Developments
- 17.2.7.5. Financials (Based on Availability)
- 17.2.8 Capillary Technologies
- 17.2.8.1. Overview
- 17.2.8.2. Products
- 17.2.8.3. SWOT Analysis
- 17.2.8.4. Recent Developments
- 17.2.8.5. Financials (Based on Availability)
- 17.2.9 Thinkinside SRL
- 17.2.9.1. Overview
- 17.2.9.2. Products
- 17.2.9.3. SWOT Analysis
- 17.2.9.4. Recent Developments
- 17.2.9.5. Financials (Based on Availability)
- 17.2.10 RetailNext Inc
- 17.2.10.1. Overview
- 17.2.10.2. Products
- 17.2.10.3. SWOT Analysis
- 17.2.10.4. Recent Developments
- 17.2.10.5. Financials (Based on Availability)
- 17.2.11 Trax Image Recognition
- 17.2.11.1. Overview
- 17.2.11.2. Products
- 17.2.11.3. SWOT Analysis
- 17.2.11.4. Recent Developments
- 17.2.11.5. Financials (Based on Availability)
- 17.2.1 Hoxton Analytics Limited
List of Figures
- Figure 1: Global Instore Analytics Industry Revenue Breakdown (Million, %) by Region 2024 & 2032
- Figure 2: North America Instore Analytics Industry Revenue (Million), by Country 2024 & 2032
- Figure 3: North America Instore Analytics Industry Revenue Share (%), by Country 2024 & 2032
- Figure 4: Europe Instore Analytics Industry Revenue (Million), by Country 2024 & 2032
- Figure 5: Europe Instore Analytics Industry Revenue Share (%), by Country 2024 & 2032
- Figure 6: Asia Pacific Instore Analytics Industry Revenue (Million), by Country 2024 & 2032
- Figure 7: Asia Pacific Instore Analytics Industry Revenue Share (%), by Country 2024 & 2032
- Figure 8: South America Instore Analytics Industry Revenue (Million), by Country 2024 & 2032
- Figure 9: South America Instore Analytics Industry Revenue Share (%), by Country 2024 & 2032
- Figure 10: North America Instore Analytics Industry Revenue (Million), by Country 2024 & 2032
- Figure 11: North America Instore Analytics Industry Revenue Share (%), by Country 2024 & 2032
- Figure 12: MEA Instore Analytics Industry Revenue (Million), by Country 2024 & 2032
- Figure 13: MEA Instore Analytics Industry Revenue Share (%), by Country 2024 & 2032
- Figure 14: North America Instore Analytics Industry Revenue (Million), by Component 2024 & 2032
- Figure 15: North America Instore Analytics Industry Revenue Share (%), by Component 2024 & 2032
- Figure 16: North America Instore Analytics Industry Revenue (Million), by Deployment 2024 & 2032
- Figure 17: North America Instore Analytics Industry Revenue Share (%), by Deployment 2024 & 2032
- Figure 18: North America Instore Analytics Industry Revenue (Million), by Organization Size 2024 & 2032
- Figure 19: North America Instore Analytics Industry Revenue Share (%), by Organization Size 2024 & 2032
- Figure 20: North America Instore Analytics Industry Revenue (Million), by Application 2024 & 2032
- Figure 21: North America Instore Analytics Industry Revenue Share (%), by Application 2024 & 2032
- Figure 22: North America Instore Analytics Industry Revenue (Million), by Country 2024 & 2032
- Figure 23: North America Instore Analytics Industry Revenue Share (%), by Country 2024 & 2032
- Figure 24: Europe Instore Analytics Industry Revenue (Million), by Component 2024 & 2032
- Figure 25: Europe Instore Analytics Industry Revenue Share (%), by Component 2024 & 2032
- Figure 26: Europe Instore Analytics Industry Revenue (Million), by Deployment 2024 & 2032
- Figure 27: Europe Instore Analytics Industry Revenue Share (%), by Deployment 2024 & 2032
- Figure 28: Europe Instore Analytics Industry Revenue (Million), by Organization Size 2024 & 2032
- Figure 29: Europe Instore Analytics Industry Revenue Share (%), by Organization Size 2024 & 2032
- Figure 30: Europe Instore Analytics Industry Revenue (Million), by Application 2024 & 2032
- Figure 31: Europe Instore Analytics Industry Revenue Share (%), by Application 2024 & 2032
- Figure 32: Europe Instore Analytics Industry Revenue (Million), by Country 2024 & 2032
- Figure 33: Europe Instore Analytics Industry Revenue Share (%), by Country 2024 & 2032
- Figure 34: Asia Pacific Instore Analytics Industry Revenue (Million), by Component 2024 & 2032
- Figure 35: Asia Pacific Instore Analytics Industry Revenue Share (%), by Component 2024 & 2032
- Figure 36: Asia Pacific Instore Analytics Industry Revenue (Million), by Deployment 2024 & 2032
- Figure 37: Asia Pacific Instore Analytics Industry Revenue Share (%), by Deployment 2024 & 2032
- Figure 38: Asia Pacific Instore Analytics Industry Revenue (Million), by Organization Size 2024 & 2032
- Figure 39: Asia Pacific Instore Analytics Industry Revenue Share (%), by Organization Size 2024 & 2032
- Figure 40: Asia Pacific Instore Analytics Industry Revenue (Million), by Application 2024 & 2032
- Figure 41: Asia Pacific Instore Analytics Industry Revenue Share (%), by Application 2024 & 2032
- Figure 42: Asia Pacific Instore Analytics Industry Revenue (Million), by Country 2024 & 2032
- Figure 43: Asia Pacific Instore Analytics Industry Revenue Share (%), by Country 2024 & 2032
- Figure 44: Latin America Instore Analytics Industry Revenue (Million), by Component 2024 & 2032
- Figure 45: Latin America Instore Analytics Industry Revenue Share (%), by Component 2024 & 2032
- Figure 46: Latin America Instore Analytics Industry Revenue (Million), by Deployment 2024 & 2032
- Figure 47: Latin America Instore Analytics Industry Revenue Share (%), by Deployment 2024 & 2032
- Figure 48: Latin America Instore Analytics Industry Revenue (Million), by Organization Size 2024 & 2032
- Figure 49: Latin America Instore Analytics Industry Revenue Share (%), by Organization Size 2024 & 2032
- Figure 50: Latin America Instore Analytics Industry Revenue (Million), by Application 2024 & 2032
- Figure 51: Latin America Instore Analytics Industry Revenue Share (%), by Application 2024 & 2032
- Figure 52: Latin America Instore Analytics Industry Revenue (Million), by Country 2024 & 2032
- Figure 53: Latin America Instore Analytics Industry Revenue Share (%), by Country 2024 & 2032
- Figure 54: Middle East and Africa Instore Analytics Industry Revenue (Million), by Component 2024 & 2032
- Figure 55: Middle East and Africa Instore Analytics Industry Revenue Share (%), by Component 2024 & 2032
- Figure 56: Middle East and Africa Instore Analytics Industry Revenue (Million), by Deployment 2024 & 2032
- Figure 57: Middle East and Africa Instore Analytics Industry Revenue Share (%), by Deployment 2024 & 2032
- Figure 58: Middle East and Africa Instore Analytics Industry Revenue (Million), by Organization Size 2024 & 2032
- Figure 59: Middle East and Africa Instore Analytics Industry Revenue Share (%), by Organization Size 2024 & 2032
- Figure 60: Middle East and Africa Instore Analytics Industry Revenue (Million), by Application 2024 & 2032
- Figure 61: Middle East and Africa Instore Analytics Industry Revenue Share (%), by Application 2024 & 2032
- Figure 62: Middle East and Africa Instore Analytics Industry Revenue (Million), by Country 2024 & 2032
- Figure 63: Middle East and Africa Instore Analytics Industry Revenue Share (%), by Country 2024 & 2032
List of Tables
- Table 1: Global Instore Analytics Industry Revenue Million Forecast, by Region 2019 & 2032
- Table 2: Global Instore Analytics Industry Revenue Million Forecast, by Component 2019 & 2032
- Table 3: Global Instore Analytics Industry Revenue Million Forecast, by Deployment 2019 & 2032
- Table 4: Global Instore Analytics Industry Revenue Million Forecast, by Organization Size 2019 & 2032
- Table 5: Global Instore Analytics Industry Revenue Million Forecast, by Application 2019 & 2032
- Table 6: Global Instore Analytics Industry Revenue Million Forecast, by Region 2019 & 2032
- Table 7: Global Instore Analytics Industry Revenue Million Forecast, by Country 2019 & 2032
- Table 8: United States Instore Analytics Industry Revenue (Million) Forecast, by Application 2019 & 2032
- Table 9: Canada Instore Analytics Industry Revenue (Million) Forecast, by Application 2019 & 2032
- Table 10: Mexico Instore Analytics Industry Revenue (Million) Forecast, by Application 2019 & 2032
- Table 11: Global Instore Analytics Industry Revenue Million Forecast, by Country 2019 & 2032
- Table 12: Germany Instore Analytics Industry Revenue (Million) Forecast, by Application 2019 & 2032
- Table 13: United Kingdom Instore Analytics Industry Revenue (Million) Forecast, by Application 2019 & 2032
- Table 14: France Instore Analytics Industry Revenue (Million) Forecast, by Application 2019 & 2032
- Table 15: Spain Instore Analytics Industry Revenue (Million) Forecast, by Application 2019 & 2032
- Table 16: Italy Instore Analytics Industry Revenue (Million) Forecast, by Application 2019 & 2032
- Table 17: Spain Instore Analytics Industry Revenue (Million) Forecast, by Application 2019 & 2032
- Table 18: Belgium Instore Analytics Industry Revenue (Million) Forecast, by Application 2019 & 2032
- Table 19: Netherland Instore Analytics Industry Revenue (Million) Forecast, by Application 2019 & 2032
- Table 20: Nordics Instore Analytics Industry Revenue (Million) Forecast, by Application 2019 & 2032
- Table 21: Rest of Europe Instore Analytics Industry Revenue (Million) Forecast, by Application 2019 & 2032
- Table 22: Global Instore Analytics Industry Revenue Million Forecast, by Country 2019 & 2032
- Table 23: China Instore Analytics Industry Revenue (Million) Forecast, by Application 2019 & 2032
- Table 24: Japan Instore Analytics Industry Revenue (Million) Forecast, by Application 2019 & 2032
- Table 25: India Instore Analytics Industry Revenue (Million) Forecast, by Application 2019 & 2032
- Table 26: South Korea Instore Analytics Industry Revenue (Million) Forecast, by Application 2019 & 2032
- Table 27: Southeast Asia Instore Analytics Industry Revenue (Million) Forecast, by Application 2019 & 2032
- Table 28: Australia Instore Analytics Industry Revenue (Million) Forecast, by Application 2019 & 2032
- Table 29: Indonesia Instore Analytics Industry Revenue (Million) Forecast, by Application 2019 & 2032
- Table 30: Phillipes Instore Analytics Industry Revenue (Million) Forecast, by Application 2019 & 2032
- Table 31: Singapore Instore Analytics Industry Revenue (Million) Forecast, by Application 2019 & 2032
- Table 32: Thailandc Instore Analytics Industry Revenue (Million) Forecast, by Application 2019 & 2032
- Table 33: Rest of Asia Pacific Instore Analytics Industry Revenue (Million) Forecast, by Application 2019 & 2032
- Table 34: Global Instore Analytics Industry Revenue Million Forecast, by Country 2019 & 2032
- Table 35: Brazil Instore Analytics Industry Revenue (Million) Forecast, by Application 2019 & 2032
- Table 36: Argentina Instore Analytics Industry Revenue (Million) Forecast, by Application 2019 & 2032
- Table 37: Peru Instore Analytics Industry Revenue (Million) Forecast, by Application 2019 & 2032
- Table 38: Chile Instore Analytics Industry Revenue (Million) Forecast, by Application 2019 & 2032
- Table 39: Colombia Instore Analytics Industry Revenue (Million) Forecast, by Application 2019 & 2032
- Table 40: Ecuador Instore Analytics Industry Revenue (Million) Forecast, by Application 2019 & 2032
- Table 41: Venezuela Instore Analytics Industry Revenue (Million) Forecast, by Application 2019 & 2032
- Table 42: Rest of South America Instore Analytics Industry Revenue (Million) Forecast, by Application 2019 & 2032
- Table 43: Global Instore Analytics Industry Revenue Million Forecast, by Country 2019 & 2032
- Table 44: United States Instore Analytics Industry Revenue (Million) Forecast, by Application 2019 & 2032
- Table 45: Canada Instore Analytics Industry Revenue (Million) Forecast, by Application 2019 & 2032
- Table 46: Mexico Instore Analytics Industry Revenue (Million) Forecast, by Application 2019 & 2032
- Table 47: Global Instore Analytics Industry Revenue Million Forecast, by Country 2019 & 2032
- Table 48: United Arab Emirates Instore Analytics Industry Revenue (Million) Forecast, by Application 2019 & 2032
- Table 49: Saudi Arabia Instore Analytics Industry Revenue (Million) Forecast, by Application 2019 & 2032
- Table 50: South Africa Instore Analytics Industry Revenue (Million) Forecast, by Application 2019 & 2032
- Table 51: Rest of Middle East and Africa Instore Analytics Industry Revenue (Million) Forecast, by Application 2019 & 2032
- Table 52: Global Instore Analytics Industry Revenue Million Forecast, by Component 2019 & 2032
- Table 53: Global Instore Analytics Industry Revenue Million Forecast, by Deployment 2019 & 2032
- Table 54: Global Instore Analytics Industry Revenue Million Forecast, by Organization Size 2019 & 2032
- Table 55: Global Instore Analytics Industry Revenue Million Forecast, by Application 2019 & 2032
- Table 56: Global Instore Analytics Industry Revenue Million Forecast, by Country 2019 & 2032
- Table 57: Global Instore Analytics Industry Revenue Million Forecast, by Component 2019 & 2032
- Table 58: Global Instore Analytics Industry Revenue Million Forecast, by Deployment 2019 & 2032
- Table 59: Global Instore Analytics Industry Revenue Million Forecast, by Organization Size 2019 & 2032
- Table 60: Global Instore Analytics Industry Revenue Million Forecast, by Application 2019 & 2032
- Table 61: Global Instore Analytics Industry Revenue Million Forecast, by Country 2019 & 2032
- Table 62: Global Instore Analytics Industry Revenue Million Forecast, by Component 2019 & 2032
- Table 63: Global Instore Analytics Industry Revenue Million Forecast, by Deployment 2019 & 2032
- Table 64: Global Instore Analytics Industry Revenue Million Forecast, by Organization Size 2019 & 2032
- Table 65: Global Instore Analytics Industry Revenue Million Forecast, by Application 2019 & 2032
- Table 66: Global Instore Analytics Industry Revenue Million Forecast, by Country 2019 & 2032
- Table 67: Global Instore Analytics Industry Revenue Million Forecast, by Component 2019 & 2032
- Table 68: Global Instore Analytics Industry Revenue Million Forecast, by Deployment 2019 & 2032
- Table 69: Global Instore Analytics Industry Revenue Million Forecast, by Organization Size 2019 & 2032
- Table 70: Global Instore Analytics Industry Revenue Million Forecast, by Application 2019 & 2032
- Table 71: Global Instore Analytics Industry Revenue Million Forecast, by Country 2019 & 2032
- Table 72: Global Instore Analytics Industry Revenue Million Forecast, by Component 2019 & 2032
- Table 73: Global Instore Analytics Industry Revenue Million Forecast, by Deployment 2019 & 2032
- Table 74: Global Instore Analytics Industry Revenue Million Forecast, by Organization Size 2019 & 2032
- Table 75: Global Instore Analytics Industry Revenue Million Forecast, by Application 2019 & 2032
- Table 76: Global Instore Analytics Industry Revenue Million Forecast, by Country 2019 & 2032
Frequently Asked Questions
1. What is the projected Compound Annual Growth Rate (CAGR) of the Instore Analytics Industry?
The projected CAGR is approximately 24.23%.
2. Which companies are prominent players in the Instore Analytics Industry?
Key companies in the market include Hoxton Analytics Limited, Amoobi Inc, SAP SE, Capgemini SE, Happiest Minds Technologies, Cloud4Wi Inc, Motionloft Inc, Capillary Technologies, Thinkinside SRL, RetailNext Inc, Trax Image Recognition.
3. What are the main segments of the Instore Analytics Industry?
The market segments include Component, Deployment, Organization Size, Application.
4. Can you provide details about the market size?
The market size is estimated to be USD 4.26 Million as of 2022.
5. What are some drivers contributing to market growth?
Increasing advantage of the Cloud; Need for Better Customer Service and Enhanced Shopping Experience; Customer Management Segment to Witness Significant Market Growth.
6. What are the notable trends driving market growth?
Customer Management Segment to Witness Significant Market Growth.
7. Are there any restraints impacting market growth?
Lack of Personnel Skills.
8. Can you provide examples of recent developments in the market?
December 2022 - JRNI, a leading customer engagement platform, partnered with Mad Mobiles, a Retail associate platform for managing online and in-store customer shopping experiences. This integration would provide clients with a complete solution to replicate an in-person, in-store shopping experience from anywhere.
9. What pricing options are available for accessing the report?
Pricing options include single-user, multi-user, and enterprise licenses priced at USD 4750, USD 5250, and USD 8750 respectively.
10. Is the market size provided in terms of value or volume?
The market size is provided in terms of value, measured in Million.
11. Are there any specific market keywords associated with the report?
Yes, the market keyword associated with the report is "Instore Analytics Industry," which aids in identifying and referencing the specific market segment covered.
12. How do I determine which pricing option suits my needs best?
The pricing options vary based on user requirements and access needs. Individual users may opt for single-user licenses, while businesses requiring broader access may choose multi-user or enterprise licenses for cost-effective access to the report.
13. Are there any additional resources or data provided in the Instore Analytics Industry report?
While the report offers comprehensive insights, it's advisable to review the specific contents or supplementary materials provided to ascertain if additional resources or data are available.
14. How can I stay updated on further developments or reports in the Instore Analytics Industry?
To stay informed about further developments, trends, and reports in the Instore Analytics Industry, consider subscribing to industry newsletters, following relevant companies and organizations, or regularly checking reputable industry news sources and publications.
Methodology
Step 1 - Identification of Relevant Samples Size from Population Database


Step 2 - Approaches for Defining Global Market Size (Value, Volume* & Price*)

Note*: In applicable scenarios
Step 3 - Data Sources
Primary Research
- Web Analytics
- Survey Reports
- Research Institute
- Latest Research Reports
- Opinion Leaders
Secondary Research
- Annual Reports
- White Paper
- Latest Press Release
- Industry Association
- Paid Database
- Investor Presentations

Step 4 - Data Triangulation
Involves using different sources of information in order to increase the validity of a study
These sources are likely to be stakeholders in a program - participants, other researchers, program staff, other community members, and so on.
Then we put all data in single framework & apply various statistical tools to find out the dynamic on the market.
During the analysis stage, feedback from the stakeholder groups would be compared to determine areas of agreement as well as areas of divergence


