
Key Insights
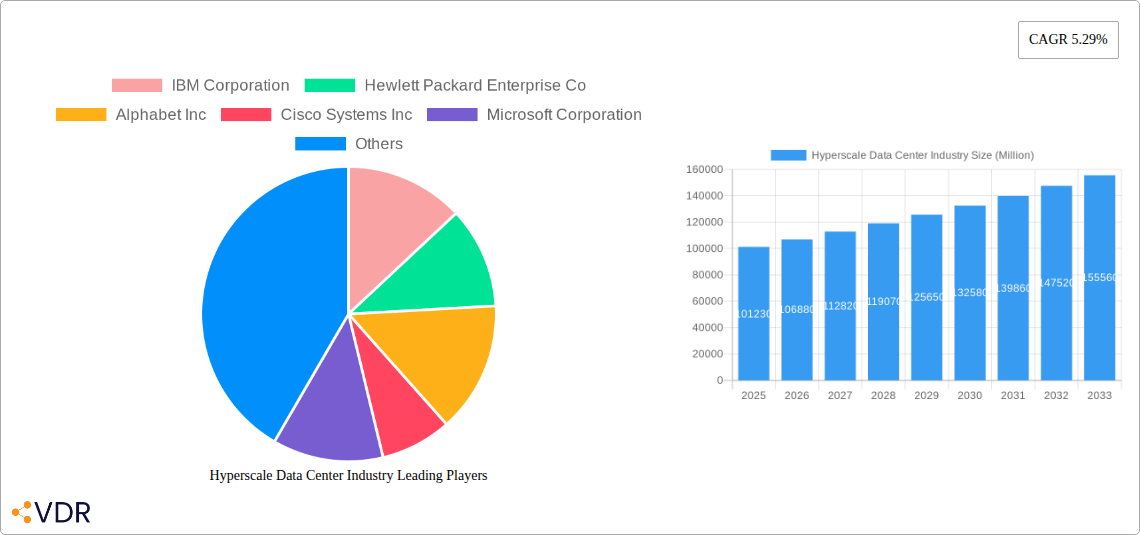
The hyperscale data center market, valued at $101.23 billion in 2025, is experiencing robust growth, projected to expand at a compound annual growth rate (CAGR) of 5.29% from 2025 to 2033. This expansion is driven by several key factors. The escalating demand for cloud computing services fuels the need for massive data storage and processing capabilities, directly impacting hyperscale data center construction and expansion. Furthermore, the proliferation of big data analytics, artificial intelligence (AI), and the Internet of Things (IoT) are generating exponential data volumes, necessitating the development of highly scalable and efficient data center infrastructure. Increased adoption of edge computing, bringing data processing closer to the source, is also contributing to market growth, though it may slightly alter the geographic distribution of data centers. Finally, the ongoing digital transformation across various industries, from finance and healthcare to retail and manufacturing, necessitates robust and reliable data center solutions, further boosting market demand.
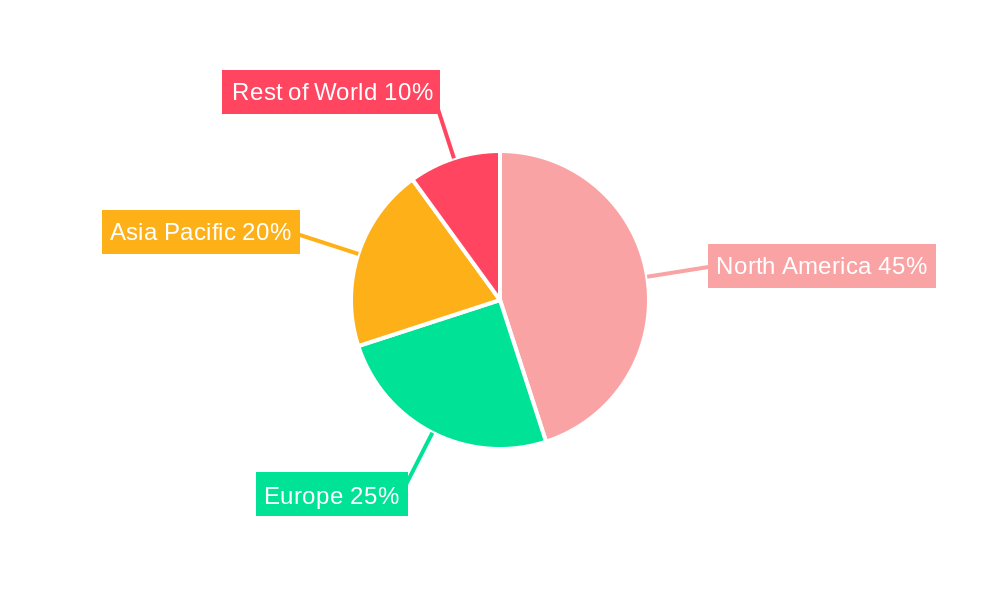
Significant regional variations exist within the market. North America, encompassing the United States and Canada, currently holds a substantial market share, driven by a mature technological infrastructure and a high concentration of major hyperscale providers like Amazon Web Services, Microsoft, and Google. However, Asia-Pacific, particularly China, is witnessing rapid growth, fueled by increasing digital adoption and government initiatives promoting digital infrastructure development. Europe is another key market, with growth driven by increasing cloud adoption across various sectors and the expanding presence of major technology companies. Competitive pressures remain high, with key players such as IBM, Hewlett Packard Enterprise, Cisco, and Huawei continuously vying for market share through technological innovation and strategic partnerships. The market's segmentation by end-user (enterprises and colocation providers) reflects the diverse needs and deployment models within the industry. The forecast period of 2025-2033 promises continued expansion, driven by ongoing technological advancements and the unrelenting growth of data generation across the globe.
Hyperscale Data Center Industry Market Report: 2019-2033
This comprehensive report provides a detailed analysis of the hyperscale data center industry, encompassing market dynamics, growth trends, regional dominance, product landscape, key players, and future outlook. The study period covers 2019-2033, with 2025 as the base and estimated year. The report segments the market by country (United States, Canada, China, Japan, Australia, United Kingdom, Germany, Other Countries) and end-user (Enterprises, Colocation Providers), offering granular insights into this rapidly evolving sector. The total market size is projected to reach xx Million by 2033.
Hyperscale Data Center Industry Market Dynamics & Structure
The hyperscale data center market is characterized by high concentration among major players and rapid technological innovation. The market is witnessing significant mergers and acquisitions (M&A) activity, driven by the need for expansion and enhanced capabilities. Regulatory frameworks, particularly around data sovereignty and security, significantly influence market development. The industry faces competition from alternative cloud solutions, but the demand for high-capacity, low-latency data storage continues to drive growth.
- Market Concentration: High, with top 10 players holding approximately 75% market share (2025 estimate).
- Technological Innovation Drivers: AI, machine learning, edge computing, and 5G deployment are major drivers.
- Regulatory Frameworks: Data privacy regulations (GDPR, CCPA) and cross-border data transfer rules influence investment decisions.
- Competitive Product Substitutes: Cloud services, distributed ledger technology (DLT).
- End-User Demographics: A significant portion of demand comes from large enterprises (60%) and colocation providers (40%).
- M&A Trends: An average of xx M&A deals annually over the past five years, with deal values exceeding xx Million annually. Consolidation is expected to continue.
Hyperscale Data Center Industry Growth Trends & Insights
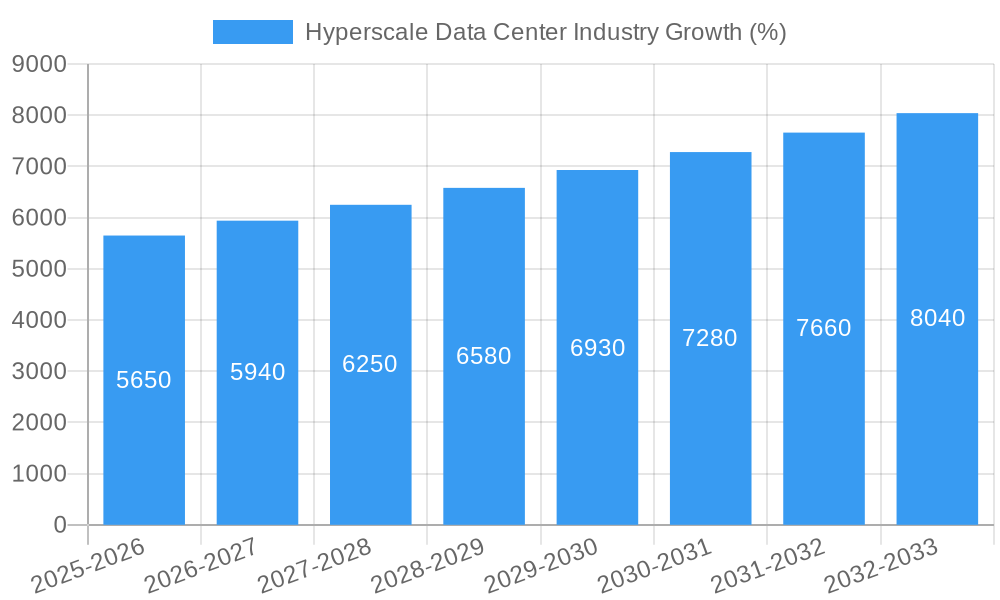
The hyperscale data center market exhibits strong growth, driven by the exponential increase in data generation and the rising adoption of cloud computing and digital transformation initiatives across various sectors. The market is experiencing significant technological disruptions, including the adoption of AI-powered solutions for data center optimization and the development of more energy-efficient infrastructure. Shifting consumer behavior, such as increased reliance on streaming services and the Internet of Things (IoT), fuels ongoing demand.
The market is expected to maintain a CAGR of xx% during the forecast period (2025-2033), reaching a projected market value of xx Million by 2033. Market penetration in key regions is increasing steadily, with the highest rates observed in North America and Asia. Technological advancements, such as liquid cooling and AI-driven resource optimization, are shaping the future of hyperscale data centers and improving efficiency.
Dominant Regions, Countries, or Segments in Hyperscale Data Center Industry
The United States currently holds the largest market share in the hyperscale data center industry, followed by China. However, Asia-Pacific is poised for substantial growth, driven by increasing digitalization and supportive government policies. Within end-user segments, enterprises are the primary driver of demand due to their increasing reliance on cloud-based services and data analytics. Colocation providers represent a significant and growing segment, facilitating efficient data center access for multiple users.
- Key Drivers (United States): Robust digital infrastructure, large pool of tech talent, favorable regulatory environment.
- Key Drivers (China): Government initiatives promoting digital economy, expanding domestic technology sector.
- Key Drivers (Asia-Pacific): Rapid economic growth, increasing internet penetration, investments in 5G infrastructure.
- Key Drivers (Enterprises): Cloud adoption, data analytics, digital transformation initiatives.
- Key Drivers (Colocation Providers): Growing demand for scalable and reliable data center space.
Hyperscale Data Center Industry Product Landscape
Hyperscale data centers are characterized by massive scale, high density, and advanced technologies. Innovations include liquid cooling systems, AI-powered resource management, and advanced security features. These solutions offer significant improvements in efficiency, reliability, and scalability. Unique selling propositions often focus on sustainability, cost-effectiveness, and seamless integration with cloud platforms.
Key Drivers, Barriers & Challenges in Hyperscale Data Center Industry
Key Drivers:
- Increased demand for cloud services and big data analytics.
- Growth of the IoT and connected devices.
- Government initiatives supporting digital infrastructure development.
- Advancements in virtualization and automation technologies.
Key Challenges:
- High infrastructure costs (estimated xx Million annually in new build costs).
- Energy consumption and sustainability concerns.
- Data security and privacy regulations.
- Skilled labor shortages.
Emerging Opportunities in Hyperscale Data Center Industry
- Expansion into underserved markets (e.g., Africa, Latin America).
- Development of edge data centers for low-latency applications.
- Integration of renewable energy sources to improve sustainability.
- AI-powered data center management and optimization.
Growth Accelerators in the Hyperscale Data Center Industry Industry
Technological breakthroughs in areas such as AI, machine learning, and edge computing are driving significant advancements in data center technology. Strategic partnerships between hyperscale providers and technology companies are facilitating innovation and market expansion. Increased investment in data center infrastructure, coupled with supportive government policies, is creating a favorable environment for long-term growth.
Key Players Shaping the Hyperscale Data Center Industry Market
- IBM Corporation
- Hewlett Packard Enterprise Co
- Alphabet Inc
- Cisco Systems Inc
- Microsoft Corporation
- Amazon Web Services Inc
- Huawei Technologies Co
- Quanta Computer Inc
- Alibaba Group
- Facebook Inc
- Nvidia Corporation
Notable Milestones in Hyperscale Data Center Industry Sector
- November 2022: BDx, Indosat Ooredoo Hutchison, and Aplikanusa Lintasarta announce a 100MW data center complex in Indonesia.
- June 2022: Equinix and PGIM Real Estate open a USD 575 Million xScale data center in Sydney.
- May 2022: NTT Ltd launches a new hyperscale data center in Navi Mumbai, India.
- March 2022: Yondr Group announces a 200MW hyperscale campus in Malaysia.
In-Depth Hyperscale Data Center Industry Market Outlook
The future of the hyperscale data center market is promising, with significant growth potential driven by continued digital transformation, expansion into emerging markets, and technological advancements. Strategic opportunities exist for companies that can offer sustainable, cost-effective, and secure data center solutions. The increasing demand for edge computing and AI-powered services will further fuel market expansion in the coming years, creating new opportunities for innovation and market leadership.
Hyperscale Data Center Industry Segmentation
-
1. Data Center Type
- 1.1. Hyperscale Self-Build
- 1.2. Hyperscale Colocation
Hyperscale Data Center Industry Segmentation By Geography
-
1. North America
- 1.1. US
- 1.2. Canada
- 1.3. Rest of North America
-
2. Europe
- 2.1. Germany
- 2.2. UK
- 2.3. France
- 2.4. Netherlands
- 2.5. Ireland
- 2.6. Spain
- 2.7. Italy
- 2.8. Rest of Europe
-
3. Asia Pacific
- 3.1. India
- 3.2. China
- 3.3. Japan
- 3.4. Singapore
- 3.5. Australia
- 3.6. Indonesia
- 3.7. Malaysia
- 3.8. Thailand
- 3.9. Rest of Asia Pacific
-
4. South America
- 4.1. Brazil
- 4.2. Chile
- 4.3. Rest of South America
-
5. Middle East
- 5.1. United Arab Emirates
- 5.2. Saudi Arabia
- 5.3. Rest of Middle East
Hyperscale Data Center Industry REPORT HIGHLIGHTS
| Aspects | Details |
|---|---|
| Study Period | 2019-2033 |
| Base Year | 2024 |
| Estimated Year | 2025 |
| Forecast Period | 2025-2033 |
| Historical Period | 2019-2024 |
| Growth Rate | CAGR of 5.29% from 2019-2033 |
| Segmentation |
|
Table of Contents
- 1. Introduction
- 1.1. Research Scope
- 1.2. Market Segmentation
- 1.3. Research Methodology
- 1.4. Definitions and Assumptions
- 2. Executive Summary
- 2.1. Introduction
- 3. Market Dynamics
- 3.1. Introduction
- 3.2. Market Drivers
- 3.2.1. Growing Demand for Cloud Computing and Other High Performance Technologies
- 3.3. Market Restrains
- 3.3.1. High Costs and Operational Concerns; Concerns related to Geoprivacy and Confidential Data
- 3.4. Market Trends
- 3.4.1. Growing Demand for Cloud Computing and Other Hight Performance Technologies Driving the Market
- 4. Market Factor Analysis
- 4.1. Porters Five Forces
- 4.2. Supply/Value Chain
- 4.3. PESTEL analysis
- 4.4. Market Entropy
- 4.5. Patent/Trademark Analysis
- 5. Global Hyperscale Data Center Industry Analysis, Insights and Forecast, 2019-2031
- 5.1. Market Analysis, Insights and Forecast - by Data Center Type
- 5.1.1. Hyperscale Self-Build
- 5.1.2. Hyperscale Colocation
- 5.2. Market Analysis, Insights and Forecast - by Region
- 5.2.1. North America
- 5.2.2. Europe
- 5.2.3. Asia Pacific
- 5.2.4. South America
- 5.2.5. Middle East
- 5.1. Market Analysis, Insights and Forecast - by Data Center Type
- 6. North America Hyperscale Data Center Industry Analysis, Insights and Forecast, 2019-2031
- 6.1. Market Analysis, Insights and Forecast - by Data Center Type
- 6.1.1. Hyperscale Self-Build
- 6.1.2. Hyperscale Colocation
- 6.1. Market Analysis, Insights and Forecast - by Data Center Type
- 7. Europe Hyperscale Data Center Industry Analysis, Insights and Forecast, 2019-2031
- 7.1. Market Analysis, Insights and Forecast - by Data Center Type
- 7.1.1. Hyperscale Self-Build
- 7.1.2. Hyperscale Colocation
- 7.1. Market Analysis, Insights and Forecast - by Data Center Type
- 8. Asia Pacific Hyperscale Data Center Industry Analysis, Insights and Forecast, 2019-2031
- 8.1. Market Analysis, Insights and Forecast - by Data Center Type
- 8.1.1. Hyperscale Self-Build
- 8.1.2. Hyperscale Colocation
- 8.1. Market Analysis, Insights and Forecast - by Data Center Type
- 9. South America Hyperscale Data Center Industry Analysis, Insights and Forecast, 2019-2031
- 9.1. Market Analysis, Insights and Forecast - by Data Center Type
- 9.1.1. Hyperscale Self-Build
- 9.1.2. Hyperscale Colocation
- 9.1. Market Analysis, Insights and Forecast - by Data Center Type
- 10. Middle East Hyperscale Data Center Industry Analysis, Insights and Forecast, 2019-2031
- 10.1. Market Analysis, Insights and Forecast - by Data Center Type
- 10.1.1. Hyperscale Self-Build
- 10.1.2. Hyperscale Colocation
- 10.1. Market Analysis, Insights and Forecast - by Data Center Type
- 11. North America Hyperscale Data Center Industry Analysis, Insights and Forecast, 2019-2031
- 11.1. Market Analysis, Insights and Forecast - By Country/Sub-region
- 11.1.1 United States
- 11.1.2 Canada
- 11.1.3 Mexico
- 12. Europe Hyperscale Data Center Industry Analysis, Insights and Forecast, 2019-2031
- 12.1. Market Analysis, Insights and Forecast - By Country/Sub-region
- 12.1.1 Germany
- 12.1.2 United Kingdom
- 12.1.3 France
- 12.1.4 Spain
- 12.1.5 Italy
- 12.1.6 Spain
- 12.1.7 Belgium
- 12.1.8 Netherland
- 12.1.9 Nordics
- 12.1.10 Rest of Europe
- 13. Asia Pacific Hyperscale Data Center Industry Analysis, Insights and Forecast, 2019-2031
- 13.1. Market Analysis, Insights and Forecast - By Country/Sub-region
- 13.1.1 China
- 13.1.2 Japan
- 13.1.3 India
- 13.1.4 South Korea
- 13.1.5 Southeast Asia
- 13.1.6 Australia
- 13.1.7 Indonesia
- 13.1.8 Phillipes
- 13.1.9 Singapore
- 13.1.10 Thailandc
- 13.1.11 Rest of Asia Pacific
- 14. South America Hyperscale Data Center Industry Analysis, Insights and Forecast, 2019-2031
- 14.1. Market Analysis, Insights and Forecast - By Country/Sub-region
- 14.1.1 Brazil
- 14.1.2 Argentina
- 14.1.3 Peru
- 14.1.4 Chile
- 14.1.5 Colombia
- 14.1.6 Ecuador
- 14.1.7 Venezuela
- 14.1.8 Rest of South America
- 15. North America Hyperscale Data Center Industry Analysis, Insights and Forecast, 2019-2031
- 15.1. Market Analysis, Insights and Forecast - By Country/Sub-region
- 15.1.1 United States
- 15.1.2 Canada
- 15.1.3 Mexico
- 16. MEA Hyperscale Data Center Industry Analysis, Insights and Forecast, 2019-2031
- 16.1. Market Analysis, Insights and Forecast - By Country/Sub-region
- 16.1.1 United Arab Emirates
- 16.1.2 Saudi Arabia
- 16.1.3 South Africa
- 16.1.4 Rest of Middle East and Africa
- 17. Competitive Analysis
- 17.1. Global Market Share Analysis 2024
- 17.2. Company Profiles
- 17.2.1 IBM Corporation
- 17.2.1.1. Overview
- 17.2.1.2. Products
- 17.2.1.3. SWOT Analysis
- 17.2.1.4. Recent Developments
- 17.2.1.5. Financials (Based on Availability)
- 17.2.2 Hewlett Packard Enterprise Co
- 17.2.2.1. Overview
- 17.2.2.2. Products
- 17.2.2.3. SWOT Analysis
- 17.2.2.4. Recent Developments
- 17.2.2.5. Financials (Based on Availability)
- 17.2.3 Alphabet Inc
- 17.2.3.1. Overview
- 17.2.3.2. Products
- 17.2.3.3. SWOT Analysis
- 17.2.3.4. Recent Developments
- 17.2.3.5. Financials (Based on Availability)
- 17.2.4 Cisco Systems Inc
- 17.2.4.1. Overview
- 17.2.4.2. Products
- 17.2.4.3. SWOT Analysis
- 17.2.4.4. Recent Developments
- 17.2.4.5. Financials (Based on Availability)
- 17.2.5 Microsoft Corporation
- 17.2.5.1. Overview
- 17.2.5.2. Products
- 17.2.5.3. SWOT Analysis
- 17.2.5.4. Recent Developments
- 17.2.5.5. Financials (Based on Availability)
- 17.2.6 Amazon Web Services Inc
- 17.2.6.1. Overview
- 17.2.6.2. Products
- 17.2.6.3. SWOT Analysis
- 17.2.6.4. Recent Developments
- 17.2.6.5. Financials (Based on Availability)
- 17.2.7 Huawei Technologies Co
- 17.2.7.1. Overview
- 17.2.7.2. Products
- 17.2.7.3. SWOT Analysis
- 17.2.7.4. Recent Developments
- 17.2.7.5. Financials (Based on Availability)
- 17.2.8 Quanta Computer Inc
- 17.2.8.1. Overview
- 17.2.8.2. Products
- 17.2.8.3. SWOT Analysis
- 17.2.8.4. Recent Developments
- 17.2.8.5. Financials (Based on Availability)
- 17.2.9 Alibaba Group
- 17.2.9.1. Overview
- 17.2.9.2. Products
- 17.2.9.3. SWOT Analysis
- 17.2.9.4. Recent Developments
- 17.2.9.5. Financials (Based on Availability)
- 17.2.10 Facebook Inc
- 17.2.10.1. Overview
- 17.2.10.2. Products
- 17.2.10.3. SWOT Analysis
- 17.2.10.4. Recent Developments
- 17.2.10.5. Financials (Based on Availability)
- 17.2.11 Nvidia Corporation
- 17.2.11.1. Overview
- 17.2.11.2. Products
- 17.2.11.3. SWOT Analysis
- 17.2.11.4. Recent Developments
- 17.2.11.5. Financials (Based on Availability)
- 17.2.1 IBM Corporation
List of Figures
- Figure 1: Global Hyperscale Data Center Industry Revenue Breakdown (Million, %) by Region 2024 & 2032
- Figure 2: North America Hyperscale Data Center Industry Revenue (Million), by Country 2024 & 2032
- Figure 3: North America Hyperscale Data Center Industry Revenue Share (%), by Country 2024 & 2032
- Figure 4: Europe Hyperscale Data Center Industry Revenue (Million), by Country 2024 & 2032
- Figure 5: Europe Hyperscale Data Center Industry Revenue Share (%), by Country 2024 & 2032
- Figure 6: Asia Pacific Hyperscale Data Center Industry Revenue (Million), by Country 2024 & 2032
- Figure 7: Asia Pacific Hyperscale Data Center Industry Revenue Share (%), by Country 2024 & 2032
- Figure 8: South America Hyperscale Data Center Industry Revenue (Million), by Country 2024 & 2032
- Figure 9: South America Hyperscale Data Center Industry Revenue Share (%), by Country 2024 & 2032
- Figure 10: North America Hyperscale Data Center Industry Revenue (Million), by Country 2024 & 2032
- Figure 11: North America Hyperscale Data Center Industry Revenue Share (%), by Country 2024 & 2032
- Figure 12: MEA Hyperscale Data Center Industry Revenue (Million), by Country 2024 & 2032
- Figure 13: MEA Hyperscale Data Center Industry Revenue Share (%), by Country 2024 & 2032
- Figure 14: North America Hyperscale Data Center Industry Revenue (Million), by Data Center Type 2024 & 2032
- Figure 15: North America Hyperscale Data Center Industry Revenue Share (%), by Data Center Type 2024 & 2032
- Figure 16: North America Hyperscale Data Center Industry Revenue (Million), by Country 2024 & 2032
- Figure 17: North America Hyperscale Data Center Industry Revenue Share (%), by Country 2024 & 2032
- Figure 18: Europe Hyperscale Data Center Industry Revenue (Million), by Data Center Type 2024 & 2032
- Figure 19: Europe Hyperscale Data Center Industry Revenue Share (%), by Data Center Type 2024 & 2032
- Figure 20: Europe Hyperscale Data Center Industry Revenue (Million), by Country 2024 & 2032
- Figure 21: Europe Hyperscale Data Center Industry Revenue Share (%), by Country 2024 & 2032
- Figure 22: Asia Pacific Hyperscale Data Center Industry Revenue (Million), by Data Center Type 2024 & 2032
- Figure 23: Asia Pacific Hyperscale Data Center Industry Revenue Share (%), by Data Center Type 2024 & 2032
- Figure 24: Asia Pacific Hyperscale Data Center Industry Revenue (Million), by Country 2024 & 2032
- Figure 25: Asia Pacific Hyperscale Data Center Industry Revenue Share (%), by Country 2024 & 2032
- Figure 26: South America Hyperscale Data Center Industry Revenue (Million), by Data Center Type 2024 & 2032
- Figure 27: South America Hyperscale Data Center Industry Revenue Share (%), by Data Center Type 2024 & 2032
- Figure 28: South America Hyperscale Data Center Industry Revenue (Million), by Country 2024 & 2032
- Figure 29: South America Hyperscale Data Center Industry Revenue Share (%), by Country 2024 & 2032
- Figure 30: Middle East Hyperscale Data Center Industry Revenue (Million), by Data Center Type 2024 & 2032
- Figure 31: Middle East Hyperscale Data Center Industry Revenue Share (%), by Data Center Type 2024 & 2032
- Figure 32: Middle East Hyperscale Data Center Industry Revenue (Million), by Country 2024 & 2032
- Figure 33: Middle East Hyperscale Data Center Industry Revenue Share (%), by Country 2024 & 2032
List of Tables
- Table 1: Global Hyperscale Data Center Industry Revenue Million Forecast, by Region 2019 & 2032
- Table 2: Global Hyperscale Data Center Industry Revenue Million Forecast, by Data Center Type 2019 & 2032
- Table 3: Global Hyperscale Data Center Industry Revenue Million Forecast, by Region 2019 & 2032
- Table 4: Global Hyperscale Data Center Industry Revenue Million Forecast, by Country 2019 & 2032
- Table 5: United States Hyperscale Data Center Industry Revenue (Million) Forecast, by Application 2019 & 2032
- Table 6: Canada Hyperscale Data Center Industry Revenue (Million) Forecast, by Application 2019 & 2032
- Table 7: Mexico Hyperscale Data Center Industry Revenue (Million) Forecast, by Application 2019 & 2032
- Table 8: Global Hyperscale Data Center Industry Revenue Million Forecast, by Country 2019 & 2032
- Table 9: Germany Hyperscale Data Center Industry Revenue (Million) Forecast, by Application 2019 & 2032
- Table 10: United Kingdom Hyperscale Data Center Industry Revenue (Million) Forecast, by Application 2019 & 2032
- Table 11: France Hyperscale Data Center Industry Revenue (Million) Forecast, by Application 2019 & 2032
- Table 12: Spain Hyperscale Data Center Industry Revenue (Million) Forecast, by Application 2019 & 2032
- Table 13: Italy Hyperscale Data Center Industry Revenue (Million) Forecast, by Application 2019 & 2032
- Table 14: Spain Hyperscale Data Center Industry Revenue (Million) Forecast, by Application 2019 & 2032
- Table 15: Belgium Hyperscale Data Center Industry Revenue (Million) Forecast, by Application 2019 & 2032
- Table 16: Netherland Hyperscale Data Center Industry Revenue (Million) Forecast, by Application 2019 & 2032
- Table 17: Nordics Hyperscale Data Center Industry Revenue (Million) Forecast, by Application 2019 & 2032
- Table 18: Rest of Europe Hyperscale Data Center Industry Revenue (Million) Forecast, by Application 2019 & 2032
- Table 19: Global Hyperscale Data Center Industry Revenue Million Forecast, by Country 2019 & 2032
- Table 20: China Hyperscale Data Center Industry Revenue (Million) Forecast, by Application 2019 & 2032
- Table 21: Japan Hyperscale Data Center Industry Revenue (Million) Forecast, by Application 2019 & 2032
- Table 22: India Hyperscale Data Center Industry Revenue (Million) Forecast, by Application 2019 & 2032
- Table 23: South Korea Hyperscale Data Center Industry Revenue (Million) Forecast, by Application 2019 & 2032
- Table 24: Southeast Asia Hyperscale Data Center Industry Revenue (Million) Forecast, by Application 2019 & 2032
- Table 25: Australia Hyperscale Data Center Industry Revenue (Million) Forecast, by Application 2019 & 2032
- Table 26: Indonesia Hyperscale Data Center Industry Revenue (Million) Forecast, by Application 2019 & 2032
- Table 27: Phillipes Hyperscale Data Center Industry Revenue (Million) Forecast, by Application 2019 & 2032
- Table 28: Singapore Hyperscale Data Center Industry Revenue (Million) Forecast, by Application 2019 & 2032
- Table 29: Thailandc Hyperscale Data Center Industry Revenue (Million) Forecast, by Application 2019 & 2032
- Table 30: Rest of Asia Pacific Hyperscale Data Center Industry Revenue (Million) Forecast, by Application 2019 & 2032
- Table 31: Global Hyperscale Data Center Industry Revenue Million Forecast, by Country 2019 & 2032
- Table 32: Brazil Hyperscale Data Center Industry Revenue (Million) Forecast, by Application 2019 & 2032
- Table 33: Argentina Hyperscale Data Center Industry Revenue (Million) Forecast, by Application 2019 & 2032
- Table 34: Peru Hyperscale Data Center Industry Revenue (Million) Forecast, by Application 2019 & 2032
- Table 35: Chile Hyperscale Data Center Industry Revenue (Million) Forecast, by Application 2019 & 2032
- Table 36: Colombia Hyperscale Data Center Industry Revenue (Million) Forecast, by Application 2019 & 2032
- Table 37: Ecuador Hyperscale Data Center Industry Revenue (Million) Forecast, by Application 2019 & 2032
- Table 38: Venezuela Hyperscale Data Center Industry Revenue (Million) Forecast, by Application 2019 & 2032
- Table 39: Rest of South America Hyperscale Data Center Industry Revenue (Million) Forecast, by Application 2019 & 2032
- Table 40: Global Hyperscale Data Center Industry Revenue Million Forecast, by Country 2019 & 2032
- Table 41: United States Hyperscale Data Center Industry Revenue (Million) Forecast, by Application 2019 & 2032
- Table 42: Canada Hyperscale Data Center Industry Revenue (Million) Forecast, by Application 2019 & 2032
- Table 43: Mexico Hyperscale Data Center Industry Revenue (Million) Forecast, by Application 2019 & 2032
- Table 44: Global Hyperscale Data Center Industry Revenue Million Forecast, by Country 2019 & 2032
- Table 45: United Arab Emirates Hyperscale Data Center Industry Revenue (Million) Forecast, by Application 2019 & 2032
- Table 46: Saudi Arabia Hyperscale Data Center Industry Revenue (Million) Forecast, by Application 2019 & 2032
- Table 47: South Africa Hyperscale Data Center Industry Revenue (Million) Forecast, by Application 2019 & 2032
- Table 48: Rest of Middle East and Africa Hyperscale Data Center Industry Revenue (Million) Forecast, by Application 2019 & 2032
- Table 49: Global Hyperscale Data Center Industry Revenue Million Forecast, by Data Center Type 2019 & 2032
- Table 50: Global Hyperscale Data Center Industry Revenue Million Forecast, by Country 2019 & 2032
- Table 51: US Hyperscale Data Center Industry Revenue (Million) Forecast, by Application 2019 & 2032
- Table 52: Canada Hyperscale Data Center Industry Revenue (Million) Forecast, by Application 2019 & 2032
- Table 53: Rest of North America Hyperscale Data Center Industry Revenue (Million) Forecast, by Application 2019 & 2032
- Table 54: Global Hyperscale Data Center Industry Revenue Million Forecast, by Data Center Type 2019 & 2032
- Table 55: Global Hyperscale Data Center Industry Revenue Million Forecast, by Country 2019 & 2032
- Table 56: Germany Hyperscale Data Center Industry Revenue (Million) Forecast, by Application 2019 & 2032
- Table 57: UK Hyperscale Data Center Industry Revenue (Million) Forecast, by Application 2019 & 2032
- Table 58: France Hyperscale Data Center Industry Revenue (Million) Forecast, by Application 2019 & 2032
- Table 59: Netherlands Hyperscale Data Center Industry Revenue (Million) Forecast, by Application 2019 & 2032
- Table 60: Ireland Hyperscale Data Center Industry Revenue (Million) Forecast, by Application 2019 & 2032
- Table 61: Spain Hyperscale Data Center Industry Revenue (Million) Forecast, by Application 2019 & 2032
- Table 62: Italy Hyperscale Data Center Industry Revenue (Million) Forecast, by Application 2019 & 2032
- Table 63: Rest of Europe Hyperscale Data Center Industry Revenue (Million) Forecast, by Application 2019 & 2032
- Table 64: Global Hyperscale Data Center Industry Revenue Million Forecast, by Data Center Type 2019 & 2032
- Table 65: Global Hyperscale Data Center Industry Revenue Million Forecast, by Country 2019 & 2032
- Table 66: India Hyperscale Data Center Industry Revenue (Million) Forecast, by Application 2019 & 2032
- Table 67: China Hyperscale Data Center Industry Revenue (Million) Forecast, by Application 2019 & 2032
- Table 68: Japan Hyperscale Data Center Industry Revenue (Million) Forecast, by Application 2019 & 2032
- Table 69: Singapore Hyperscale Data Center Industry Revenue (Million) Forecast, by Application 2019 & 2032
- Table 70: Australia Hyperscale Data Center Industry Revenue (Million) Forecast, by Application 2019 & 2032
- Table 71: Indonesia Hyperscale Data Center Industry Revenue (Million) Forecast, by Application 2019 & 2032
- Table 72: Malaysia Hyperscale Data Center Industry Revenue (Million) Forecast, by Application 2019 & 2032
- Table 73: Thailand Hyperscale Data Center Industry Revenue (Million) Forecast, by Application 2019 & 2032
- Table 74: Rest of Asia Pacific Hyperscale Data Center Industry Revenue (Million) Forecast, by Application 2019 & 2032
- Table 75: Global Hyperscale Data Center Industry Revenue Million Forecast, by Data Center Type 2019 & 2032
- Table 76: Global Hyperscale Data Center Industry Revenue Million Forecast, by Country 2019 & 2032
- Table 77: Brazil Hyperscale Data Center Industry Revenue (Million) Forecast, by Application 2019 & 2032
- Table 78: Chile Hyperscale Data Center Industry Revenue (Million) Forecast, by Application 2019 & 2032
- Table 79: Rest of South America Hyperscale Data Center Industry Revenue (Million) Forecast, by Application 2019 & 2032
- Table 80: Global Hyperscale Data Center Industry Revenue Million Forecast, by Data Center Type 2019 & 2032
- Table 81: Global Hyperscale Data Center Industry Revenue Million Forecast, by Country 2019 & 2032
- Table 82: United Arab Emirates Hyperscale Data Center Industry Revenue (Million) Forecast, by Application 2019 & 2032
- Table 83: Saudi Arabia Hyperscale Data Center Industry Revenue (Million) Forecast, by Application 2019 & 2032
- Table 84: Rest of Middle East Hyperscale Data Center Industry Revenue (Million) Forecast, by Application 2019 & 2032
Frequently Asked Questions
1. What is the projected Compound Annual Growth Rate (CAGR) of the Hyperscale Data Center Industry?
The projected CAGR is approximately 5.29%.
2. Which companies are prominent players in the Hyperscale Data Center Industry?
Key companies in the market include IBM Corporation, Hewlett Packard Enterprise Co, Alphabet Inc, Cisco Systems Inc, Microsoft Corporation, Amazon Web Services Inc, Huawei Technologies Co, Quanta Computer Inc, Alibaba Group, Facebook Inc, Nvidia Corporation.
3. What are the main segments of the Hyperscale Data Center Industry?
The market segments include Data Center Type.
4. Can you provide details about the market size?
The market size is estimated to be USD 101.23 Million as of 2022.
5. What are some drivers contributing to market growth?
Growing Demand for Cloud Computing and Other High Performance Technologies.
6. What are the notable trends driving market growth?
Growing Demand for Cloud Computing and Other Hight Performance Technologies Driving the Market.
7. Are there any restraints impacting market growth?
High Costs and Operational Concerns; Concerns related to Geoprivacy and Confidential Data.
8. Can you provide examples of recent developments in the market?
November 2022 - Big Data Exchange (BDx), PT Indosat Tbk (Indosat Ooredoo Hutchison), and PT Aplikanusa Lintasarta announced their plan to build a 100MW data center complex on 12 acres of land. This new data center campus, CGK5, will be located in Karawang, West Java, east of Jakarta, and will be part of the company's third availability zone. The BDx Indonesia joint venture is a key component of the BDx platform, and the construction of CGK5 is BDx's 11th data center in the Asia-Pacific region. With more than USD 1 billion in committed investment funding, BDx's strong development trajectory across Asia allows scaled innovation in the most challenging markets.
9. What pricing options are available for accessing the report?
Pricing options include single-user, multi-user, and enterprise licenses priced at USD 4750, USD 5250, and USD 8750 respectively.
10. Is the market size provided in terms of value or volume?
The market size is provided in terms of value, measured in Million.
11. Are there any specific market keywords associated with the report?
Yes, the market keyword associated with the report is "Hyperscale Data Center Industry," which aids in identifying and referencing the specific market segment covered.
12. How do I determine which pricing option suits my needs best?
The pricing options vary based on user requirements and access needs. Individual users may opt for single-user licenses, while businesses requiring broader access may choose multi-user or enterprise licenses for cost-effective access to the report.
13. Are there any additional resources or data provided in the Hyperscale Data Center Industry report?
While the report offers comprehensive insights, it's advisable to review the specific contents or supplementary materials provided to ascertain if additional resources or data are available.
14. How can I stay updated on further developments or reports in the Hyperscale Data Center Industry?
To stay informed about further developments, trends, and reports in the Hyperscale Data Center Industry, consider subscribing to industry newsletters, following relevant companies and organizations, or regularly checking reputable industry news sources and publications.
Methodology
Step 1 - Identification of Relevant Samples Size from Population Database


Step 2 - Approaches for Defining Global Market Size (Value, Volume* & Price*)

Note*: In applicable scenarios
Step 3 - Data Sources
Primary Research
- Web Analytics
- Survey Reports
- Research Institute
- Latest Research Reports
- Opinion Leaders
Secondary Research
- Annual Reports
- White Paper
- Latest Press Release
- Industry Association
- Paid Database
- Investor Presentations

Step 4 - Data Triangulation
Involves using different sources of information in order to increase the validity of a study
These sources are likely to be stakeholders in a program - participants, other researchers, program staff, other community members, and so on.
Then we put all data in single framework & apply various statistical tools to find out the dynamic on the market.
During the analysis stage, feedback from the stakeholder groups would be compared to determine areas of agreement as well as areas of divergence


