
Key Insights
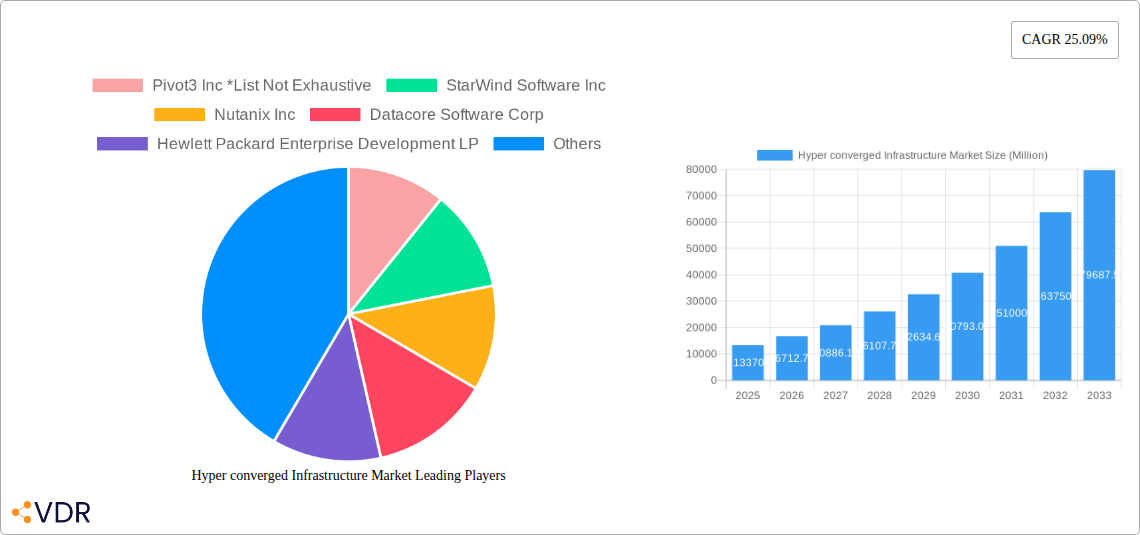
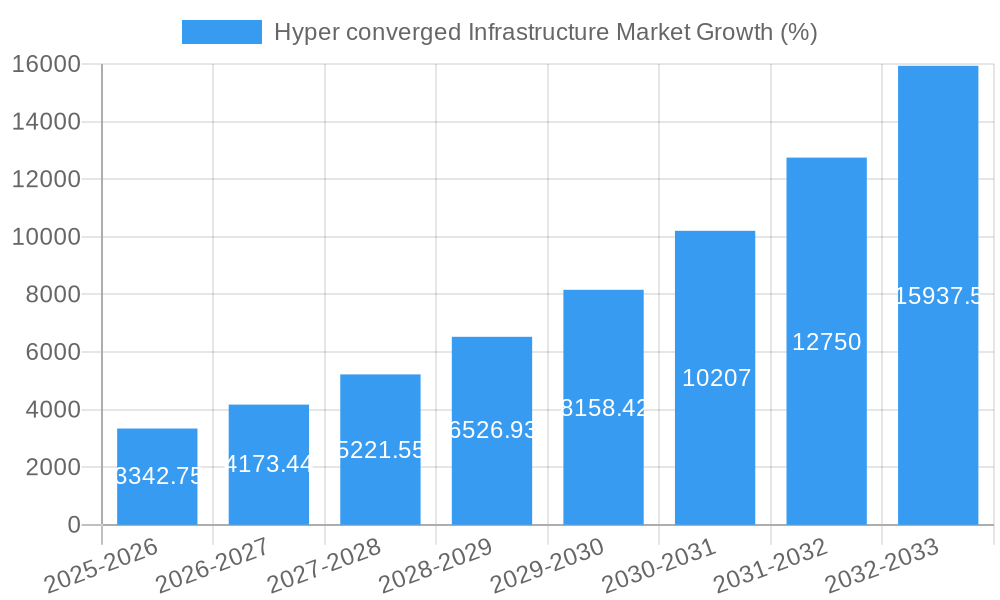
The hyper-converged infrastructure (HCI) market is experiencing robust growth, projected to reach \$13.37 billion in 2025 and maintain a Compound Annual Growth Rate (CAGR) of 25.09% from 2025 to 2033. This expansion is driven by several key factors. The increasing adoption of cloud computing and virtualization necessitates efficient data center management, a key benefit HCI provides through its consolidated hardware and software architecture. Furthermore, the rise of big data and the need for scalable solutions are fueling demand for HCI’s agility and cost-effectiveness. Organizations across various sectors, including IT & Telecommunications, BFSI (Banking, Financial Services, and Insurance), Healthcare, and Retail, are increasingly adopting HCI to simplify infrastructure management, reduce capital expenditure, and improve operational efficiency. The market is segmented by service type (Professional and Managed) and organizational size (Large Enterprises and Small & Medium Enterprises), reflecting varying needs and budgetary constraints. Leading vendors such as Nutanix, VMware, Dell, and Hewlett Packard Enterprise are driving innovation and competition within the market, offering a diverse range of solutions to meet specific customer requirements.
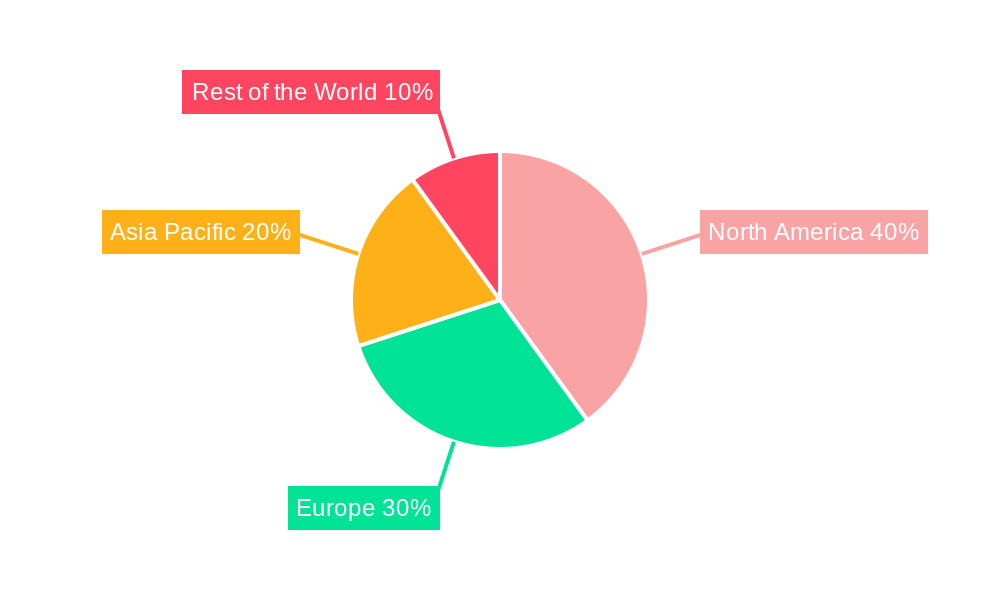
The continued growth trajectory is expected to be influenced by several market trends. The growing adoption of artificial intelligence (AI) and machine learning (ML) will likely increase the demand for HCI's ability to handle the processing and storage needs of these technologies. Furthermore, the increasing adoption of edge computing will contribute to market expansion as organizations seek distributed infrastructure solutions. While factors such as security concerns and the complexity of migrating to HCI could act as restraints, the overall market outlook remains positive, with substantial growth projected across all regions, particularly in North America and Asia Pacific, driven by high technological adoption rates and increasing digital transformation initiatives. The competitive landscape is dynamic, with established players and emerging vendors vying for market share through continuous innovation and strategic partnerships.
Hyperconverged Infrastructure (HCI) Market Report: 2019-2033
This comprehensive report provides a detailed analysis of the Hyperconverged Infrastructure (HCI) market, encompassing market dynamics, growth trends, regional analysis, product landscape, key players, and future outlook. The study period covers 2019-2033, with 2025 as the base and estimated year. The report offers invaluable insights for industry professionals, investors, and stakeholders seeking to understand and capitalize on the evolving HCI landscape. This report is meticulously researched and ready for immediate use without further modification.
Hyperconverged Infrastructure Market Market Dynamics & Structure
The hyperconverged infrastructure (HCI) market exhibits a moderately consolidated structure with several key players vying for market share. The market is valued at xx Million in 2025 and is projected to reach xx Million by 2033. Technological innovation, particularly in areas like software-defined storage and compute virtualization, is a primary driver. Regulatory frameworks, particularly concerning data privacy and security, influence adoption rates. Cloud computing and traditional server infrastructure act as competitive substitutes. The end-user demographic is diverse, ranging from large enterprises to SMEs across various industries. M&A activity is relatively frequent, with xx major deals recorded in the last 5 years, indicating consolidation efforts within the sector.
- Market Concentration: Moderately consolidated, with top 5 players holding approximately xx% market share in 2025.
- Technological Innovation: Rapid advancements in virtualization, software-defined networking, and AI-driven management are key drivers.
- Regulatory Framework: Compliance with data privacy regulations (e.g., GDPR, CCPA) influences HCI deployment strategies.
- Competitive Substitutes: Cloud computing services and traditional IT infrastructure pose significant competition.
- End-User Demographics: Large enterprises (xx%) and SMEs (xx%) across IT & Telecommunication, BFSI, Healthcare, and other sectors are significant adopters.
- M&A Trends: Strategic acquisitions and mergers are frequent, driving consolidation and expansion into new markets.
Hyper converged Infrastructure Market Growth Trends & Insights
The HCI market is experiencing robust growth, driven by the increasing adoption of cloud-native applications, the need for improved data center agility, and the desire for simplified IT management. The market exhibited a CAGR of xx% during the historical period (2019-2024) and is projected to maintain a CAGR of xx% during the forecast period (2025-2033). Market penetration is currently at xx%, with significant growth potential in emerging economies. Technological disruptions, such as the rise of edge computing and AI-powered HCI solutions, are accelerating market expansion. Consumer behavior shifts, including the preference for as-a-service models and hybrid cloud deployments, are also shaping the HCI market. The total addressable market (TAM) is estimated at xx Million in 2025.
Dominant Regions, Countries, or Segments in Hyper converged Infrastructure Market
North America currently holds the largest market share in the HCI market, driven by strong technological advancements, early adoption of cloud technologies, and a well-established IT infrastructure. Within North America, the US dominates due to a large enterprise base and significant investments in IT modernization. The European market is also witnessing substantial growth, primarily driven by increasing digital transformation initiatives within various sectors, while Asia Pacific is expected to experience the fastest growth during the forecast period.
- By Service: Managed services are currently leading due to their ability to offload complexities to specialist providers.
- By Organization Type: Large enterprises drive the majority of HCI adoption, due to their greater IT budgets and more complex needs.
- By End-user Industry: IT & Telecommunication, BFSI, and Healthcare lead the adoption curve, primarily due to their stringent requirements for high availability and data security.
Key Drivers:
- Strong technological infrastructure: High internet penetration, advanced digitalization and supportive government policies in developed nations.
- Government initiatives: Policies promoting digital transformation and cloud adoption create favorable conditions for growth.
Hyper converged Infrastructure Market Product Landscape
HCI solutions are evolving from basic virtualization platforms to encompass sophisticated features like automated provisioning, integrated security, and advanced analytics. Vendors are focusing on improving performance metrics such as scalability, efficiency, and resilience through the implementation of newer technologies. This ensures seamless integration into existing IT infrastructure whilst offering simplified management capabilities, driving demand across numerous applications. Key advancements include containerization, AI-driven optimization, and edge computing integration.
Key Drivers, Barriers & Challenges in Hyper converged Infrastructure Market
Key Drivers:
- Increasing demand for simplified IT infrastructure management.
- Growing adoption of cloud-native applications.
- Need for improved data center agility and scalability.
Challenges:
- High initial investment costs can be a barrier for SMEs.
- Integration complexities with existing IT systems can hinder adoption.
- Security concerns related to data breaches remain a significant challenge. This factor currently impacts xx% of potential HCI deployments.
Emerging Opportunities in Hyper converged Infrastructure Market
Untapped markets in developing economies present significant opportunities. The growing adoption of edge computing and the Internet of Things (IoT) opens new avenues for HCI deployments. The increasing demand for AI-powered solutions, including machine learning-driven optimization and predictive analytics, presents exciting possibilities for HCI vendors.
Growth Accelerators in the Hyper converged Infrastructure Market Industry
Strategic partnerships between HCI vendors and cloud providers are accelerating market growth. Technological breakthroughs in areas such as NVMe over Fabrics and high-performance computing are driving the adoption of HCI. The expansion of HCI into new industries, such as manufacturing and education, promises sustained market expansion.
Key Players Shaping the Hyper converged Infrastructure Market Market
- Pivot3 Inc
- StarWind Software Inc
- Nutanix Inc
- Datacore Software Corp
- Hewlett Packard Enterprise Development LP
- IBM Corp (Red Hat Inc)
- Dell Inc
- NetApp Inc
- Huawei Technologies Co Ltd
- Maxta Inc
- Cisco System Inc
- Oracle Corp
- Microsoft Corp
- VMware Inc
Notable Milestones in Hyper converged Infrastructure Market Sector
- February 2022: Dell EMC VxRail HCI adoption by a woodworking company for data center modernization.
- March 2022: Kyndryl and Lenovo expand their partnership to deliver HCI solutions.
In-Depth Hyper converged Infrastructure Market Market Outlook
The HCI market is poised for continued growth, driven by the convergence of several key factors. Technological innovations, strategic partnerships, and increasing adoption across diverse industries will fuel market expansion. Opportunities exist in untapped markets and new applications, promising a robust and dynamic market landscape for the foreseeable future. The market is predicted to experience significant expansion in the coming years, driven by sustained technological advancements and increasing demand across diverse industries.
Hyper converged Infrastructure Market Segmentation
-
1. Service
- 1.1. Professional
- 1.2. Managed
-
2. Organization Type
- 2.1. Large Enterprise
- 2.2. Small & Medium Enterprise
-
3. End-user Industry
- 3.1. IT & Telecommunication
- 3.2. BFSI
- 3.3. Healthcare
- 3.4. Retail
- 3.5. Government and Defence
- 3.6. Other End-user Industries
Hyper converged Infrastructure Market Segmentation By Geography
- 1. North America
- 2. Europe
- 3. Asia Pacific
- 4. Rest of the World
Hyper converged Infrastructure Market REPORT HIGHLIGHTS
| Aspects | Details |
|---|---|
| Study Period | 2019-2033 |
| Base Year | 2024 |
| Estimated Year | 2025 |
| Forecast Period | 2025-2033 |
| Historical Period | 2019-2024 |
| Growth Rate | CAGR of 25.09% from 2019-2033 |
| Segmentation |
|
Table of Contents
- 1. Introduction
- 1.1. Research Scope
- 1.2. Market Segmentation
- 1.3. Research Methodology
- 1.4. Definitions and Assumptions
- 2. Executive Summary
- 2.1. Introduction
- 3. Market Dynamics
- 3.1. Introduction
- 3.2. Market Drivers
- 3.2.1. Growing Need for Enhanced Data Protection; Rising Demand for Integration Over Cloud Platform
- 3.3. Market Restrains
- 3.3.1. Loss of Data Privacy Over the Business Eco-system
- 3.4. Market Trends
- 3.4.1. Growing Need for Enhanced Data Protection Driving the Market Growth
- 4. Market Factor Analysis
- 4.1. Porters Five Forces
- 4.2. Supply/Value Chain
- 4.3. PESTEL analysis
- 4.4. Market Entropy
- 4.5. Patent/Trademark Analysis
- 5. Global Hyper converged Infrastructure Market Analysis, Insights and Forecast, 2019-2031
- 5.1. Market Analysis, Insights and Forecast - by Service
- 5.1.1. Professional
- 5.1.2. Managed
- 5.2. Market Analysis, Insights and Forecast - by Organization Type
- 5.2.1. Large Enterprise
- 5.2.2. Small & Medium Enterprise
- 5.3. Market Analysis, Insights and Forecast - by End-user Industry
- 5.3.1. IT & Telecommunication
- 5.3.2. BFSI
- 5.3.3. Healthcare
- 5.3.4. Retail
- 5.3.5. Government and Defence
- 5.3.6. Other End-user Industries
- 5.4. Market Analysis, Insights and Forecast - by Region
- 5.4.1. North America
- 5.4.2. Europe
- 5.4.3. Asia Pacific
- 5.4.4. Rest of the World
- 5.1. Market Analysis, Insights and Forecast - by Service
- 6. North America Hyper converged Infrastructure Market Analysis, Insights and Forecast, 2019-2031
- 6.1. Market Analysis, Insights and Forecast - by Service
- 6.1.1. Professional
- 6.1.2. Managed
- 6.2. Market Analysis, Insights and Forecast - by Organization Type
- 6.2.1. Large Enterprise
- 6.2.2. Small & Medium Enterprise
- 6.3. Market Analysis, Insights and Forecast - by End-user Industry
- 6.3.1. IT & Telecommunication
- 6.3.2. BFSI
- 6.3.3. Healthcare
- 6.3.4. Retail
- 6.3.5. Government and Defence
- 6.3.6. Other End-user Industries
- 6.1. Market Analysis, Insights and Forecast - by Service
- 7. Europe Hyper converged Infrastructure Market Analysis, Insights and Forecast, 2019-2031
- 7.1. Market Analysis, Insights and Forecast - by Service
- 7.1.1. Professional
- 7.1.2. Managed
- 7.2. Market Analysis, Insights and Forecast - by Organization Type
- 7.2.1. Large Enterprise
- 7.2.2. Small & Medium Enterprise
- 7.3. Market Analysis, Insights and Forecast - by End-user Industry
- 7.3.1. IT & Telecommunication
- 7.3.2. BFSI
- 7.3.3. Healthcare
- 7.3.4. Retail
- 7.3.5. Government and Defence
- 7.3.6. Other End-user Industries
- 7.1. Market Analysis, Insights and Forecast - by Service
- 8. Asia Pacific Hyper converged Infrastructure Market Analysis, Insights and Forecast, 2019-2031
- 8.1. Market Analysis, Insights and Forecast - by Service
- 8.1.1. Professional
- 8.1.2. Managed
- 8.2. Market Analysis, Insights and Forecast - by Organization Type
- 8.2.1. Large Enterprise
- 8.2.2. Small & Medium Enterprise
- 8.3. Market Analysis, Insights and Forecast - by End-user Industry
- 8.3.1. IT & Telecommunication
- 8.3.2. BFSI
- 8.3.3. Healthcare
- 8.3.4. Retail
- 8.3.5. Government and Defence
- 8.3.6. Other End-user Industries
- 8.1. Market Analysis, Insights and Forecast - by Service
- 9. Rest of the World Hyper converged Infrastructure Market Analysis, Insights and Forecast, 2019-2031
- 9.1. Market Analysis, Insights and Forecast - by Service
- 9.1.1. Professional
- 9.1.2. Managed
- 9.2. Market Analysis, Insights and Forecast - by Organization Type
- 9.2.1. Large Enterprise
- 9.2.2. Small & Medium Enterprise
- 9.3. Market Analysis, Insights and Forecast - by End-user Industry
- 9.3.1. IT & Telecommunication
- 9.3.2. BFSI
- 9.3.3. Healthcare
- 9.3.4. Retail
- 9.3.5. Government and Defence
- 9.3.6. Other End-user Industries
- 9.1. Market Analysis, Insights and Forecast - by Service
- 10. North America Hyper converged Infrastructure Market Analysis, Insights and Forecast, 2019-2031
- 10.1. Market Analysis, Insights and Forecast - By Country/Sub-region
- 10.1.1.
- 11. Europe Hyper converged Infrastructure Market Analysis, Insights and Forecast, 2019-2031
- 11.1. Market Analysis, Insights and Forecast - By Country/Sub-region
- 11.1.1.
- 12. Asia Pacific Hyper converged Infrastructure Market Analysis, Insights and Forecast, 2019-2031
- 12.1. Market Analysis, Insights and Forecast - By Country/Sub-region
- 12.1.1.
- 13. Rest of the World Hyper converged Infrastructure Market Analysis, Insights and Forecast, 2019-2031
- 13.1. Market Analysis, Insights and Forecast - By Country/Sub-region
- 13.1.1.
- 14. Competitive Analysis
- 14.1. Global Market Share Analysis 2024
- 14.2. Company Profiles
- 14.2.1 Pivot3 Inc *List Not Exhaustive
- 14.2.1.1. Overview
- 14.2.1.2. Products
- 14.2.1.3. SWOT Analysis
- 14.2.1.4. Recent Developments
- 14.2.1.5. Financials (Based on Availability)
- 14.2.2 StarWind Software Inc
- 14.2.2.1. Overview
- 14.2.2.2. Products
- 14.2.2.3. SWOT Analysis
- 14.2.2.4. Recent Developments
- 14.2.2.5. Financials (Based on Availability)
- 14.2.3 Nutanix Inc
- 14.2.3.1. Overview
- 14.2.3.2. Products
- 14.2.3.3. SWOT Analysis
- 14.2.3.4. Recent Developments
- 14.2.3.5. Financials (Based on Availability)
- 14.2.4 Datacore Software Corp
- 14.2.4.1. Overview
- 14.2.4.2. Products
- 14.2.4.3. SWOT Analysis
- 14.2.4.4. Recent Developments
- 14.2.4.5. Financials (Based on Availability)
- 14.2.5 Hewlett Packard Enterprise Development LP
- 14.2.5.1. Overview
- 14.2.5.2. Products
- 14.2.5.3. SWOT Analysis
- 14.2.5.4. Recent Developments
- 14.2.5.5. Financials (Based on Availability)
- 14.2.6 IBM Corp (Red Hat Inc )
- 14.2.6.1. Overview
- 14.2.6.2. Products
- 14.2.6.3. SWOT Analysis
- 14.2.6.4. Recent Developments
- 14.2.6.5. Financials (Based on Availability)
- 14.2.7 Dell Inc
- 14.2.7.1. Overview
- 14.2.7.2. Products
- 14.2.7.3. SWOT Analysis
- 14.2.7.4. Recent Developments
- 14.2.7.5. Financials (Based on Availability)
- 14.2.8 NetApp Inc
- 14.2.8.1. Overview
- 14.2.8.2. Products
- 14.2.8.3. SWOT Analysis
- 14.2.8.4. Recent Developments
- 14.2.8.5. Financials (Based on Availability)
- 14.2.9 Huawei Technologies Co Ltd
- 14.2.9.1. Overview
- 14.2.9.2. Products
- 14.2.9.3. SWOT Analysis
- 14.2.9.4. Recent Developments
- 14.2.9.5. Financials (Based on Availability)
- 14.2.10 Maxta Inc
- 14.2.10.1. Overview
- 14.2.10.2. Products
- 14.2.10.3. SWOT Analysis
- 14.2.10.4. Recent Developments
- 14.2.10.5. Financials (Based on Availability)
- 14.2.11 Cisco System Inc
- 14.2.11.1. Overview
- 14.2.11.2. Products
- 14.2.11.3. SWOT Analysis
- 14.2.11.4. Recent Developments
- 14.2.11.5. Financials (Based on Availability)
- 14.2.12 Oracle Corp
- 14.2.12.1. Overview
- 14.2.12.2. Products
- 14.2.12.3. SWOT Analysis
- 14.2.12.4. Recent Developments
- 14.2.12.5. Financials (Based on Availability)
- 14.2.13 Microsoft Corp
- 14.2.13.1. Overview
- 14.2.13.2. Products
- 14.2.13.3. SWOT Analysis
- 14.2.13.4. Recent Developments
- 14.2.13.5. Financials (Based on Availability)
- 14.2.14 VMware Inc
- 14.2.14.1. Overview
- 14.2.14.2. Products
- 14.2.14.3. SWOT Analysis
- 14.2.14.4. Recent Developments
- 14.2.14.5. Financials (Based on Availability)
- 14.2.1 Pivot3 Inc *List Not Exhaustive
List of Figures
- Figure 1: Global Hyper converged Infrastructure Market Revenue Breakdown (Million, %) by Region 2024 & 2032
- Figure 2: North America Hyper converged Infrastructure Market Revenue (Million), by Country 2024 & 2032
- Figure 3: North America Hyper converged Infrastructure Market Revenue Share (%), by Country 2024 & 2032
- Figure 4: Europe Hyper converged Infrastructure Market Revenue (Million), by Country 2024 & 2032
- Figure 5: Europe Hyper converged Infrastructure Market Revenue Share (%), by Country 2024 & 2032
- Figure 6: Asia Pacific Hyper converged Infrastructure Market Revenue (Million), by Country 2024 & 2032
- Figure 7: Asia Pacific Hyper converged Infrastructure Market Revenue Share (%), by Country 2024 & 2032
- Figure 8: Rest of the World Hyper converged Infrastructure Market Revenue (Million), by Country 2024 & 2032
- Figure 9: Rest of the World Hyper converged Infrastructure Market Revenue Share (%), by Country 2024 & 2032
- Figure 10: North America Hyper converged Infrastructure Market Revenue (Million), by Service 2024 & 2032
- Figure 11: North America Hyper converged Infrastructure Market Revenue Share (%), by Service 2024 & 2032
- Figure 12: North America Hyper converged Infrastructure Market Revenue (Million), by Organization Type 2024 & 2032
- Figure 13: North America Hyper converged Infrastructure Market Revenue Share (%), by Organization Type 2024 & 2032
- Figure 14: North America Hyper converged Infrastructure Market Revenue (Million), by End-user Industry 2024 & 2032
- Figure 15: North America Hyper converged Infrastructure Market Revenue Share (%), by End-user Industry 2024 & 2032
- Figure 16: North America Hyper converged Infrastructure Market Revenue (Million), by Country 2024 & 2032
- Figure 17: North America Hyper converged Infrastructure Market Revenue Share (%), by Country 2024 & 2032
- Figure 18: Europe Hyper converged Infrastructure Market Revenue (Million), by Service 2024 & 2032
- Figure 19: Europe Hyper converged Infrastructure Market Revenue Share (%), by Service 2024 & 2032
- Figure 20: Europe Hyper converged Infrastructure Market Revenue (Million), by Organization Type 2024 & 2032
- Figure 21: Europe Hyper converged Infrastructure Market Revenue Share (%), by Organization Type 2024 & 2032
- Figure 22: Europe Hyper converged Infrastructure Market Revenue (Million), by End-user Industry 2024 & 2032
- Figure 23: Europe Hyper converged Infrastructure Market Revenue Share (%), by End-user Industry 2024 & 2032
- Figure 24: Europe Hyper converged Infrastructure Market Revenue (Million), by Country 2024 & 2032
- Figure 25: Europe Hyper converged Infrastructure Market Revenue Share (%), by Country 2024 & 2032
- Figure 26: Asia Pacific Hyper converged Infrastructure Market Revenue (Million), by Service 2024 & 2032
- Figure 27: Asia Pacific Hyper converged Infrastructure Market Revenue Share (%), by Service 2024 & 2032
- Figure 28: Asia Pacific Hyper converged Infrastructure Market Revenue (Million), by Organization Type 2024 & 2032
- Figure 29: Asia Pacific Hyper converged Infrastructure Market Revenue Share (%), by Organization Type 2024 & 2032
- Figure 30: Asia Pacific Hyper converged Infrastructure Market Revenue (Million), by End-user Industry 2024 & 2032
- Figure 31: Asia Pacific Hyper converged Infrastructure Market Revenue Share (%), by End-user Industry 2024 & 2032
- Figure 32: Asia Pacific Hyper converged Infrastructure Market Revenue (Million), by Country 2024 & 2032
- Figure 33: Asia Pacific Hyper converged Infrastructure Market Revenue Share (%), by Country 2024 & 2032
- Figure 34: Rest of the World Hyper converged Infrastructure Market Revenue (Million), by Service 2024 & 2032
- Figure 35: Rest of the World Hyper converged Infrastructure Market Revenue Share (%), by Service 2024 & 2032
- Figure 36: Rest of the World Hyper converged Infrastructure Market Revenue (Million), by Organization Type 2024 & 2032
- Figure 37: Rest of the World Hyper converged Infrastructure Market Revenue Share (%), by Organization Type 2024 & 2032
- Figure 38: Rest of the World Hyper converged Infrastructure Market Revenue (Million), by End-user Industry 2024 & 2032
- Figure 39: Rest of the World Hyper converged Infrastructure Market Revenue Share (%), by End-user Industry 2024 & 2032
- Figure 40: Rest of the World Hyper converged Infrastructure Market Revenue (Million), by Country 2024 & 2032
- Figure 41: Rest of the World Hyper converged Infrastructure Market Revenue Share (%), by Country 2024 & 2032
List of Tables
- Table 1: Global Hyper converged Infrastructure Market Revenue Million Forecast, by Region 2019 & 2032
- Table 2: Global Hyper converged Infrastructure Market Revenue Million Forecast, by Service 2019 & 2032
- Table 3: Global Hyper converged Infrastructure Market Revenue Million Forecast, by Organization Type 2019 & 2032
- Table 4: Global Hyper converged Infrastructure Market Revenue Million Forecast, by End-user Industry 2019 & 2032
- Table 5: Global Hyper converged Infrastructure Market Revenue Million Forecast, by Region 2019 & 2032
- Table 6: Global Hyper converged Infrastructure Market Revenue Million Forecast, by Country 2019 & 2032
- Table 7: Hyper converged Infrastructure Market Revenue (Million) Forecast, by Application 2019 & 2032
- Table 8: Global Hyper converged Infrastructure Market Revenue Million Forecast, by Country 2019 & 2032
- Table 9: Hyper converged Infrastructure Market Revenue (Million) Forecast, by Application 2019 & 2032
- Table 10: Global Hyper converged Infrastructure Market Revenue Million Forecast, by Country 2019 & 2032
- Table 11: Hyper converged Infrastructure Market Revenue (Million) Forecast, by Application 2019 & 2032
- Table 12: Global Hyper converged Infrastructure Market Revenue Million Forecast, by Country 2019 & 2032
- Table 13: Hyper converged Infrastructure Market Revenue (Million) Forecast, by Application 2019 & 2032
- Table 14: Global Hyper converged Infrastructure Market Revenue Million Forecast, by Service 2019 & 2032
- Table 15: Global Hyper converged Infrastructure Market Revenue Million Forecast, by Organization Type 2019 & 2032
- Table 16: Global Hyper converged Infrastructure Market Revenue Million Forecast, by End-user Industry 2019 & 2032
- Table 17: Global Hyper converged Infrastructure Market Revenue Million Forecast, by Country 2019 & 2032
- Table 18: Global Hyper converged Infrastructure Market Revenue Million Forecast, by Service 2019 & 2032
- Table 19: Global Hyper converged Infrastructure Market Revenue Million Forecast, by Organization Type 2019 & 2032
- Table 20: Global Hyper converged Infrastructure Market Revenue Million Forecast, by End-user Industry 2019 & 2032
- Table 21: Global Hyper converged Infrastructure Market Revenue Million Forecast, by Country 2019 & 2032
- Table 22: Global Hyper converged Infrastructure Market Revenue Million Forecast, by Service 2019 & 2032
- Table 23: Global Hyper converged Infrastructure Market Revenue Million Forecast, by Organization Type 2019 & 2032
- Table 24: Global Hyper converged Infrastructure Market Revenue Million Forecast, by End-user Industry 2019 & 2032
- Table 25: Global Hyper converged Infrastructure Market Revenue Million Forecast, by Country 2019 & 2032
- Table 26: Global Hyper converged Infrastructure Market Revenue Million Forecast, by Service 2019 & 2032
- Table 27: Global Hyper converged Infrastructure Market Revenue Million Forecast, by Organization Type 2019 & 2032
- Table 28: Global Hyper converged Infrastructure Market Revenue Million Forecast, by End-user Industry 2019 & 2032
- Table 29: Global Hyper converged Infrastructure Market Revenue Million Forecast, by Country 2019 & 2032
Frequently Asked Questions
1. What is the projected Compound Annual Growth Rate (CAGR) of the Hyper converged Infrastructure Market?
The projected CAGR is approximately 25.09%.
2. Which companies are prominent players in the Hyper converged Infrastructure Market?
Key companies in the market include Pivot3 Inc *List Not Exhaustive, StarWind Software Inc, Nutanix Inc, Datacore Software Corp, Hewlett Packard Enterprise Development LP, IBM Corp (Red Hat Inc ), Dell Inc, NetApp Inc, Huawei Technologies Co Ltd, Maxta Inc, Cisco System Inc, Oracle Corp, Microsoft Corp, VMware Inc.
3. What are the main segments of the Hyper converged Infrastructure Market?
The market segments include Service, Organization Type, End-user Industry.
4. Can you provide details about the market size?
The market size is estimated to be USD 13.37 Million as of 2022.
5. What are some drivers contributing to market growth?
Growing Need for Enhanced Data Protection; Rising Demand for Integration Over Cloud Platform.
6. What are the notable trends driving market growth?
Growing Need for Enhanced Data Protection Driving the Market Growth.
7. Are there any restraints impacting market growth?
Loss of Data Privacy Over the Business Eco-system.
8. Can you provide examples of recent developments in the market?
March 2022: Kyndryl and Lenovo, prominent players in the IT infrastructure services and PC/storage/server industries, announced an expansion of their global partnership. This expansion aimed to deliver comprehensive solutions for customers across hyper-converged infrastructure (HCI), hybrid cloud, and edge computing applications. Together, they offered a portfolio of ready-to-use solutions that are easily deployable and cater to various business needs.
9. What pricing options are available for accessing the report?
Pricing options include single-user, multi-user, and enterprise licenses priced at USD 4750, USD 5250, and USD 8750 respectively.
10. Is the market size provided in terms of value or volume?
The market size is provided in terms of value, measured in Million.
11. Are there any specific market keywords associated with the report?
Yes, the market keyword associated with the report is "Hyper converged Infrastructure Market," which aids in identifying and referencing the specific market segment covered.
12. How do I determine which pricing option suits my needs best?
The pricing options vary based on user requirements and access needs. Individual users may opt for single-user licenses, while businesses requiring broader access may choose multi-user or enterprise licenses for cost-effective access to the report.
13. Are there any additional resources or data provided in the Hyper converged Infrastructure Market report?
While the report offers comprehensive insights, it's advisable to review the specific contents or supplementary materials provided to ascertain if additional resources or data are available.
14. How can I stay updated on further developments or reports in the Hyper converged Infrastructure Market?
To stay informed about further developments, trends, and reports in the Hyper converged Infrastructure Market, consider subscribing to industry newsletters, following relevant companies and organizations, or regularly checking reputable industry news sources and publications.
Methodology
Step 1 - Identification of Relevant Samples Size from Population Database


Step 2 - Approaches for Defining Global Market Size (Value, Volume* & Price*)

Note*: In applicable scenarios
Step 3 - Data Sources
Primary Research
- Web Analytics
- Survey Reports
- Research Institute
- Latest Research Reports
- Opinion Leaders
Secondary Research
- Annual Reports
- White Paper
- Latest Press Release
- Industry Association
- Paid Database
- Investor Presentations

Step 4 - Data Triangulation
Involves using different sources of information in order to increase the validity of a study
These sources are likely to be stakeholders in a program - participants, other researchers, program staff, other community members, and so on.
Then we put all data in single framework & apply various statistical tools to find out the dynamic on the market.
During the analysis stage, feedback from the stakeholder groups would be compared to determine areas of agreement as well as areas of divergence


