
Key Insights
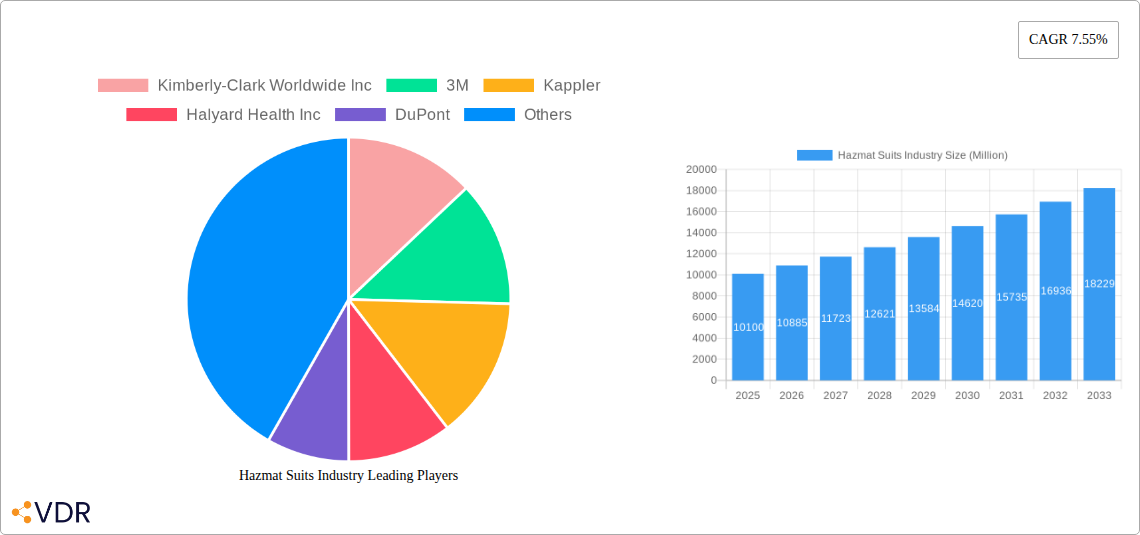
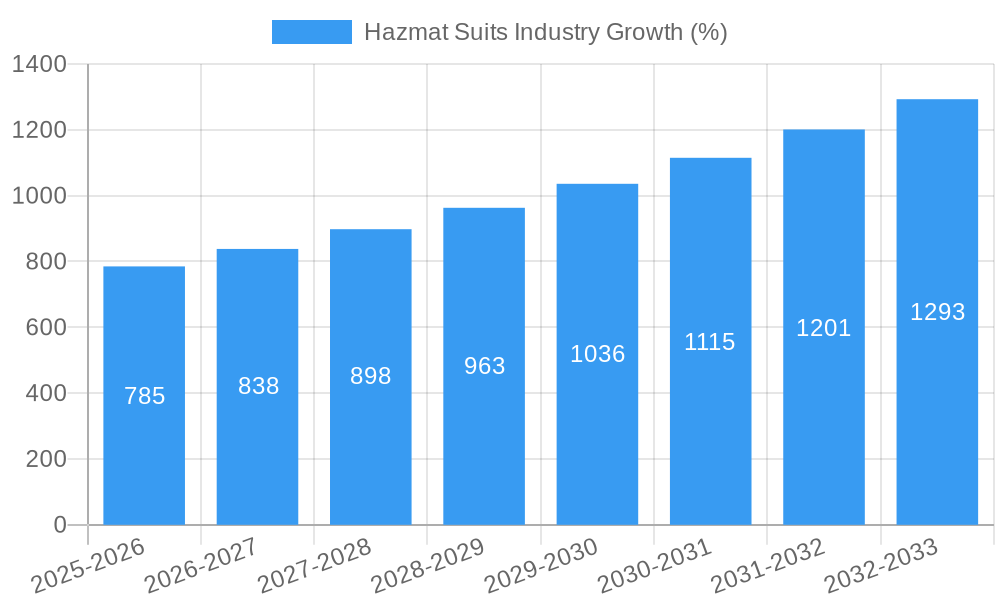
The global hazmat suits market, valued at $10.1 billion in 2025, is projected to experience robust growth, driven by a compound annual growth rate (CAGR) of 7.55% from 2025 to 2033. This expansion is fueled by several key factors. The increasing prevalence of hazardous materials handling across various industries, including pharmaceutical manufacturing, biotechnology research, and chemical processing, necessitates the widespread adoption of protective hazmat suits. Furthermore, heightened awareness of biohazards and infectious diseases, particularly post-pandemic, has significantly increased demand for high-quality protective gear. Stringent government regulations concerning worker safety and environmental protection further contribute to market growth. Technological advancements in suit materials, offering enhanced protection against chemical spills, biological threats, and extreme temperatures, are also driving market expansion. Growth is expected to be particularly strong in regions with rapidly developing industrial sectors, such as Asia-Pacific, fueled by increased manufacturing activities and infrastructure development. Market segmentation reveals that Level A suits, offering the highest level of protection, command a significant share, reflecting a growing preference for robust safety measures. Competition within the market is fierce, with major players like Kimberly-Clark, 3M, and DuPont constantly innovating to improve product features and expand their market share.
While the market presents substantial opportunities, certain restraints exist. Fluctuations in raw material prices, particularly for specialized materials used in high-performance hazmat suits, can impact profitability. The high initial investment required for purchasing advanced suits might pose a challenge for smaller companies or developing economies. However, the increasing emphasis on occupational safety and health is likely to outweigh these restraints, leading to sustained market expansion in the coming years. The consistent demand from diverse end-users and continuous improvements in suit technology ensures the hazmat suits market will maintain its upward trajectory throughout the forecast period. The segment focusing on chemical waste and infection control will likely show the highest growth due to the increasing need for protection against chemical spills and infectious diseases.
Hazmat Suits Industry Market Report: 2019-2033
This comprehensive report provides a detailed analysis of the Hazmat Suits industry, encompassing market dynamics, growth trends, regional dominance, product landscape, key players, and future outlook. The study period covers 2019-2033, with a base year of 2025 and a forecast period of 2025-2033. The report is designed to equip industry professionals, investors, and researchers with actionable insights to navigate this crucial sector. The total market size in 2025 is estimated at XX Million units.
Hazmat Suits Industry Market Dynamics & Structure
The Hazmat Suits market is characterized by a moderately concentrated landscape, with key players like Kimberly-Clark Worldwide Inc, 3M, and DuPont holding significant market shares. Technological innovation, driven by advancements in materials science and protective garment design, is a key driver. Stringent regulatory frameworks, particularly concerning worker safety and environmental protection, shape industry practices. Competitive substitutes, such as specialized protective clothing for specific hazards, exert pressure. End-user demographics vary significantly across applications, ranging from pharmaceutical and biotechnology industries to broader sectors like waste management and emergency response. Mergers and acquisitions (M&A) activity has been moderate, with collaborations like the Kappler and Lakeland partnership in May 2022 aiming to expand market reach.
- Market Concentration: Moderately concentrated, with top 5 players holding approximately xx% market share in 2025.
- Technological Innovation: Focus on lightweight, breathable, and durable materials; enhanced comfort and ergonomics; improved chemical resistance.
- Regulatory Framework: Compliance with OSHA, EPA, and other international safety regulations is paramount.
- Competitive Substitutes: Specialized protective clothing for niche hazards creates competition.
- M&A Activity: Moderate activity, driven by expansion into new markets and access to technologies. xx M&A deals recorded between 2019-2024.
- Innovation Barriers: High R&D costs, stringent testing and certification requirements.
Hazmat Suits Industry Growth Trends & Insights
The Hazmat Suits market experienced a CAGR of xx% during the historical period (2019-2024). This growth is attributed to increasing awareness of workplace safety, stringent regulatory requirements, and rising demand across various end-user industries. The COVID-19 pandemic significantly impacted demand, particularly in the infection control segment. Technological disruptions, such as the development of advanced materials and wearable cooling systems (as seen with MBO Group's innovation), are driving market expansion and improved product performance. Consumer behavior shifts toward premium, higher-performing suits are also observed. Market penetration remains relatively low in emerging economies, presenting considerable growth opportunities. The projected CAGR for 2025-2033 is xx%.
Dominant Regions, Countries, or Segments in Hazmat Suits Industry
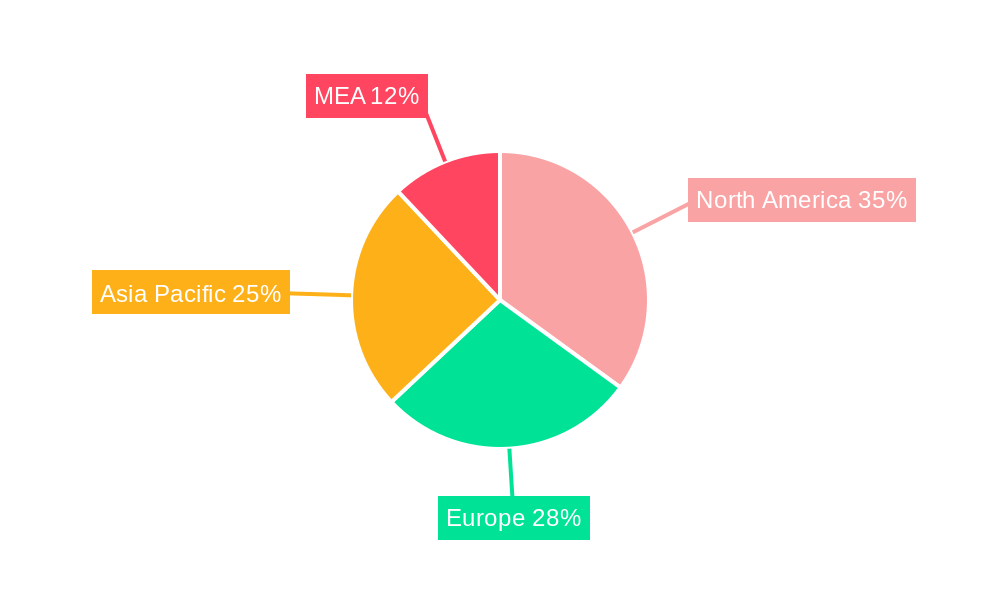
North America and Europe currently dominate the Hazmat Suits market, driven by strong regulatory frameworks and established industrial bases. However, Asia-Pacific is projected to exhibit the fastest growth in the forecast period, fueled by rapid industrialization and increasing awareness of occupational safety. Within segments, Level A and B suits are currently the largest, catering to the highest protection needs; however, demand for specialized suits for specific applications, like fire/high temperatures and chemical waste, is also increasing rapidly. The pharmaceutical and biotechnology industries remain key end-users.
- Key Growth Drivers: Stringent safety regulations, rising industrialization in developing countries, increasing awareness of hazardous materials, pandemic-driven demand.
- Regional Dominance: North America and Europe currently hold the largest market share, with Asia-Pacific exhibiting the highest growth potential.
- Segment Dominance: Level A and B suits currently lead in market share, with growth expected across all types driven by niche applications.
Hazmat Suits Industry Product Landscape
Hazmat suits are constantly evolving to improve comfort, durability, and protection. Innovations focus on lightweight, breathable materials that offer superior barrier protection against various hazards. Key performance metrics include chemical resistance, thermal protection, breathability, and durability. Unique selling propositions often emphasize superior comfort, ease of donning and doffing, and enhanced visibility features. Technological advancements in materials science, like the development of nanomaterials, are continuously improving performance and extending product lifecycles.
Key Drivers, Barriers & Challenges in Hazmat Suits Industry
Key Drivers:
- Growing awareness of workplace safety and hazardous material handling.
- Increasing stringency of safety regulations and compliance requirements.
- Expansion of industries utilizing hazmat suits (e.g., pharmaceuticals, biotechnology, waste management).
- Technological advancements improving suit performance and comfort.
Key Challenges and Restraints:
- High manufacturing costs and prices impacting affordability.
- Supply chain disruptions affecting material availability and pricing.
- Intense competition among established and emerging players.
- Difficulty in balancing protection and comfort.
- Regulatory complexities varying across different regions.
Emerging Opportunities in Hazmat Suits Industry
- Untapped markets in developing economies with growing industrial sectors.
- Development of specialized suits for niche applications (e.g., nuclear power, space exploration).
- Growing demand for reusable and sustainable hazmat suits.
- Increased focus on integrating technological advancements, like smart sensors, for enhanced safety monitoring.
- Expansion into new applications, such as emergency response and disaster relief.
Growth Accelerators in the Hazmat Suits Industry
Technological breakthroughs, particularly in material science and design, are crucial for enhancing performance and reducing costs. Strategic partnerships, like the Kappler and Lakeland collaboration, broaden market access and strengthen product portfolios. Expansion into new geographic regions, particularly in rapidly developing economies, holds substantial growth potential.
Key Players Shaping the Hazmat Suits Industry Market
- Kimberly-Clark Worldwide Inc
- 3M
- Kappler
- Halyard Health Inc
- DuPont
- Dragerwerk AG & Co KGaA
- ANSELL LTD
- DGD HAZMAT
- Lakeland Inc
- MATISEC
- Respirex
- Lancs Industries
Notable Milestones in Hazmat Suits Industry Sector
- July 2022: MBO Group launches a wearable air-conditioning system for hazmat-suited workers, addressing comfort challenges in high-temperature environments.
- May 2022: Kappler and Lakeland partner to expand their reach in the Indian chemical worker protection market.
In-Depth Hazmat Suits Industry Market Outlook
The Hazmat Suits market is poised for significant growth, driven by technological advancements, expanding applications, and increasing demand from various industries globally. Strategic partnerships, focused R&D, and targeted market expansion initiatives will be key for players seeking to capture market share in this evolving sector. The future will likely see greater emphasis on sustainability, enhanced comfort, and the integration of advanced technologies to improve safety and efficiency.
Hazmat Suits Industry Segmentation
-
1. Type
- 1.1. Level A
- 1.2. Level B
- 1.3. Level C
- 1.4. Level D
-
2. Application
- 2.1. Chemical Waste
- 2.2. Infection Control
- 2.3. Bio-hazard and Hazardous Material
- 2.4. Fire/High Temperatures
-
3. End-User
- 3.1. Pharmaceutical Industry
- 3.2. Biotechnology Industry
- 3.3. Other End Users
Hazmat Suits Industry Segmentation By Geography
-
1. North America
- 1.1. United States
- 1.2. Canada
- 1.3. Mexico
-
2. Europe
- 2.1. Germany
- 2.2. United Kingdom
- 2.3. France
- 2.4. Italy
- 2.5. Spain
- 2.6. Rest of Europe
-
3. Asia Pacific
- 3.1. China
- 3.2. Japan
- 3.3. India
- 3.4. Australia
- 3.5. South Korea
- 3.6. Rest of Asia Pacific
-
4. Middle East and Africa
- 4.1. GCC
- 4.2. South Africa
- 4.3. Rest of Middle East and Africa
-
5. South America
- 5.1. Brazil
- 5.2. Argentina
- 5.3. Rest of South America
Hazmat Suits Industry REPORT HIGHLIGHTS
| Aspects | Details |
|---|---|
| Study Period | 2019-2033 |
| Base Year | 2024 |
| Estimated Year | 2025 |
| Forecast Period | 2025-2033 |
| Historical Period | 2019-2024 |
| Growth Rate | CAGR of 7.55% from 2019-2033 |
| Segmentation |
|
Table of Contents
- 1. Introduction
- 1.1. Research Scope
- 1.2. Market Segmentation
- 1.3. Research Methodology
- 1.4. Definitions and Assumptions
- 2. Executive Summary
- 2.1. Introduction
- 3. Market Dynamics
- 3.1. Introduction
- 3.2. Market Drivers
- 3.2.1 Governments and regulatory bodies are implementing stricter safety standards regarding hazardous materials handling
- 3.2.2 driving demand for effective protective equipment
- 3.2.3 including hazmat suits
- 3.3. Market Restrains
- 3.3.1. The prevalence of counterfeit and substandard protective gear in the market poses significant risks to users and can undermine the integrity of the industry
- 3.4. Market Trends
- 3.4.1 Ongoing research and innovation in materials science are leading to the development of lighter
- 3.4.2 more breathable
- 3.4.3 and more protective hazmat suits that enhance wearer comfort and safety
- 4. Market Factor Analysis
- 4.1. Porters Five Forces
- 4.2. Supply/Value Chain
- 4.3. PESTEL analysis
- 4.4. Market Entropy
- 4.5. Patent/Trademark Analysis
- 5. Global Hazmat Suits Industry Analysis, Insights and Forecast, 2019-2031
- 5.1. Market Analysis, Insights and Forecast - by Type
- 5.1.1. Level A
- 5.1.2. Level B
- 5.1.3. Level C
- 5.1.4. Level D
- 5.2. Market Analysis, Insights and Forecast - by Application
- 5.2.1. Chemical Waste
- 5.2.2. Infection Control
- 5.2.3. Bio-hazard and Hazardous Material
- 5.2.4. Fire/High Temperatures
- 5.3. Market Analysis, Insights and Forecast - by End-User
- 5.3.1. Pharmaceutical Industry
- 5.3.2. Biotechnology Industry
- 5.3.3. Other End Users
- 5.4. Market Analysis, Insights and Forecast - by Region
- 5.4.1. North America
- 5.4.2. Europe
- 5.4.3. Asia Pacific
- 5.4.4. Middle East and Africa
- 5.4.5. South America
- 5.1. Market Analysis, Insights and Forecast - by Type
- 6. North America Hazmat Suits Industry Analysis, Insights and Forecast, 2019-2031
- 6.1. Market Analysis, Insights and Forecast - by Type
- 6.1.1. Level A
- 6.1.2. Level B
- 6.1.3. Level C
- 6.1.4. Level D
- 6.2. Market Analysis, Insights and Forecast - by Application
- 6.2.1. Chemical Waste
- 6.2.2. Infection Control
- 6.2.3. Bio-hazard and Hazardous Material
- 6.2.4. Fire/High Temperatures
- 6.3. Market Analysis, Insights and Forecast - by End-User
- 6.3.1. Pharmaceutical Industry
- 6.3.2. Biotechnology Industry
- 6.3.3. Other End Users
- 6.1. Market Analysis, Insights and Forecast - by Type
- 7. Europe Hazmat Suits Industry Analysis, Insights and Forecast, 2019-2031
- 7.1. Market Analysis, Insights and Forecast - by Type
- 7.1.1. Level A
- 7.1.2. Level B
- 7.1.3. Level C
- 7.1.4. Level D
- 7.2. Market Analysis, Insights and Forecast - by Application
- 7.2.1. Chemical Waste
- 7.2.2. Infection Control
- 7.2.3. Bio-hazard and Hazardous Material
- 7.2.4. Fire/High Temperatures
- 7.3. Market Analysis, Insights and Forecast - by End-User
- 7.3.1. Pharmaceutical Industry
- 7.3.2. Biotechnology Industry
- 7.3.3. Other End Users
- 7.1. Market Analysis, Insights and Forecast - by Type
- 8. Asia Pacific Hazmat Suits Industry Analysis, Insights and Forecast, 2019-2031
- 8.1. Market Analysis, Insights and Forecast - by Type
- 8.1.1. Level A
- 8.1.2. Level B
- 8.1.3. Level C
- 8.1.4. Level D
- 8.2. Market Analysis, Insights and Forecast - by Application
- 8.2.1. Chemical Waste
- 8.2.2. Infection Control
- 8.2.3. Bio-hazard and Hazardous Material
- 8.2.4. Fire/High Temperatures
- 8.3. Market Analysis, Insights and Forecast - by End-User
- 8.3.1. Pharmaceutical Industry
- 8.3.2. Biotechnology Industry
- 8.3.3. Other End Users
- 8.1. Market Analysis, Insights and Forecast - by Type
- 9. Middle East and Africa Hazmat Suits Industry Analysis, Insights and Forecast, 2019-2031
- 9.1. Market Analysis, Insights and Forecast - by Type
- 9.1.1. Level A
- 9.1.2. Level B
- 9.1.3. Level C
- 9.1.4. Level D
- 9.2. Market Analysis, Insights and Forecast - by Application
- 9.2.1. Chemical Waste
- 9.2.2. Infection Control
- 9.2.3. Bio-hazard and Hazardous Material
- 9.2.4. Fire/High Temperatures
- 9.3. Market Analysis, Insights and Forecast - by End-User
- 9.3.1. Pharmaceutical Industry
- 9.3.2. Biotechnology Industry
- 9.3.3. Other End Users
- 9.1. Market Analysis, Insights and Forecast - by Type
- 10. South America Hazmat Suits Industry Analysis, Insights and Forecast, 2019-2031
- 10.1. Market Analysis, Insights and Forecast - by Type
- 10.1.1. Level A
- 10.1.2. Level B
- 10.1.3. Level C
- 10.1.4. Level D
- 10.2. Market Analysis, Insights and Forecast - by Application
- 10.2.1. Chemical Waste
- 10.2.2. Infection Control
- 10.2.3. Bio-hazard and Hazardous Material
- 10.2.4. Fire/High Temperatures
- 10.3. Market Analysis, Insights and Forecast - by End-User
- 10.3.1. Pharmaceutical Industry
- 10.3.2. Biotechnology Industry
- 10.3.3. Other End Users
- 10.1. Market Analysis, Insights and Forecast - by Type
- 11. North America Hazmat Suits Industry Analysis, Insights and Forecast, 2019-2031
- 11.1. Market Analysis, Insights and Forecast - By Country/Sub-region
- 11.1.1 United States
- 11.1.2 Canada
- 11.1.3 Mexico
- 12. South America Hazmat Suits Industry Analysis, Insights and Forecast, 2019-2031
- 12.1. Market Analysis, Insights and Forecast - By Country/Sub-region
- 12.1.1 Brazil
- 12.1.2 Mexico
- 12.1.3 Rest of South America
- 13. Europe Hazmat Suits Industry Analysis, Insights and Forecast, 2019-2031
- 13.1. Market Analysis, Insights and Forecast - By Country/Sub-region
- 13.1.1 United Kingdom
- 13.1.2 Germany
- 13.1.3 France
- 13.1.4 Italy
- 13.1.5 Spain
- 13.1.6 Russia
- 13.1.7 Rest of Europe
- 14. Asia Pacific Hazmat Suits Industry Analysis, Insights and Forecast, 2019-2031
- 14.1. Market Analysis, Insights and Forecast - By Country/Sub-region
- 14.1.1 China
- 14.1.2 Japan
- 14.1.3 India
- 14.1.4 South Korea
- 14.1.5 Taiwan
- 14.1.6 Australia
- 14.1.7 Rest of Asia-Pacific
- 15. MEA Hazmat Suits Industry Analysis, Insights and Forecast, 2019-2031
- 15.1. Market Analysis, Insights and Forecast - By Country/Sub-region
- 15.1.1 Middle East
- 15.1.2 Africa
- 16. Competitive Analysis
- 16.1. Global Market Share Analysis 2024
- 16.2. Company Profiles
- 16.2.1 Kimberly-Clark Worldwide Inc
- 16.2.1.1. Overview
- 16.2.1.2. Products
- 16.2.1.3. SWOT Analysis
- 16.2.1.4. Recent Developments
- 16.2.1.5. Financials (Based on Availability)
- 16.2.2 3M
- 16.2.2.1. Overview
- 16.2.2.2. Products
- 16.2.2.3. SWOT Analysis
- 16.2.2.4. Recent Developments
- 16.2.2.5. Financials (Based on Availability)
- 16.2.3 Kappler
- 16.2.3.1. Overview
- 16.2.3.2. Products
- 16.2.3.3. SWOT Analysis
- 16.2.3.4. Recent Developments
- 16.2.3.5. Financials (Based on Availability)
- 16.2.4 Halyard Health Inc
- 16.2.4.1. Overview
- 16.2.4.2. Products
- 16.2.4.3. SWOT Analysis
- 16.2.4.4. Recent Developments
- 16.2.4.5. Financials (Based on Availability)
- 16.2.5 DuPont
- 16.2.5.1. Overview
- 16.2.5.2. Products
- 16.2.5.3. SWOT Analysis
- 16.2.5.4. Recent Developments
- 16.2.5.5. Financials (Based on Availability)
- 16.2.6 Dragerwerk AG & Co KGaA
- 16.2.6.1. Overview
- 16.2.6.2. Products
- 16.2.6.3. SWOT Analysis
- 16.2.6.4. Recent Developments
- 16.2.6.5. Financials (Based on Availability)
- 16.2.7 ANSELL LTD
- 16.2.7.1. Overview
- 16.2.7.2. Products
- 16.2.7.3. SWOT Analysis
- 16.2.7.4. Recent Developments
- 16.2.7.5. Financials (Based on Availability)
- 16.2.8 DGD HAZMAT
- 16.2.8.1. Overview
- 16.2.8.2. Products
- 16.2.8.3. SWOT Analysis
- 16.2.8.4. Recent Developments
- 16.2.8.5. Financials (Based on Availability)
- 16.2.9 Lakeland Inc
- 16.2.9.1. Overview
- 16.2.9.2. Products
- 16.2.9.3. SWOT Analysis
- 16.2.9.4. Recent Developments
- 16.2.9.5. Financials (Based on Availability)
- 16.2.10 MATISEC
- 16.2.10.1. Overview
- 16.2.10.2. Products
- 16.2.10.3. SWOT Analysis
- 16.2.10.4. Recent Developments
- 16.2.10.5. Financials (Based on Availability)
- 16.2.11 Respirex
- 16.2.11.1. Overview
- 16.2.11.2. Products
- 16.2.11.3. SWOT Analysis
- 16.2.11.4. Recent Developments
- 16.2.11.5. Financials (Based on Availability)
- 16.2.12 Lancs Industries
- 16.2.12.1. Overview
- 16.2.12.2. Products
- 16.2.12.3. SWOT Analysis
- 16.2.12.4. Recent Developments
- 16.2.12.5. Financials (Based on Availability)
- 16.2.1 Kimberly-Clark Worldwide Inc
List of Figures
- Figure 1: Global Hazmat Suits Industry Revenue Breakdown (Million, %) by Region 2024 & 2032
- Figure 2: Global Hazmat Suits Industry Volume Breakdown (K Units, %) by Region 2024 & 2032
- Figure 3: North America Hazmat Suits Industry Revenue (Million), by Country 2024 & 2032
- Figure 4: North America Hazmat Suits Industry Volume (K Units), by Country 2024 & 2032
- Figure 5: North America Hazmat Suits Industry Revenue Share (%), by Country 2024 & 2032
- Figure 6: North America Hazmat Suits Industry Volume Share (%), by Country 2024 & 2032
- Figure 7: South America Hazmat Suits Industry Revenue (Million), by Country 2024 & 2032
- Figure 8: South America Hazmat Suits Industry Volume (K Units), by Country 2024 & 2032
- Figure 9: South America Hazmat Suits Industry Revenue Share (%), by Country 2024 & 2032
- Figure 10: South America Hazmat Suits Industry Volume Share (%), by Country 2024 & 2032
- Figure 11: Europe Hazmat Suits Industry Revenue (Million), by Country 2024 & 2032
- Figure 12: Europe Hazmat Suits Industry Volume (K Units), by Country 2024 & 2032
- Figure 13: Europe Hazmat Suits Industry Revenue Share (%), by Country 2024 & 2032
- Figure 14: Europe Hazmat Suits Industry Volume Share (%), by Country 2024 & 2032
- Figure 15: Asia Pacific Hazmat Suits Industry Revenue (Million), by Country 2024 & 2032
- Figure 16: Asia Pacific Hazmat Suits Industry Volume (K Units), by Country 2024 & 2032
- Figure 17: Asia Pacific Hazmat Suits Industry Revenue Share (%), by Country 2024 & 2032
- Figure 18: Asia Pacific Hazmat Suits Industry Volume Share (%), by Country 2024 & 2032
- Figure 19: MEA Hazmat Suits Industry Revenue (Million), by Country 2024 & 2032
- Figure 20: MEA Hazmat Suits Industry Volume (K Units), by Country 2024 & 2032
- Figure 21: MEA Hazmat Suits Industry Revenue Share (%), by Country 2024 & 2032
- Figure 22: MEA Hazmat Suits Industry Volume Share (%), by Country 2024 & 2032
- Figure 23: North America Hazmat Suits Industry Revenue (Million), by Type 2024 & 2032
- Figure 24: North America Hazmat Suits Industry Volume (K Units), by Type 2024 & 2032
- Figure 25: North America Hazmat Suits Industry Revenue Share (%), by Type 2024 & 2032
- Figure 26: North America Hazmat Suits Industry Volume Share (%), by Type 2024 & 2032
- Figure 27: North America Hazmat Suits Industry Revenue (Million), by Application 2024 & 2032
- Figure 28: North America Hazmat Suits Industry Volume (K Units), by Application 2024 & 2032
- Figure 29: North America Hazmat Suits Industry Revenue Share (%), by Application 2024 & 2032
- Figure 30: North America Hazmat Suits Industry Volume Share (%), by Application 2024 & 2032
- Figure 31: North America Hazmat Suits Industry Revenue (Million), by End-User 2024 & 2032
- Figure 32: North America Hazmat Suits Industry Volume (K Units), by End-User 2024 & 2032
- Figure 33: North America Hazmat Suits Industry Revenue Share (%), by End-User 2024 & 2032
- Figure 34: North America Hazmat Suits Industry Volume Share (%), by End-User 2024 & 2032
- Figure 35: North America Hazmat Suits Industry Revenue (Million), by Country 2024 & 2032
- Figure 36: North America Hazmat Suits Industry Volume (K Units), by Country 2024 & 2032
- Figure 37: North America Hazmat Suits Industry Revenue Share (%), by Country 2024 & 2032
- Figure 38: North America Hazmat Suits Industry Volume Share (%), by Country 2024 & 2032
- Figure 39: Europe Hazmat Suits Industry Revenue (Million), by Type 2024 & 2032
- Figure 40: Europe Hazmat Suits Industry Volume (K Units), by Type 2024 & 2032
- Figure 41: Europe Hazmat Suits Industry Revenue Share (%), by Type 2024 & 2032
- Figure 42: Europe Hazmat Suits Industry Volume Share (%), by Type 2024 & 2032
- Figure 43: Europe Hazmat Suits Industry Revenue (Million), by Application 2024 & 2032
- Figure 44: Europe Hazmat Suits Industry Volume (K Units), by Application 2024 & 2032
- Figure 45: Europe Hazmat Suits Industry Revenue Share (%), by Application 2024 & 2032
- Figure 46: Europe Hazmat Suits Industry Volume Share (%), by Application 2024 & 2032
- Figure 47: Europe Hazmat Suits Industry Revenue (Million), by End-User 2024 & 2032
- Figure 48: Europe Hazmat Suits Industry Volume (K Units), by End-User 2024 & 2032
- Figure 49: Europe Hazmat Suits Industry Revenue Share (%), by End-User 2024 & 2032
- Figure 50: Europe Hazmat Suits Industry Volume Share (%), by End-User 2024 & 2032
- Figure 51: Europe Hazmat Suits Industry Revenue (Million), by Country 2024 & 2032
- Figure 52: Europe Hazmat Suits Industry Volume (K Units), by Country 2024 & 2032
- Figure 53: Europe Hazmat Suits Industry Revenue Share (%), by Country 2024 & 2032
- Figure 54: Europe Hazmat Suits Industry Volume Share (%), by Country 2024 & 2032
- Figure 55: Asia Pacific Hazmat Suits Industry Revenue (Million), by Type 2024 & 2032
- Figure 56: Asia Pacific Hazmat Suits Industry Volume (K Units), by Type 2024 & 2032
- Figure 57: Asia Pacific Hazmat Suits Industry Revenue Share (%), by Type 2024 & 2032
- Figure 58: Asia Pacific Hazmat Suits Industry Volume Share (%), by Type 2024 & 2032
- Figure 59: Asia Pacific Hazmat Suits Industry Revenue (Million), by Application 2024 & 2032
- Figure 60: Asia Pacific Hazmat Suits Industry Volume (K Units), by Application 2024 & 2032
- Figure 61: Asia Pacific Hazmat Suits Industry Revenue Share (%), by Application 2024 & 2032
- Figure 62: Asia Pacific Hazmat Suits Industry Volume Share (%), by Application 2024 & 2032
- Figure 63: Asia Pacific Hazmat Suits Industry Revenue (Million), by End-User 2024 & 2032
- Figure 64: Asia Pacific Hazmat Suits Industry Volume (K Units), by End-User 2024 & 2032
- Figure 65: Asia Pacific Hazmat Suits Industry Revenue Share (%), by End-User 2024 & 2032
- Figure 66: Asia Pacific Hazmat Suits Industry Volume Share (%), by End-User 2024 & 2032
- Figure 67: Asia Pacific Hazmat Suits Industry Revenue (Million), by Country 2024 & 2032
- Figure 68: Asia Pacific Hazmat Suits Industry Volume (K Units), by Country 2024 & 2032
- Figure 69: Asia Pacific Hazmat Suits Industry Revenue Share (%), by Country 2024 & 2032
- Figure 70: Asia Pacific Hazmat Suits Industry Volume Share (%), by Country 2024 & 2032
- Figure 71: Middle East and Africa Hazmat Suits Industry Revenue (Million), by Type 2024 & 2032
- Figure 72: Middle East and Africa Hazmat Suits Industry Volume (K Units), by Type 2024 & 2032
- Figure 73: Middle East and Africa Hazmat Suits Industry Revenue Share (%), by Type 2024 & 2032
- Figure 74: Middle East and Africa Hazmat Suits Industry Volume Share (%), by Type 2024 & 2032
- Figure 75: Middle East and Africa Hazmat Suits Industry Revenue (Million), by Application 2024 & 2032
- Figure 76: Middle East and Africa Hazmat Suits Industry Volume (K Units), by Application 2024 & 2032
- Figure 77: Middle East and Africa Hazmat Suits Industry Revenue Share (%), by Application 2024 & 2032
- Figure 78: Middle East and Africa Hazmat Suits Industry Volume Share (%), by Application 2024 & 2032
- Figure 79: Middle East and Africa Hazmat Suits Industry Revenue (Million), by End-User 2024 & 2032
- Figure 80: Middle East and Africa Hazmat Suits Industry Volume (K Units), by End-User 2024 & 2032
- Figure 81: Middle East and Africa Hazmat Suits Industry Revenue Share (%), by End-User 2024 & 2032
- Figure 82: Middle East and Africa Hazmat Suits Industry Volume Share (%), by End-User 2024 & 2032
- Figure 83: Middle East and Africa Hazmat Suits Industry Revenue (Million), by Country 2024 & 2032
- Figure 84: Middle East and Africa Hazmat Suits Industry Volume (K Units), by Country 2024 & 2032
- Figure 85: Middle East and Africa Hazmat Suits Industry Revenue Share (%), by Country 2024 & 2032
- Figure 86: Middle East and Africa Hazmat Suits Industry Volume Share (%), by Country 2024 & 2032
- Figure 87: South America Hazmat Suits Industry Revenue (Million), by Type 2024 & 2032
- Figure 88: South America Hazmat Suits Industry Volume (K Units), by Type 2024 & 2032
- Figure 89: South America Hazmat Suits Industry Revenue Share (%), by Type 2024 & 2032
- Figure 90: South America Hazmat Suits Industry Volume Share (%), by Type 2024 & 2032
- Figure 91: South America Hazmat Suits Industry Revenue (Million), by Application 2024 & 2032
- Figure 92: South America Hazmat Suits Industry Volume (K Units), by Application 2024 & 2032
- Figure 93: South America Hazmat Suits Industry Revenue Share (%), by Application 2024 & 2032
- Figure 94: South America Hazmat Suits Industry Volume Share (%), by Application 2024 & 2032
- Figure 95: South America Hazmat Suits Industry Revenue (Million), by End-User 2024 & 2032
- Figure 96: South America Hazmat Suits Industry Volume (K Units), by End-User 2024 & 2032
- Figure 97: South America Hazmat Suits Industry Revenue Share (%), by End-User 2024 & 2032
- Figure 98: South America Hazmat Suits Industry Volume Share (%), by End-User 2024 & 2032
- Figure 99: South America Hazmat Suits Industry Revenue (Million), by Country 2024 & 2032
- Figure 100: South America Hazmat Suits Industry Volume (K Units), by Country 2024 & 2032
- Figure 101: South America Hazmat Suits Industry Revenue Share (%), by Country 2024 & 2032
- Figure 102: South America Hazmat Suits Industry Volume Share (%), by Country 2024 & 2032
List of Tables
- Table 1: Global Hazmat Suits Industry Revenue Million Forecast, by Region 2019 & 2032
- Table 2: Global Hazmat Suits Industry Volume K Units Forecast, by Region 2019 & 2032
- Table 3: Global Hazmat Suits Industry Revenue Million Forecast, by Type 2019 & 2032
- Table 4: Global Hazmat Suits Industry Volume K Units Forecast, by Type 2019 & 2032
- Table 5: Global Hazmat Suits Industry Revenue Million Forecast, by Application 2019 & 2032
- Table 6: Global Hazmat Suits Industry Volume K Units Forecast, by Application 2019 & 2032
- Table 7: Global Hazmat Suits Industry Revenue Million Forecast, by End-User 2019 & 2032
- Table 8: Global Hazmat Suits Industry Volume K Units Forecast, by End-User 2019 & 2032
- Table 9: Global Hazmat Suits Industry Revenue Million Forecast, by Region 2019 & 2032
- Table 10: Global Hazmat Suits Industry Volume K Units Forecast, by Region 2019 & 2032
- Table 11: Global Hazmat Suits Industry Revenue Million Forecast, by Country 2019 & 2032
- Table 12: Global Hazmat Suits Industry Volume K Units Forecast, by Country 2019 & 2032
- Table 13: United States Hazmat Suits Industry Revenue (Million) Forecast, by Application 2019 & 2032
- Table 14: United States Hazmat Suits Industry Volume (K Units) Forecast, by Application 2019 & 2032
- Table 15: Canada Hazmat Suits Industry Revenue (Million) Forecast, by Application 2019 & 2032
- Table 16: Canada Hazmat Suits Industry Volume (K Units) Forecast, by Application 2019 & 2032
- Table 17: Mexico Hazmat Suits Industry Revenue (Million) Forecast, by Application 2019 & 2032
- Table 18: Mexico Hazmat Suits Industry Volume (K Units) Forecast, by Application 2019 & 2032
- Table 19: Global Hazmat Suits Industry Revenue Million Forecast, by Country 2019 & 2032
- Table 20: Global Hazmat Suits Industry Volume K Units Forecast, by Country 2019 & 2032
- Table 21: Brazil Hazmat Suits Industry Revenue (Million) Forecast, by Application 2019 & 2032
- Table 22: Brazil Hazmat Suits Industry Volume (K Units) Forecast, by Application 2019 & 2032
- Table 23: Mexico Hazmat Suits Industry Revenue (Million) Forecast, by Application 2019 & 2032
- Table 24: Mexico Hazmat Suits Industry Volume (K Units) Forecast, by Application 2019 & 2032
- Table 25: Rest of South America Hazmat Suits Industry Revenue (Million) Forecast, by Application 2019 & 2032
- Table 26: Rest of South America Hazmat Suits Industry Volume (K Units) Forecast, by Application 2019 & 2032
- Table 27: Global Hazmat Suits Industry Revenue Million Forecast, by Country 2019 & 2032
- Table 28: Global Hazmat Suits Industry Volume K Units Forecast, by Country 2019 & 2032
- Table 29: United Kingdom Hazmat Suits Industry Revenue (Million) Forecast, by Application 2019 & 2032
- Table 30: United Kingdom Hazmat Suits Industry Volume (K Units) Forecast, by Application 2019 & 2032
- Table 31: Germany Hazmat Suits Industry Revenue (Million) Forecast, by Application 2019 & 2032
- Table 32: Germany Hazmat Suits Industry Volume (K Units) Forecast, by Application 2019 & 2032
- Table 33: France Hazmat Suits Industry Revenue (Million) Forecast, by Application 2019 & 2032
- Table 34: France Hazmat Suits Industry Volume (K Units) Forecast, by Application 2019 & 2032
- Table 35: Italy Hazmat Suits Industry Revenue (Million) Forecast, by Application 2019 & 2032
- Table 36: Italy Hazmat Suits Industry Volume (K Units) Forecast, by Application 2019 & 2032
- Table 37: Spain Hazmat Suits Industry Revenue (Million) Forecast, by Application 2019 & 2032
- Table 38: Spain Hazmat Suits Industry Volume (K Units) Forecast, by Application 2019 & 2032
- Table 39: Russia Hazmat Suits Industry Revenue (Million) Forecast, by Application 2019 & 2032
- Table 40: Russia Hazmat Suits Industry Volume (K Units) Forecast, by Application 2019 & 2032
- Table 41: Rest of Europe Hazmat Suits Industry Revenue (Million) Forecast, by Application 2019 & 2032
- Table 42: Rest of Europe Hazmat Suits Industry Volume (K Units) Forecast, by Application 2019 & 2032
- Table 43: Global Hazmat Suits Industry Revenue Million Forecast, by Country 2019 & 2032
- Table 44: Global Hazmat Suits Industry Volume K Units Forecast, by Country 2019 & 2032
- Table 45: China Hazmat Suits Industry Revenue (Million) Forecast, by Application 2019 & 2032
- Table 46: China Hazmat Suits Industry Volume (K Units) Forecast, by Application 2019 & 2032
- Table 47: Japan Hazmat Suits Industry Revenue (Million) Forecast, by Application 2019 & 2032
- Table 48: Japan Hazmat Suits Industry Volume (K Units) Forecast, by Application 2019 & 2032
- Table 49: India Hazmat Suits Industry Revenue (Million) Forecast, by Application 2019 & 2032
- Table 50: India Hazmat Suits Industry Volume (K Units) Forecast, by Application 2019 & 2032
- Table 51: South Korea Hazmat Suits Industry Revenue (Million) Forecast, by Application 2019 & 2032
- Table 52: South Korea Hazmat Suits Industry Volume (K Units) Forecast, by Application 2019 & 2032
- Table 53: Taiwan Hazmat Suits Industry Revenue (Million) Forecast, by Application 2019 & 2032
- Table 54: Taiwan Hazmat Suits Industry Volume (K Units) Forecast, by Application 2019 & 2032
- Table 55: Australia Hazmat Suits Industry Revenue (Million) Forecast, by Application 2019 & 2032
- Table 56: Australia Hazmat Suits Industry Volume (K Units) Forecast, by Application 2019 & 2032
- Table 57: Rest of Asia-Pacific Hazmat Suits Industry Revenue (Million) Forecast, by Application 2019 & 2032
- Table 58: Rest of Asia-Pacific Hazmat Suits Industry Volume (K Units) Forecast, by Application 2019 & 2032
- Table 59: Global Hazmat Suits Industry Revenue Million Forecast, by Country 2019 & 2032
- Table 60: Global Hazmat Suits Industry Volume K Units Forecast, by Country 2019 & 2032
- Table 61: Middle East Hazmat Suits Industry Revenue (Million) Forecast, by Application 2019 & 2032
- Table 62: Middle East Hazmat Suits Industry Volume (K Units) Forecast, by Application 2019 & 2032
- Table 63: Africa Hazmat Suits Industry Revenue (Million) Forecast, by Application 2019 & 2032
- Table 64: Africa Hazmat Suits Industry Volume (K Units) Forecast, by Application 2019 & 2032
- Table 65: Global Hazmat Suits Industry Revenue Million Forecast, by Type 2019 & 2032
- Table 66: Global Hazmat Suits Industry Volume K Units Forecast, by Type 2019 & 2032
- Table 67: Global Hazmat Suits Industry Revenue Million Forecast, by Application 2019 & 2032
- Table 68: Global Hazmat Suits Industry Volume K Units Forecast, by Application 2019 & 2032
- Table 69: Global Hazmat Suits Industry Revenue Million Forecast, by End-User 2019 & 2032
- Table 70: Global Hazmat Suits Industry Volume K Units Forecast, by End-User 2019 & 2032
- Table 71: Global Hazmat Suits Industry Revenue Million Forecast, by Country 2019 & 2032
- Table 72: Global Hazmat Suits Industry Volume K Units Forecast, by Country 2019 & 2032
- Table 73: United States Hazmat Suits Industry Revenue (Million) Forecast, by Application 2019 & 2032
- Table 74: United States Hazmat Suits Industry Volume (K Units) Forecast, by Application 2019 & 2032
- Table 75: Canada Hazmat Suits Industry Revenue (Million) Forecast, by Application 2019 & 2032
- Table 76: Canada Hazmat Suits Industry Volume (K Units) Forecast, by Application 2019 & 2032
- Table 77: Mexico Hazmat Suits Industry Revenue (Million) Forecast, by Application 2019 & 2032
- Table 78: Mexico Hazmat Suits Industry Volume (K Units) Forecast, by Application 2019 & 2032
- Table 79: Global Hazmat Suits Industry Revenue Million Forecast, by Type 2019 & 2032
- Table 80: Global Hazmat Suits Industry Volume K Units Forecast, by Type 2019 & 2032
- Table 81: Global Hazmat Suits Industry Revenue Million Forecast, by Application 2019 & 2032
- Table 82: Global Hazmat Suits Industry Volume K Units Forecast, by Application 2019 & 2032
- Table 83: Global Hazmat Suits Industry Revenue Million Forecast, by End-User 2019 & 2032
- Table 84: Global Hazmat Suits Industry Volume K Units Forecast, by End-User 2019 & 2032
- Table 85: Global Hazmat Suits Industry Revenue Million Forecast, by Country 2019 & 2032
- Table 86: Global Hazmat Suits Industry Volume K Units Forecast, by Country 2019 & 2032
- Table 87: Germany Hazmat Suits Industry Revenue (Million) Forecast, by Application 2019 & 2032
- Table 88: Germany Hazmat Suits Industry Volume (K Units) Forecast, by Application 2019 & 2032
- Table 89: United Kingdom Hazmat Suits Industry Revenue (Million) Forecast, by Application 2019 & 2032
- Table 90: United Kingdom Hazmat Suits Industry Volume (K Units) Forecast, by Application 2019 & 2032
- Table 91: France Hazmat Suits Industry Revenue (Million) Forecast, by Application 2019 & 2032
- Table 92: France Hazmat Suits Industry Volume (K Units) Forecast, by Application 2019 & 2032
- Table 93: Italy Hazmat Suits Industry Revenue (Million) Forecast, by Application 2019 & 2032
- Table 94: Italy Hazmat Suits Industry Volume (K Units) Forecast, by Application 2019 & 2032
- Table 95: Spain Hazmat Suits Industry Revenue (Million) Forecast, by Application 2019 & 2032
- Table 96: Spain Hazmat Suits Industry Volume (K Units) Forecast, by Application 2019 & 2032
- Table 97: Rest of Europe Hazmat Suits Industry Revenue (Million) Forecast, by Application 2019 & 2032
- Table 98: Rest of Europe Hazmat Suits Industry Volume (K Units) Forecast, by Application 2019 & 2032
- Table 99: Global Hazmat Suits Industry Revenue Million Forecast, by Type 2019 & 2032
- Table 100: Global Hazmat Suits Industry Volume K Units Forecast, by Type 2019 & 2032
- Table 101: Global Hazmat Suits Industry Revenue Million Forecast, by Application 2019 & 2032
- Table 102: Global Hazmat Suits Industry Volume K Units Forecast, by Application 2019 & 2032
- Table 103: Global Hazmat Suits Industry Revenue Million Forecast, by End-User 2019 & 2032
- Table 104: Global Hazmat Suits Industry Volume K Units Forecast, by End-User 2019 & 2032
- Table 105: Global Hazmat Suits Industry Revenue Million Forecast, by Country 2019 & 2032
- Table 106: Global Hazmat Suits Industry Volume K Units Forecast, by Country 2019 & 2032
- Table 107: China Hazmat Suits Industry Revenue (Million) Forecast, by Application 2019 & 2032
- Table 108: China Hazmat Suits Industry Volume (K Units) Forecast, by Application 2019 & 2032
- Table 109: Japan Hazmat Suits Industry Revenue (Million) Forecast, by Application 2019 & 2032
- Table 110: Japan Hazmat Suits Industry Volume (K Units) Forecast, by Application 2019 & 2032
- Table 111: India Hazmat Suits Industry Revenue (Million) Forecast, by Application 2019 & 2032
- Table 112: India Hazmat Suits Industry Volume (K Units) Forecast, by Application 2019 & 2032
- Table 113: Australia Hazmat Suits Industry Revenue (Million) Forecast, by Application 2019 & 2032
- Table 114: Australia Hazmat Suits Industry Volume (K Units) Forecast, by Application 2019 & 2032
- Table 115: South Korea Hazmat Suits Industry Revenue (Million) Forecast, by Application 2019 & 2032
- Table 116: South Korea Hazmat Suits Industry Volume (K Units) Forecast, by Application 2019 & 2032
- Table 117: Rest of Asia Pacific Hazmat Suits Industry Revenue (Million) Forecast, by Application 2019 & 2032
- Table 118: Rest of Asia Pacific Hazmat Suits Industry Volume (K Units) Forecast, by Application 2019 & 2032
- Table 119: Global Hazmat Suits Industry Revenue Million Forecast, by Type 2019 & 2032
- Table 120: Global Hazmat Suits Industry Volume K Units Forecast, by Type 2019 & 2032
- Table 121: Global Hazmat Suits Industry Revenue Million Forecast, by Application 2019 & 2032
- Table 122: Global Hazmat Suits Industry Volume K Units Forecast, by Application 2019 & 2032
- Table 123: Global Hazmat Suits Industry Revenue Million Forecast, by End-User 2019 & 2032
- Table 124: Global Hazmat Suits Industry Volume K Units Forecast, by End-User 2019 & 2032
- Table 125: Global Hazmat Suits Industry Revenue Million Forecast, by Country 2019 & 2032
- Table 126: Global Hazmat Suits Industry Volume K Units Forecast, by Country 2019 & 2032
- Table 127: GCC Hazmat Suits Industry Revenue (Million) Forecast, by Application 2019 & 2032
- Table 128: GCC Hazmat Suits Industry Volume (K Units) Forecast, by Application 2019 & 2032
- Table 129: South Africa Hazmat Suits Industry Revenue (Million) Forecast, by Application 2019 & 2032
- Table 130: South Africa Hazmat Suits Industry Volume (K Units) Forecast, by Application 2019 & 2032
- Table 131: Rest of Middle East and Africa Hazmat Suits Industry Revenue (Million) Forecast, by Application 2019 & 2032
- Table 132: Rest of Middle East and Africa Hazmat Suits Industry Volume (K Units) Forecast, by Application 2019 & 2032
- Table 133: Global Hazmat Suits Industry Revenue Million Forecast, by Type 2019 & 2032
- Table 134: Global Hazmat Suits Industry Volume K Units Forecast, by Type 2019 & 2032
- Table 135: Global Hazmat Suits Industry Revenue Million Forecast, by Application 2019 & 2032
- Table 136: Global Hazmat Suits Industry Volume K Units Forecast, by Application 2019 & 2032
- Table 137: Global Hazmat Suits Industry Revenue Million Forecast, by End-User 2019 & 2032
- Table 138: Global Hazmat Suits Industry Volume K Units Forecast, by End-User 2019 & 2032
- Table 139: Global Hazmat Suits Industry Revenue Million Forecast, by Country 2019 & 2032
- Table 140: Global Hazmat Suits Industry Volume K Units Forecast, by Country 2019 & 2032
- Table 141: Brazil Hazmat Suits Industry Revenue (Million) Forecast, by Application 2019 & 2032
- Table 142: Brazil Hazmat Suits Industry Volume (K Units) Forecast, by Application 2019 & 2032
- Table 143: Argentina Hazmat Suits Industry Revenue (Million) Forecast, by Application 2019 & 2032
- Table 144: Argentina Hazmat Suits Industry Volume (K Units) Forecast, by Application 2019 & 2032
- Table 145: Rest of South America Hazmat Suits Industry Revenue (Million) Forecast, by Application 2019 & 2032
- Table 146: Rest of South America Hazmat Suits Industry Volume (K Units) Forecast, by Application 2019 & 2032
Frequently Asked Questions
1. What is the projected Compound Annual Growth Rate (CAGR) of the Hazmat Suits Industry?
The projected CAGR is approximately 7.55%.
2. Which companies are prominent players in the Hazmat Suits Industry?
Key companies in the market include Kimberly-Clark Worldwide Inc, 3M, Kappler, Halyard Health Inc, DuPont, Dragerwerk AG & Co KGaA, ANSELL LTD, DGD HAZMAT, Lakeland Inc, MATISEC, Respirex, Lancs Industries.
3. What are the main segments of the Hazmat Suits Industry?
The market segments include Type, Application, End-User.
4. Can you provide details about the market size?
The market size is estimated to be USD 10.1 Million as of 2022.
5. What are some drivers contributing to market growth?
Governments and regulatory bodies are implementing stricter safety standards regarding hazardous materials handling. driving demand for effective protective equipment. including hazmat suits.
6. What are the notable trends driving market growth?
Ongoing research and innovation in materials science are leading to the development of lighter. more breathable. and more protective hazmat suits that enhance wearer comfort and safety.
7. Are there any restraints impacting market growth?
The prevalence of counterfeit and substandard protective gear in the market poses significant risks to users and can undermine the integrity of the industry.
8. Can you provide examples of recent developments in the market?
July 2022: MBO Group, a Guangdong-based Chinese company, developed a wearable air-conditioning system tailored for hazmat-suited COVID-19 workers as daily testing became the new normal for millions nationwide. The wearable device weighed 3 kilograms and included an air conditioning system and a cooling vest. It had a temperature adjustment range of 16 to 25 degrees Celsius and can run for three hours after fully charging.
9. What pricing options are available for accessing the report?
Pricing options include single-user, multi-user, and enterprise licenses priced at USD 4750, USD 5250, and USD 8750 respectively.
10. Is the market size provided in terms of value or volume?
The market size is provided in terms of value, measured in Million and volume, measured in K Units.
11. Are there any specific market keywords associated with the report?
Yes, the market keyword associated with the report is "Hazmat Suits Industry," which aids in identifying and referencing the specific market segment covered.
12. How do I determine which pricing option suits my needs best?
The pricing options vary based on user requirements and access needs. Individual users may opt for single-user licenses, while businesses requiring broader access may choose multi-user or enterprise licenses for cost-effective access to the report.
13. Are there any additional resources or data provided in the Hazmat Suits Industry report?
While the report offers comprehensive insights, it's advisable to review the specific contents or supplementary materials provided to ascertain if additional resources or data are available.
14. How can I stay updated on further developments or reports in the Hazmat Suits Industry?
To stay informed about further developments, trends, and reports in the Hazmat Suits Industry, consider subscribing to industry newsletters, following relevant companies and organizations, or regularly checking reputable industry news sources and publications.
Methodology
Step 1 - Identification of Relevant Samples Size from Population Database


Step 2 - Approaches for Defining Global Market Size (Value, Volume* & Price*)

Note*: In applicable scenarios
Step 3 - Data Sources
Primary Research
- Web Analytics
- Survey Reports
- Research Institute
- Latest Research Reports
- Opinion Leaders
Secondary Research
- Annual Reports
- White Paper
- Latest Press Release
- Industry Association
- Paid Database
- Investor Presentations

Step 4 - Data Triangulation
Involves using different sources of information in order to increase the validity of a study
These sources are likely to be stakeholders in a program - participants, other researchers, program staff, other community members, and so on.
Then we put all data in single framework & apply various statistical tools to find out the dynamic on the market.
During the analysis stage, feedback from the stakeholder groups would be compared to determine areas of agreement as well as areas of divergence


