
Key Insights
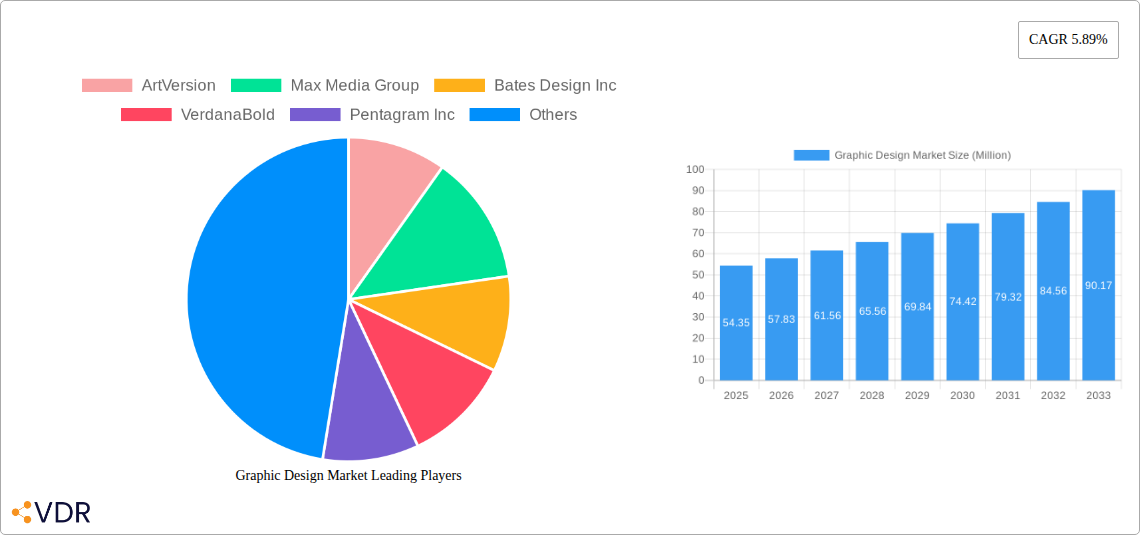
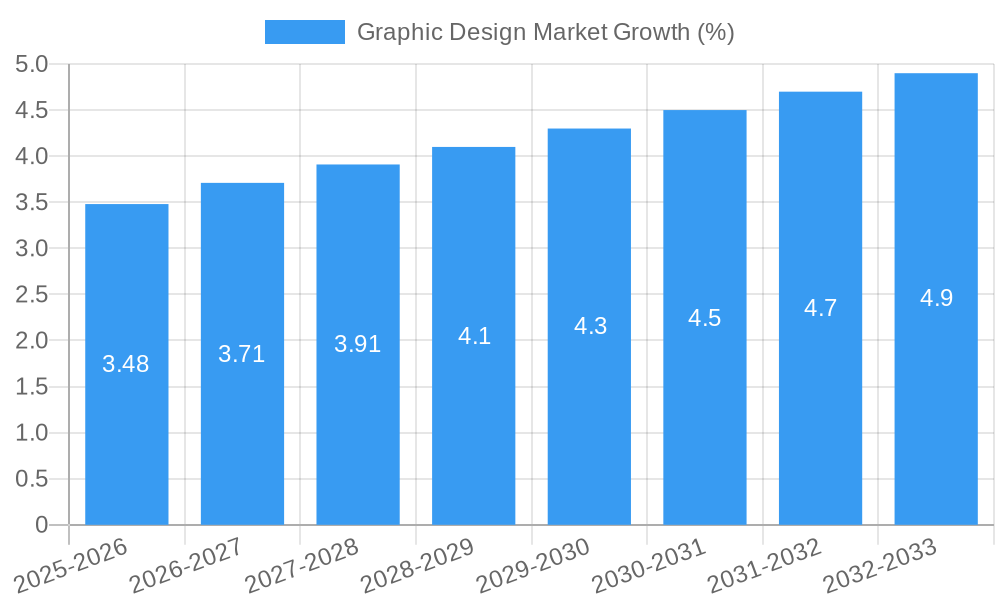
The graphic design market, currently valued at $54.35 million in 2025, is poised for robust growth, projected to expand at a compound annual growth rate (CAGR) of 5.89% from 2025 to 2033. This expansion is fueled by several key factors. The increasing demand for visually appealing content across diverse platforms, including websites, social media, and marketing materials, is a primary driver. Businesses of all sizes recognize the importance of professional graphic design in enhancing brand identity and driving customer engagement, leading to a consistently high demand for services. Furthermore, technological advancements, such as sophisticated design software and readily available online design tools, are lowering barriers to entry for both designers and businesses seeking design solutions, fostering market expansion. However, increased competition among design professionals and the fluctuating economic conditions present challenges to sustained, unhindered growth. The market is segmented by service type (logo design, web design, branding, illustration, etc.), client industry (technology, retail, healthcare, etc.), and geographic location. Key players, such as ArtVersion, Max Media Group, and Pentagram Inc., compete through specialized services, innovative technologies, and strategic partnerships.
The forecast period (2025-2033) anticipates a significant increase in market value, driven by the continued adoption of digital marketing strategies and a growing preference for visually rich content. The market's growth trajectory is likely to be influenced by macroeconomic factors, technological innovation (e.g., AI-powered design tools), and evolving consumer preferences. While competition is intense, opportunities exist for designers who specialize in niche areas, leverage innovative technologies, and effectively market their services to specific target audiences. The continued growth of e-commerce and digital media will further stimulate demand for professional graphic design services, ensuring a positive outlook for the market in the long term.
Graphic Design Market: A Comprehensive Report (2019-2033)
This in-depth report provides a comprehensive analysis of the Graphic Design Market, encompassing market dynamics, growth trends, regional insights, product landscapes, and key player analysis. With a study period spanning 2019-2033, a base year of 2025, and a forecast period of 2025-2033, this report offers invaluable insights for industry professionals, investors, and strategic decision-makers. The report covers both the parent market of Marketing and Advertising Services and the child market of Graphic Design Services. The total market size is predicted to reach xx Million by 2033.
Graphic Design Market Market Dynamics & Structure
The Graphic Design Market is characterized by moderate concentration, with several major players and a large number of smaller firms. Technological innovation, particularly in software and AI-powered design tools, is a key driver. Regulatory frameworks related to intellectual property and data privacy influence market operations. Competitive substitutes include DIY design tools and outsourcing to lower-cost regions. End-user demographics are diverse, encompassing businesses of all sizes, marketing agencies, and individual designers. M&A activity in the sector is moderately active, with consolidation expected to continue.
- Market Concentration: Moderately concentrated, with top 5 players holding approximately 30% market share in 2024.
- Technological Innovation: AI-driven design tools, VR/AR applications, and improved software are major drivers.
- Regulatory Frameworks: Copyright laws, data privacy regulations (GDPR, CCPA) impact operations.
- Competitive Substitutes: DIY design platforms (Canva), freelance marketplaces pose a threat.
- M&A Trends: Consolidation is expected, driven by economies of scale and technology integration. An estimated xx M&A deals occurred in the historical period (2019-2024).
Graphic Design Market Growth Trends & Insights
The Graphic Design Market experienced significant growth during the historical period (2019-2024), driven by the increasing demand for visually appealing marketing materials, brand identity development, and digital content. Adoption rates of specialized design software and services have also contributed to market expansion. Technological disruptions, such as the rise of AI-powered design tools, are transforming the industry landscape, creating both opportunities and challenges. Consumer behavior shifts toward digital platforms and personalized experiences are fueling the demand for customized graphic design solutions. The market is projected to maintain a healthy Compound Annual Growth Rate (CAGR) of xx% during the forecast period (2025-2033), reaching an estimated market size of xx Million by 2033. Market penetration in key segments is expected to increase steadily, driven by rising digitalization and increasing adoption of graphic design services across various industries.
Dominant Regions, Countries, or Segments in Graphic Design Market
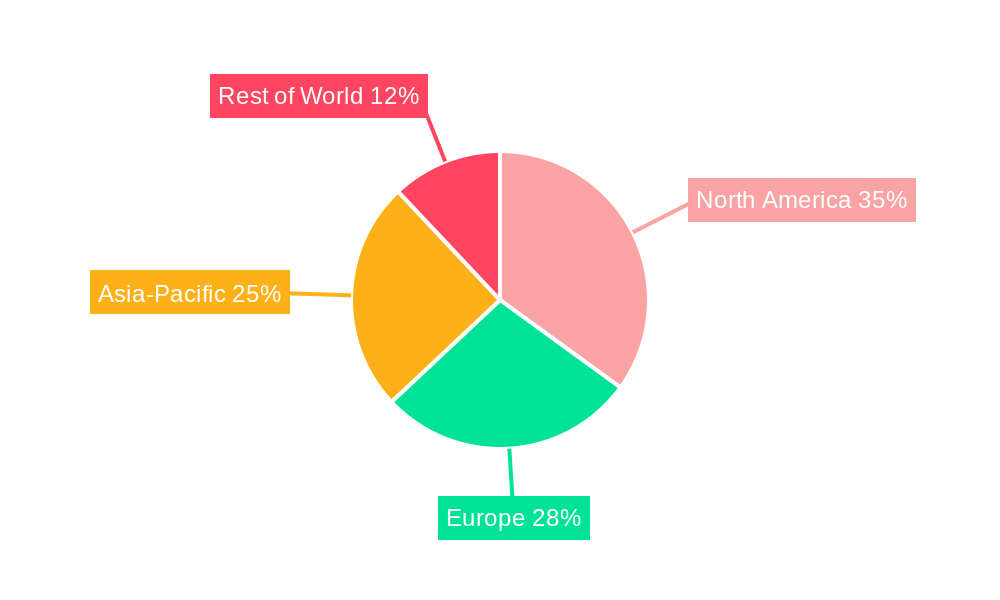
North America currently holds the largest market share in the Graphic Design Market, followed by Europe and Asia-Pacific. The dominance of North America is attributed to factors such as a strong economy, high technological advancement, and a large number of established design firms. Europe is a significant market due to its diverse creative industries and high demand for design services. Asia-Pacific shows strong growth potential, fueled by rapid economic development and rising digitalization.
- North America: High demand for design services, advanced technology adoption, strong economy.
- Europe: Mature market, diverse creative industries, high design literacy.
- Asia-Pacific: Rapid economic growth, increasing digitalization, substantial growth potential.
Graphic Design Market Product Landscape
The Graphic Design Market offers a wide range of services, including logo design, branding, web design, packaging design, illustration, and animation. Product innovations focus on enhanced software capabilities, AI-powered design tools, and integration with other marketing technologies. Key performance indicators include design quality, turnaround time, client satisfaction, and cost-effectiveness. Unique selling propositions often center around specialized expertise, creative innovation, and efficient project management.
Key Drivers, Barriers & Challenges in Graphic Design Market
Key Drivers:
- Rising demand for visually compelling marketing materials.
- Increasing adoption of digital marketing and social media.
- Growing need for brand building and identity creation.
- Technological advancements in design software and tools.
Key Challenges:
- Intense competition from freelance designers and online platforms.
- Price pressures from clients seeking cost-effective solutions.
- Maintaining design quality while meeting tight deadlines.
- Protecting intellectual property rights in a digital environment. Estimated revenue loss due to copyright infringement is xx Million annually.
Emerging Opportunities in Graphic Design Market
- AI-powered design tools: Integration of AI for automation and enhanced creativity.
- VR/AR experiences: Design for immersive and interactive user experiences.
- Sustainable design: Growing demand for eco-friendly design practices.
- Niche markets: Specialization in areas like UX/UI design, motion graphics.
Growth Accelerators in the Graphic Design Market Industry
Technological breakthroughs in AI and design software are major catalysts, along with strategic partnerships between design firms and marketing agencies. Expanding into new markets and offering specialized services also contributes significantly to growth.
Key Players Shaping the Graphic Design Market Market
- ArtVersion
- Max Media Group
- Bates Design Inc
- VerdanaBold
- Pentagram Inc
- ManyPixels Inc
- Huge LLC
- Duck Design Inc
- DesignCrowd Inc
- Design Pickle Inc
- List Not Exhaustive
Notable Milestones in Graphic Design Market Sector
- July 2024: Adobe announced major updates to Illustrator and Photoshop, boosting creative workflows.
- September 2024: PepsiCo's 7UP rebranding showcased minimalist aesthetics and impactful color palettes.
In-Depth Graphic Design Market Market Outlook
The Graphic Design Market is poised for continued growth, driven by technological advancements, evolving consumer preferences, and increasing demand for visually compelling content across various industries. Strategic partnerships, market expansion, and specialization in niche areas represent significant opportunities for players in this dynamic sector. The future market potential is substantial, with opportunities for both established players and emerging firms to capture significant market share.
Graphic Design Market Segmentation
-
1. Type
- 1.1. Logo & Brand Identity
- 1.2. App & Digital Design
- 1.3. Advertising
- 1.4. Clothing & Merchandise
- 1.5. Packaging & Label
- 1.6. Book& Magazine
- 1.7. Other Types
-
2. Platform
- 2.1. Online Design
- 2.2. Offline Design
-
3. End-users
- 3.1. SMEs
- 3.2. Large Enterprises
- 3.3. Government
Graphic Design Market Segmentation By Geography
- 1. North America
- 2. Europe
- 3. Asia
- 4. Australia and New Zealand
- 5. Latin America
- 6. Middle East and Africa
Graphic Design Market REPORT HIGHLIGHTS
| Aspects | Details |
|---|---|
| Study Period | 2019-2033 |
| Base Year | 2024 |
| Estimated Year | 2025 |
| Forecast Period | 2025-2033 |
| Historical Period | 2019-2024 |
| Growth Rate | CAGR of 5.89% from 2019-2033 |
| Segmentation |
|
Table of Contents
- 1. Introduction
- 1.1. Research Scope
- 1.2. Market Segmentation
- 1.3. Research Methodology
- 1.4. Definitions and Assumptions
- 2. Executive Summary
- 2.1. Introduction
- 3. Market Dynamics
- 3.1. Introduction
- 3.2. Market Drivers
- 3.2.1. Rising Demand for Digital Content; Expansion of Branding and Advertising Initiatives
- 3.3. Market Restrains
- 3.3.1. Rising Demand for Digital Content; Expansion of Branding and Advertising Initiatives
- 3.4. Market Trends
- 3.4.1. SMEs to Hold Significant Growth
- 4. Market Factor Analysis
- 4.1. Porters Five Forces
- 4.2. Supply/Value Chain
- 4.3. PESTEL analysis
- 4.4. Market Entropy
- 4.5. Patent/Trademark Analysis
- 5. Global Graphic Design Market Analysis, Insights and Forecast, 2019-2031
- 5.1. Market Analysis, Insights and Forecast - by Type
- 5.1.1. Logo & Brand Identity
- 5.1.2. App & Digital Design
- 5.1.3. Advertising
- 5.1.4. Clothing & Merchandise
- 5.1.5. Packaging & Label
- 5.1.6. Book& Magazine
- 5.1.7. Other Types
- 5.2. Market Analysis, Insights and Forecast - by Platform
- 5.2.1. Online Design
- 5.2.2. Offline Design
- 5.3. Market Analysis, Insights and Forecast - by End-users
- 5.3.1. SMEs
- 5.3.2. Large Enterprises
- 5.3.3. Government
- 5.4. Market Analysis, Insights and Forecast - by Region
- 5.4.1. North America
- 5.4.2. Europe
- 5.4.3. Asia
- 5.4.4. Australia and New Zealand
- 5.4.5. Latin America
- 5.4.6. Middle East and Africa
- 5.1. Market Analysis, Insights and Forecast - by Type
- 6. North America Graphic Design Market Analysis, Insights and Forecast, 2019-2031
- 6.1. Market Analysis, Insights and Forecast - by Type
- 6.1.1. Logo & Brand Identity
- 6.1.2. App & Digital Design
- 6.1.3. Advertising
- 6.1.4. Clothing & Merchandise
- 6.1.5. Packaging & Label
- 6.1.6. Book& Magazine
- 6.1.7. Other Types
- 6.2. Market Analysis, Insights and Forecast - by Platform
- 6.2.1. Online Design
- 6.2.2. Offline Design
- 6.3. Market Analysis, Insights and Forecast - by End-users
- 6.3.1. SMEs
- 6.3.2. Large Enterprises
- 6.3.3. Government
- 6.1. Market Analysis, Insights and Forecast - by Type
- 7. Europe Graphic Design Market Analysis, Insights and Forecast, 2019-2031
- 7.1. Market Analysis, Insights and Forecast - by Type
- 7.1.1. Logo & Brand Identity
- 7.1.2. App & Digital Design
- 7.1.3. Advertising
- 7.1.4. Clothing & Merchandise
- 7.1.5. Packaging & Label
- 7.1.6. Book& Magazine
- 7.1.7. Other Types
- 7.2. Market Analysis, Insights and Forecast - by Platform
- 7.2.1. Online Design
- 7.2.2. Offline Design
- 7.3. Market Analysis, Insights and Forecast - by End-users
- 7.3.1. SMEs
- 7.3.2. Large Enterprises
- 7.3.3. Government
- 7.1. Market Analysis, Insights and Forecast - by Type
- 8. Asia Graphic Design Market Analysis, Insights and Forecast, 2019-2031
- 8.1. Market Analysis, Insights and Forecast - by Type
- 8.1.1. Logo & Brand Identity
- 8.1.2. App & Digital Design
- 8.1.3. Advertising
- 8.1.4. Clothing & Merchandise
- 8.1.5. Packaging & Label
- 8.1.6. Book& Magazine
- 8.1.7. Other Types
- 8.2. Market Analysis, Insights and Forecast - by Platform
- 8.2.1. Online Design
- 8.2.2. Offline Design
- 8.3. Market Analysis, Insights and Forecast - by End-users
- 8.3.1. SMEs
- 8.3.2. Large Enterprises
- 8.3.3. Government
- 8.1. Market Analysis, Insights and Forecast - by Type
- 9. Australia and New Zealand Graphic Design Market Analysis, Insights and Forecast, 2019-2031
- 9.1. Market Analysis, Insights and Forecast - by Type
- 9.1.1. Logo & Brand Identity
- 9.1.2. App & Digital Design
- 9.1.3. Advertising
- 9.1.4. Clothing & Merchandise
- 9.1.5. Packaging & Label
- 9.1.6. Book& Magazine
- 9.1.7. Other Types
- 9.2. Market Analysis, Insights and Forecast - by Platform
- 9.2.1. Online Design
- 9.2.2. Offline Design
- 9.3. Market Analysis, Insights and Forecast - by End-users
- 9.3.1. SMEs
- 9.3.2. Large Enterprises
- 9.3.3. Government
- 9.1. Market Analysis, Insights and Forecast - by Type
- 10. Latin America Graphic Design Market Analysis, Insights and Forecast, 2019-2031
- 10.1. Market Analysis, Insights and Forecast - by Type
- 10.1.1. Logo & Brand Identity
- 10.1.2. App & Digital Design
- 10.1.3. Advertising
- 10.1.4. Clothing & Merchandise
- 10.1.5. Packaging & Label
- 10.1.6. Book& Magazine
- 10.1.7. Other Types
- 10.2. Market Analysis, Insights and Forecast - by Platform
- 10.2.1. Online Design
- 10.2.2. Offline Design
- 10.3. Market Analysis, Insights and Forecast - by End-users
- 10.3.1. SMEs
- 10.3.2. Large Enterprises
- 10.3.3. Government
- 10.1. Market Analysis, Insights and Forecast - by Type
- 11. Middle East and Africa Graphic Design Market Analysis, Insights and Forecast, 2019-2031
- 11.1. Market Analysis, Insights and Forecast - by Type
- 11.1.1. Logo & Brand Identity
- 11.1.2. App & Digital Design
- 11.1.3. Advertising
- 11.1.4. Clothing & Merchandise
- 11.1.5. Packaging & Label
- 11.1.6. Book& Magazine
- 11.1.7. Other Types
- 11.2. Market Analysis, Insights and Forecast - by Platform
- 11.2.1. Online Design
- 11.2.2. Offline Design
- 11.3. Market Analysis, Insights and Forecast - by End-users
- 11.3.1. SMEs
- 11.3.2. Large Enterprises
- 11.3.3. Government
- 11.1. Market Analysis, Insights and Forecast - by Type
- 12. Competitive Analysis
- 12.1. Global Market Share Analysis 2024
- 12.2. Company Profiles
- 12.2.1 ArtVersion
- 12.2.1.1. Overview
- 12.2.1.2. Products
- 12.2.1.3. SWOT Analysis
- 12.2.1.4. Recent Developments
- 12.2.1.5. Financials (Based on Availability)
- 12.2.2 Max Media Group
- 12.2.2.1. Overview
- 12.2.2.2. Products
- 12.2.2.3. SWOT Analysis
- 12.2.2.4. Recent Developments
- 12.2.2.5. Financials (Based on Availability)
- 12.2.3 Bates Design Inc
- 12.2.3.1. Overview
- 12.2.3.2. Products
- 12.2.3.3. SWOT Analysis
- 12.2.3.4. Recent Developments
- 12.2.3.5. Financials (Based on Availability)
- 12.2.4 VerdanaBold
- 12.2.4.1. Overview
- 12.2.4.2. Products
- 12.2.4.3. SWOT Analysis
- 12.2.4.4. Recent Developments
- 12.2.4.5. Financials (Based on Availability)
- 12.2.5 Pentagram Inc
- 12.2.5.1. Overview
- 12.2.5.2. Products
- 12.2.5.3. SWOT Analysis
- 12.2.5.4. Recent Developments
- 12.2.5.5. Financials (Based on Availability)
- 12.2.6 ManyPixels Inc
- 12.2.6.1. Overview
- 12.2.6.2. Products
- 12.2.6.3. SWOT Analysis
- 12.2.6.4. Recent Developments
- 12.2.6.5. Financials (Based on Availability)
- 12.2.7 Huge LLC
- 12.2.7.1. Overview
- 12.2.7.2. Products
- 12.2.7.3. SWOT Analysis
- 12.2.7.4. Recent Developments
- 12.2.7.5. Financials (Based on Availability)
- 12.2.8 Duck Design Inc
- 12.2.8.1. Overview
- 12.2.8.2. Products
- 12.2.8.3. SWOT Analysis
- 12.2.8.4. Recent Developments
- 12.2.8.5. Financials (Based on Availability)
- 12.2.9 DesignCrowd Inc
- 12.2.9.1. Overview
- 12.2.9.2. Products
- 12.2.9.3. SWOT Analysis
- 12.2.9.4. Recent Developments
- 12.2.9.5. Financials (Based on Availability)
- 12.2.10 Design Pickle Inc *List Not Exhaustive
- 12.2.10.1. Overview
- 12.2.10.2. Products
- 12.2.10.3. SWOT Analysis
- 12.2.10.4. Recent Developments
- 12.2.10.5. Financials (Based on Availability)
- 12.2.1 ArtVersion
List of Figures
- Figure 1: Global Graphic Design Market Revenue Breakdown (Million, %) by Region 2024 & 2032
- Figure 2: Global Graphic Design Market Volume Breakdown (Billion, %) by Region 2024 & 2032
- Figure 3: North America Graphic Design Market Revenue (Million), by Type 2024 & 2032
- Figure 4: North America Graphic Design Market Volume (Billion), by Type 2024 & 2032
- Figure 5: North America Graphic Design Market Revenue Share (%), by Type 2024 & 2032
- Figure 6: North America Graphic Design Market Volume Share (%), by Type 2024 & 2032
- Figure 7: North America Graphic Design Market Revenue (Million), by Platform 2024 & 2032
- Figure 8: North America Graphic Design Market Volume (Billion), by Platform 2024 & 2032
- Figure 9: North America Graphic Design Market Revenue Share (%), by Platform 2024 & 2032
- Figure 10: North America Graphic Design Market Volume Share (%), by Platform 2024 & 2032
- Figure 11: North America Graphic Design Market Revenue (Million), by End-users 2024 & 2032
- Figure 12: North America Graphic Design Market Volume (Billion), by End-users 2024 & 2032
- Figure 13: North America Graphic Design Market Revenue Share (%), by End-users 2024 & 2032
- Figure 14: North America Graphic Design Market Volume Share (%), by End-users 2024 & 2032
- Figure 15: North America Graphic Design Market Revenue (Million), by Country 2024 & 2032
- Figure 16: North America Graphic Design Market Volume (Billion), by Country 2024 & 2032
- Figure 17: North America Graphic Design Market Revenue Share (%), by Country 2024 & 2032
- Figure 18: North America Graphic Design Market Volume Share (%), by Country 2024 & 2032
- Figure 19: Europe Graphic Design Market Revenue (Million), by Type 2024 & 2032
- Figure 20: Europe Graphic Design Market Volume (Billion), by Type 2024 & 2032
- Figure 21: Europe Graphic Design Market Revenue Share (%), by Type 2024 & 2032
- Figure 22: Europe Graphic Design Market Volume Share (%), by Type 2024 & 2032
- Figure 23: Europe Graphic Design Market Revenue (Million), by Platform 2024 & 2032
- Figure 24: Europe Graphic Design Market Volume (Billion), by Platform 2024 & 2032
- Figure 25: Europe Graphic Design Market Revenue Share (%), by Platform 2024 & 2032
- Figure 26: Europe Graphic Design Market Volume Share (%), by Platform 2024 & 2032
- Figure 27: Europe Graphic Design Market Revenue (Million), by End-users 2024 & 2032
- Figure 28: Europe Graphic Design Market Volume (Billion), by End-users 2024 & 2032
- Figure 29: Europe Graphic Design Market Revenue Share (%), by End-users 2024 & 2032
- Figure 30: Europe Graphic Design Market Volume Share (%), by End-users 2024 & 2032
- Figure 31: Europe Graphic Design Market Revenue (Million), by Country 2024 & 2032
- Figure 32: Europe Graphic Design Market Volume (Billion), by Country 2024 & 2032
- Figure 33: Europe Graphic Design Market Revenue Share (%), by Country 2024 & 2032
- Figure 34: Europe Graphic Design Market Volume Share (%), by Country 2024 & 2032
- Figure 35: Asia Graphic Design Market Revenue (Million), by Type 2024 & 2032
- Figure 36: Asia Graphic Design Market Volume (Billion), by Type 2024 & 2032
- Figure 37: Asia Graphic Design Market Revenue Share (%), by Type 2024 & 2032
- Figure 38: Asia Graphic Design Market Volume Share (%), by Type 2024 & 2032
- Figure 39: Asia Graphic Design Market Revenue (Million), by Platform 2024 & 2032
- Figure 40: Asia Graphic Design Market Volume (Billion), by Platform 2024 & 2032
- Figure 41: Asia Graphic Design Market Revenue Share (%), by Platform 2024 & 2032
- Figure 42: Asia Graphic Design Market Volume Share (%), by Platform 2024 & 2032
- Figure 43: Asia Graphic Design Market Revenue (Million), by End-users 2024 & 2032
- Figure 44: Asia Graphic Design Market Volume (Billion), by End-users 2024 & 2032
- Figure 45: Asia Graphic Design Market Revenue Share (%), by End-users 2024 & 2032
- Figure 46: Asia Graphic Design Market Volume Share (%), by End-users 2024 & 2032
- Figure 47: Asia Graphic Design Market Revenue (Million), by Country 2024 & 2032
- Figure 48: Asia Graphic Design Market Volume (Billion), by Country 2024 & 2032
- Figure 49: Asia Graphic Design Market Revenue Share (%), by Country 2024 & 2032
- Figure 50: Asia Graphic Design Market Volume Share (%), by Country 2024 & 2032
- Figure 51: Australia and New Zealand Graphic Design Market Revenue (Million), by Type 2024 & 2032
- Figure 52: Australia and New Zealand Graphic Design Market Volume (Billion), by Type 2024 & 2032
- Figure 53: Australia and New Zealand Graphic Design Market Revenue Share (%), by Type 2024 & 2032
- Figure 54: Australia and New Zealand Graphic Design Market Volume Share (%), by Type 2024 & 2032
- Figure 55: Australia and New Zealand Graphic Design Market Revenue (Million), by Platform 2024 & 2032
- Figure 56: Australia and New Zealand Graphic Design Market Volume (Billion), by Platform 2024 & 2032
- Figure 57: Australia and New Zealand Graphic Design Market Revenue Share (%), by Platform 2024 & 2032
- Figure 58: Australia and New Zealand Graphic Design Market Volume Share (%), by Platform 2024 & 2032
- Figure 59: Australia and New Zealand Graphic Design Market Revenue (Million), by End-users 2024 & 2032
- Figure 60: Australia and New Zealand Graphic Design Market Volume (Billion), by End-users 2024 & 2032
- Figure 61: Australia and New Zealand Graphic Design Market Revenue Share (%), by End-users 2024 & 2032
- Figure 62: Australia and New Zealand Graphic Design Market Volume Share (%), by End-users 2024 & 2032
- Figure 63: Australia and New Zealand Graphic Design Market Revenue (Million), by Country 2024 & 2032
- Figure 64: Australia and New Zealand Graphic Design Market Volume (Billion), by Country 2024 & 2032
- Figure 65: Australia and New Zealand Graphic Design Market Revenue Share (%), by Country 2024 & 2032
- Figure 66: Australia and New Zealand Graphic Design Market Volume Share (%), by Country 2024 & 2032
- Figure 67: Latin America Graphic Design Market Revenue (Million), by Type 2024 & 2032
- Figure 68: Latin America Graphic Design Market Volume (Billion), by Type 2024 & 2032
- Figure 69: Latin America Graphic Design Market Revenue Share (%), by Type 2024 & 2032
- Figure 70: Latin America Graphic Design Market Volume Share (%), by Type 2024 & 2032
- Figure 71: Latin America Graphic Design Market Revenue (Million), by Platform 2024 & 2032
- Figure 72: Latin America Graphic Design Market Volume (Billion), by Platform 2024 & 2032
- Figure 73: Latin America Graphic Design Market Revenue Share (%), by Platform 2024 & 2032
- Figure 74: Latin America Graphic Design Market Volume Share (%), by Platform 2024 & 2032
- Figure 75: Latin America Graphic Design Market Revenue (Million), by End-users 2024 & 2032
- Figure 76: Latin America Graphic Design Market Volume (Billion), by End-users 2024 & 2032
- Figure 77: Latin America Graphic Design Market Revenue Share (%), by End-users 2024 & 2032
- Figure 78: Latin America Graphic Design Market Volume Share (%), by End-users 2024 & 2032
- Figure 79: Latin America Graphic Design Market Revenue (Million), by Country 2024 & 2032
- Figure 80: Latin America Graphic Design Market Volume (Billion), by Country 2024 & 2032
- Figure 81: Latin America Graphic Design Market Revenue Share (%), by Country 2024 & 2032
- Figure 82: Latin America Graphic Design Market Volume Share (%), by Country 2024 & 2032
- Figure 83: Middle East and Africa Graphic Design Market Revenue (Million), by Type 2024 & 2032
- Figure 84: Middle East and Africa Graphic Design Market Volume (Billion), by Type 2024 & 2032
- Figure 85: Middle East and Africa Graphic Design Market Revenue Share (%), by Type 2024 & 2032
- Figure 86: Middle East and Africa Graphic Design Market Volume Share (%), by Type 2024 & 2032
- Figure 87: Middle East and Africa Graphic Design Market Revenue (Million), by Platform 2024 & 2032
- Figure 88: Middle East and Africa Graphic Design Market Volume (Billion), by Platform 2024 & 2032
- Figure 89: Middle East and Africa Graphic Design Market Revenue Share (%), by Platform 2024 & 2032
- Figure 90: Middle East and Africa Graphic Design Market Volume Share (%), by Platform 2024 & 2032
- Figure 91: Middle East and Africa Graphic Design Market Revenue (Million), by End-users 2024 & 2032
- Figure 92: Middle East and Africa Graphic Design Market Volume (Billion), by End-users 2024 & 2032
- Figure 93: Middle East and Africa Graphic Design Market Revenue Share (%), by End-users 2024 & 2032
- Figure 94: Middle East and Africa Graphic Design Market Volume Share (%), by End-users 2024 & 2032
- Figure 95: Middle East and Africa Graphic Design Market Revenue (Million), by Country 2024 & 2032
- Figure 96: Middle East and Africa Graphic Design Market Volume (Billion), by Country 2024 & 2032
- Figure 97: Middle East and Africa Graphic Design Market Revenue Share (%), by Country 2024 & 2032
- Figure 98: Middle East and Africa Graphic Design Market Volume Share (%), by Country 2024 & 2032
List of Tables
- Table 1: Global Graphic Design Market Revenue Million Forecast, by Region 2019 & 2032
- Table 2: Global Graphic Design Market Volume Billion Forecast, by Region 2019 & 2032
- Table 3: Global Graphic Design Market Revenue Million Forecast, by Type 2019 & 2032
- Table 4: Global Graphic Design Market Volume Billion Forecast, by Type 2019 & 2032
- Table 5: Global Graphic Design Market Revenue Million Forecast, by Platform 2019 & 2032
- Table 6: Global Graphic Design Market Volume Billion Forecast, by Platform 2019 & 2032
- Table 7: Global Graphic Design Market Revenue Million Forecast, by End-users 2019 & 2032
- Table 8: Global Graphic Design Market Volume Billion Forecast, by End-users 2019 & 2032
- Table 9: Global Graphic Design Market Revenue Million Forecast, by Region 2019 & 2032
- Table 10: Global Graphic Design Market Volume Billion Forecast, by Region 2019 & 2032
- Table 11: Global Graphic Design Market Revenue Million Forecast, by Type 2019 & 2032
- Table 12: Global Graphic Design Market Volume Billion Forecast, by Type 2019 & 2032
- Table 13: Global Graphic Design Market Revenue Million Forecast, by Platform 2019 & 2032
- Table 14: Global Graphic Design Market Volume Billion Forecast, by Platform 2019 & 2032
- Table 15: Global Graphic Design Market Revenue Million Forecast, by End-users 2019 & 2032
- Table 16: Global Graphic Design Market Volume Billion Forecast, by End-users 2019 & 2032
- Table 17: Global Graphic Design Market Revenue Million Forecast, by Country 2019 & 2032
- Table 18: Global Graphic Design Market Volume Billion Forecast, by Country 2019 & 2032
- Table 19: Global Graphic Design Market Revenue Million Forecast, by Type 2019 & 2032
- Table 20: Global Graphic Design Market Volume Billion Forecast, by Type 2019 & 2032
- Table 21: Global Graphic Design Market Revenue Million Forecast, by Platform 2019 & 2032
- Table 22: Global Graphic Design Market Volume Billion Forecast, by Platform 2019 & 2032
- Table 23: Global Graphic Design Market Revenue Million Forecast, by End-users 2019 & 2032
- Table 24: Global Graphic Design Market Volume Billion Forecast, by End-users 2019 & 2032
- Table 25: Global Graphic Design Market Revenue Million Forecast, by Country 2019 & 2032
- Table 26: Global Graphic Design Market Volume Billion Forecast, by Country 2019 & 2032
- Table 27: Global Graphic Design Market Revenue Million Forecast, by Type 2019 & 2032
- Table 28: Global Graphic Design Market Volume Billion Forecast, by Type 2019 & 2032
- Table 29: Global Graphic Design Market Revenue Million Forecast, by Platform 2019 & 2032
- Table 30: Global Graphic Design Market Volume Billion Forecast, by Platform 2019 & 2032
- Table 31: Global Graphic Design Market Revenue Million Forecast, by End-users 2019 & 2032
- Table 32: Global Graphic Design Market Volume Billion Forecast, by End-users 2019 & 2032
- Table 33: Global Graphic Design Market Revenue Million Forecast, by Country 2019 & 2032
- Table 34: Global Graphic Design Market Volume Billion Forecast, by Country 2019 & 2032
- Table 35: Global Graphic Design Market Revenue Million Forecast, by Type 2019 & 2032
- Table 36: Global Graphic Design Market Volume Billion Forecast, by Type 2019 & 2032
- Table 37: Global Graphic Design Market Revenue Million Forecast, by Platform 2019 & 2032
- Table 38: Global Graphic Design Market Volume Billion Forecast, by Platform 2019 & 2032
- Table 39: Global Graphic Design Market Revenue Million Forecast, by End-users 2019 & 2032
- Table 40: Global Graphic Design Market Volume Billion Forecast, by End-users 2019 & 2032
- Table 41: Global Graphic Design Market Revenue Million Forecast, by Country 2019 & 2032
- Table 42: Global Graphic Design Market Volume Billion Forecast, by Country 2019 & 2032
- Table 43: Global Graphic Design Market Revenue Million Forecast, by Type 2019 & 2032
- Table 44: Global Graphic Design Market Volume Billion Forecast, by Type 2019 & 2032
- Table 45: Global Graphic Design Market Revenue Million Forecast, by Platform 2019 & 2032
- Table 46: Global Graphic Design Market Volume Billion Forecast, by Platform 2019 & 2032
- Table 47: Global Graphic Design Market Revenue Million Forecast, by End-users 2019 & 2032
- Table 48: Global Graphic Design Market Volume Billion Forecast, by End-users 2019 & 2032
- Table 49: Global Graphic Design Market Revenue Million Forecast, by Country 2019 & 2032
- Table 50: Global Graphic Design Market Volume Billion Forecast, by Country 2019 & 2032
- Table 51: Global Graphic Design Market Revenue Million Forecast, by Type 2019 & 2032
- Table 52: Global Graphic Design Market Volume Billion Forecast, by Type 2019 & 2032
- Table 53: Global Graphic Design Market Revenue Million Forecast, by Platform 2019 & 2032
- Table 54: Global Graphic Design Market Volume Billion Forecast, by Platform 2019 & 2032
- Table 55: Global Graphic Design Market Revenue Million Forecast, by End-users 2019 & 2032
- Table 56: Global Graphic Design Market Volume Billion Forecast, by End-users 2019 & 2032
- Table 57: Global Graphic Design Market Revenue Million Forecast, by Country 2019 & 2032
- Table 58: Global Graphic Design Market Volume Billion Forecast, by Country 2019 & 2032
Frequently Asked Questions
1. What is the projected Compound Annual Growth Rate (CAGR) of the Graphic Design Market?
The projected CAGR is approximately 5.89%.
2. Which companies are prominent players in the Graphic Design Market?
Key companies in the market include ArtVersion, Max Media Group, Bates Design Inc, VerdanaBold, Pentagram Inc, ManyPixels Inc, Huge LLC, Duck Design Inc, DesignCrowd Inc, Design Pickle Inc *List Not Exhaustive.
3. What are the main segments of the Graphic Design Market?
The market segments include Type, Platform, End-users.
4. Can you provide details about the market size?
The market size is estimated to be USD 54.35 Million as of 2022.
5. What are some drivers contributing to market growth?
Rising Demand for Digital Content; Expansion of Branding and Advertising Initiatives.
6. What are the notable trends driving market growth?
SMEs to Hold Significant Growth.
7. Are there any restraints impacting market growth?
Rising Demand for Digital Content; Expansion of Branding and Advertising Initiatives.
8. Can you provide examples of recent developments in the market?
July 2024: Adobe announced breakthrough innovations in its industry leading professional design apps Adobe Illustrator and Adobe Photoshop that accelerate everyday creative workflows and give creators more control. From ideation to production, the new release of Illustrator unlocks new ways for pro designers and illustrators to more easily and quickly bring their vision to life across brand graphics, logos and icons, product packaging, marketing deliverables, pattern creation and beyond.September 2024: PepsiCo introduced a new visual design for 7UP as part of this global refresh with bright colors and minimalistic aesthetics. The restaged 7UP VIS represents a frame of mind and style that encompasses all that is refreshing, distinctive, and modern.
9. What pricing options are available for accessing the report?
Pricing options include single-user, multi-user, and enterprise licenses priced at USD 4750, USD 5250, and USD 8750 respectively.
10. Is the market size provided in terms of value or volume?
The market size is provided in terms of value, measured in Million and volume, measured in Billion.
11. Are there any specific market keywords associated with the report?
Yes, the market keyword associated with the report is "Graphic Design Market," which aids in identifying and referencing the specific market segment covered.
12. How do I determine which pricing option suits my needs best?
The pricing options vary based on user requirements and access needs. Individual users may opt for single-user licenses, while businesses requiring broader access may choose multi-user or enterprise licenses for cost-effective access to the report.
13. Are there any additional resources or data provided in the Graphic Design Market report?
While the report offers comprehensive insights, it's advisable to review the specific contents or supplementary materials provided to ascertain if additional resources or data are available.
14. How can I stay updated on further developments or reports in the Graphic Design Market?
To stay informed about further developments, trends, and reports in the Graphic Design Market, consider subscribing to industry newsletters, following relevant companies and organizations, or regularly checking reputable industry news sources and publications.
Methodology
Step 1 - Identification of Relevant Samples Size from Population Database


Step 2 - Approaches for Defining Global Market Size (Value, Volume* & Price*)

Note*: In applicable scenarios
Step 3 - Data Sources
Primary Research
- Web Analytics
- Survey Reports
- Research Institute
- Latest Research Reports
- Opinion Leaders
Secondary Research
- Annual Reports
- White Paper
- Latest Press Release
- Industry Association
- Paid Database
- Investor Presentations

Step 4 - Data Triangulation
Involves using different sources of information in order to increase the validity of a study
These sources are likely to be stakeholders in a program - participants, other researchers, program staff, other community members, and so on.
Then we put all data in single framework & apply various statistical tools to find out the dynamic on the market.
During the analysis stage, feedback from the stakeholder groups would be compared to determine areas of agreement as well as areas of divergence


