
Key Insights
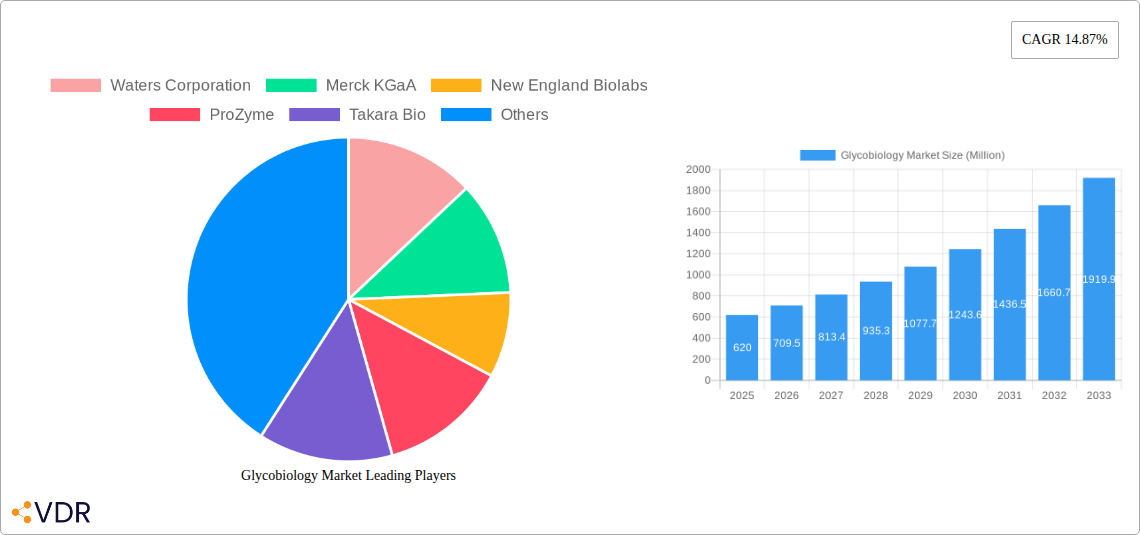
The global glycobiology market, valued at $0.62 billion in 2025, is poised for robust growth, exhibiting a Compound Annual Growth Rate (CAGR) of 14.87% from 2025 to 2033. This expansion is fueled by several key drivers. The increasing prevalence of chronic diseases like cancer and autoimmune disorders necessitates advanced diagnostic tools and therapeutic interventions, significantly boosting demand for glycobiology-related products and services. Furthermore, the burgeoning field of personalized medicine, relying heavily on understanding glycan structures and their roles in disease, is a major catalyst for market growth. Technological advancements in areas like mass spectrometry and glycomics analysis are providing researchers with sophisticated tools for investigating complex glycosylation patterns, further fueling market expansion. The strong research and development activities within pharmaceutical and biotechnology companies, coupled with increasing collaborations between academia and industry, are accelerating the translation of glycobiology research into commercial applications.
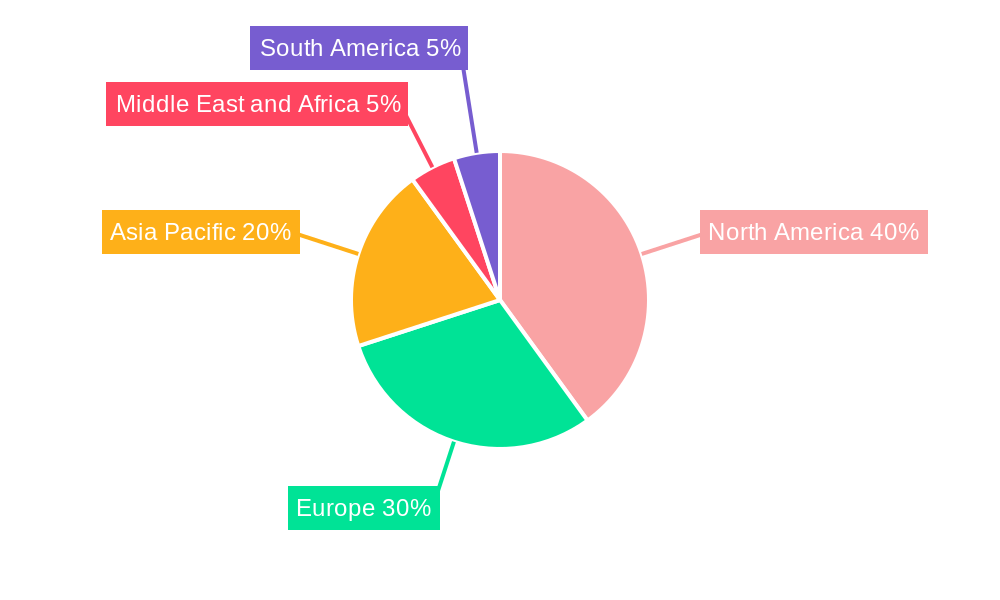
Market segmentation reveals a diverse landscape. Enzymes, instruments, kits, and reagents are the primary product categories, with diagnostic applications currently dominating market share. However, significant growth is anticipated in drug discovery and development, oncology, and immunology applications, driven by the discovery of novel glyco-biomarkers and the development of targeted glyco-therapeutics. Pharmaceutical and biotechnology companies represent the largest end-user segment, followed by contract research organizations (CROs). Geographically, North America currently holds a substantial market share due to the presence of leading research institutions and pharmaceutical companies, however, the Asia-Pacific region is expected to experience rapid growth in the coming years due to its expanding healthcare infrastructure and increasing investment in biotechnology research. The market faces some restraints, including the high cost of sophisticated analytical techniques and the complexity of glycobiology research, but these are largely offset by the significant potential for improved disease diagnostics and treatment.
Glycobiology Market: A Comprehensive Report (2019-2033)
This comprehensive report provides an in-depth analysis of the Glycobiology market, encompassing market dynamics, growth trends, regional segmentation, product landscape, key players, and future outlook. The study period covers 2019-2033, with 2025 as the base and estimated year. This report is invaluable for industry professionals, investors, and researchers seeking a clear understanding of this rapidly evolving market, valued at xx Million in 2025 and projected to reach xx Million by 2033.
Glycobiology Market Dynamics & Structure
The global Glycobiology market is characterized by moderate concentration, with several key players holding significant market share. Technological innovation, particularly in mass spectrometry and high-throughput screening, is a major driver. Stringent regulatory frameworks governing the development and approval of glycobiology-based products influence market growth. The market also faces competition from alternative technologies, though the unique capabilities of glycobiology-based approaches sustain demand. End-user demographics are skewed towards research-intensive sectors, with pharmaceutical and biotechnology companies being the primary consumers. M&A activity in the sector remains moderate, with approximately xx deals recorded between 2019 and 2024, leading to a consolidation trend among smaller players.
- Market Concentration: Moderately concentrated, with top 5 players holding xx% market share in 2025.
- Technological Innovation: Mass spectrometry, high-throughput screening, and advanced analytical techniques are key drivers.
- Regulatory Framework: Stringent regulatory pathways for new glycobiology-based therapeutics and diagnostics.
- Competitive Substitutes: Limited direct substitutes, but alternative analytical techniques compete for research funding.
- End-User Demographics: Primarily pharmaceutical and biotechnology companies, followed by CROs.
- M&A Activity: Approximately xx M&A deals between 2019 and 2024, indicating a consolidation trend.
Glycobiology Market Growth Trends & Insights
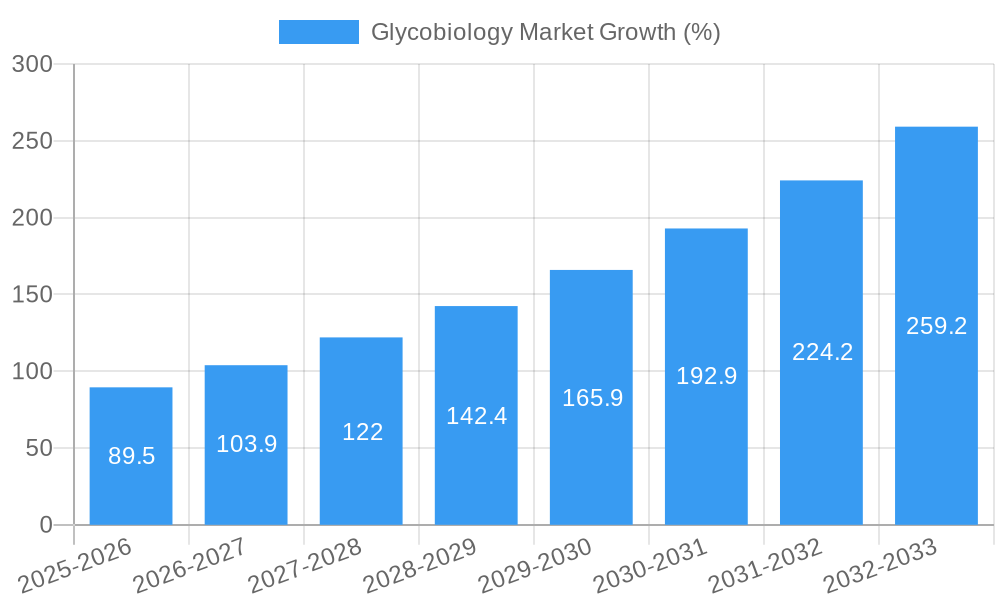
The Glycobiology market exhibits robust growth, driven by increasing demand for advanced diagnostics, personalized medicine, and novel therapeutics. The market size has experienced a CAGR of xx% during the historical period (2019-2024) and is projected to maintain a CAGR of xx% during the forecast period (2025-2033). This growth is fueled by technological advancements in glyco-analysis, improved understanding of the role of glycans in disease pathogenesis, and rising investments in research and development across the pharmaceutical and biotechnology industry. The adoption rate of glycobiology-based technologies is increasing, particularly in drug discovery and development. Shifts in consumer behavior, such as increased awareness of personalized medicine, further enhance market growth.
(Note: This section requires data to fill in the CAGR and other metrics - XXX in the prompt is unclear and needs replacement with actual data)
Dominant Regions, Countries, or Segments in Glycobiology Market
North America currently holds the largest market share, driven by robust research infrastructure, high investments in healthcare, and a strong presence of key players. Within the product segment, instruments contribute significantly to the overall revenue. Drug discovery and development are the dominant application segment. Pharmaceutical and biotechnology companies represent the largest end-user segment. Europe is another significant market, while Asia Pacific is expected to witness high growth in the forecast period, driven by rising healthcare expenditure and growing awareness of glycobiology.
- Leading Region: North America
- Key Drivers (North America): Strong research infrastructure, high healthcare spending, presence of major players.
- High-Growth Region: Asia Pacific
- Key Drivers (Asia Pacific): Rising healthcare expenditure, increasing awareness of glycobiology.
- Dominant Product Segment: Instruments
- Dominant Application Segment: Drug Discovery and Development
- Dominant End-User Segment: Pharmaceutical and Biotechnology Companies
Glycobiology Market Product Landscape
The Glycobiology market offers a diverse range of products, including enzymes, instruments (such as mass spectrometers and microarrays), kits, and reagents. Recent innovations focus on improving the sensitivity and specificity of glycan analysis, enabling higher throughput and automation. These advancements have resulted in improved performance metrics, such as faster analysis times and reduced cost per sample. Unique selling propositions often involve improved sensitivity, specificity, automation capabilities, and ease of use. Technological advancements primarily focus on mass spectrometry-based techniques and microfluidic platforms.
Key Drivers, Barriers & Challenges in Glycobiology Market
Key Drivers:
The increasing understanding of the role of glycans in various diseases, coupled with the advancement in analytical technologies, are major drivers. Government funding for research in glycobiology and growing investments from pharmaceutical companies contribute significantly.
Key Challenges:
Complexity of glycan structures and high costs associated with analysis are significant barriers. Regulatory hurdles for new glycobiology-based therapeutics and diagnostics further slow down market penetration. Competition from alternative analytical technologies and the specialized skill set needed also limits growth. Supply chain disruptions in certain reagents can also negatively impact product availability and market growth. For example, difficulties in obtaining specific enzymes might delay project timelines. This could be quantified in terms of xx% project delays in [year].
Emerging Opportunities in Glycobiology Market
Untapped markets exist in personalized medicine, diagnostics, and therapeutic applications. The development of novel glycan-based therapeutics for various diseases holds significant promise. Evolving consumer preferences towards personalized healthcare and improved diagnostic technologies further enhance market potential. Emerging applications in areas like immunotherapy and regenerative medicine offer significant opportunities.
Growth Accelerators in the Glycobiology Market Industry
Technological breakthroughs in mass spectrometry, development of new analytical tools, and high-throughput screening methods are catalysts for long-term growth. Strategic partnerships between academic institutions, research organizations, and pharmaceutical companies accelerate innovation and market penetration. Market expansion into emerging economies with increasing healthcare budgets further strengthens the growth trajectory.
Key Players Shaping the Glycobiology Market Market
- Waters Corporation
- Merck KGaA
- New England Biolabs
- ProZyme
- Takara Bio
- Danaher Corporation
- Thermo Fisher Scientific
- Bruker Corporation
- Agilent Technologies
- Shimadzu Corporation
Notable Milestones in Glycobiology Market Sector
- June 2022: Thermo Fisher Scientific announced a co-marketing agreement with TransMIT GmbH to promote mass spectrometry imaging (MSI) for spatial multi-omics applications. This expanded the reach of MSI technology in the pharmaceutical and clinical lab settings, boosting market adoption.
- April 2022: Bruker launched a MALDI HiPLEX-IHC tissue imaging solution, expanding the capabilities of timsTOF flex for integrated multi-omics analysis, enhancing the platform's attractiveness for researchers.
In-Depth Glycobiology Market Market Outlook
The Glycobiology market is poised for continued robust growth, driven by advancements in analytical technologies, expanding applications, and rising investments in research and development. Strategic partnerships and collaborations will play a critical role in accelerating innovation and market penetration. The focus on personalized medicine and the increasing demand for improved diagnostic tools will further stimulate market growth. The future holds immense potential for glycobiology-based therapeutics and diagnostics, making it an attractive sector for investment and innovation.
Glycobiology Market Segmentation
-
1. Product
- 1.1. Enzymes
- 1.2. Instruments
- 1.3. Kits and Reagents
-
2. Application
- 2.1. Diagnostics
- 2.2. Drug Discovery and Development
- 2.3. Oncology
- 2.4. Immunology
- 2.5. Other Applications
-
3. End User
- 3.1. Pharmaceutical and Biotechnology Companies
- 3.2. Contract Research Organizations
- 3.3. Other End Users
Glycobiology Market Segmentation By Geography
-
1. North America
- 1.1. United States
- 1.2. Canada
- 1.3. Mexico
-
2. Europe
- 2.1. Germany
- 2.2. United Kingdom
- 2.3. France
- 2.4. Italy
- 2.5. Spain
- 2.6. Rest of Europe
-
3. Asia Pacific
- 3.1. China
- 3.2. Japan
- 3.3. India
- 3.4. Australia
- 3.5. South Korea
- 3.6. Rest of Asia Pacific
-
4. Middle East and Africa
- 4.1. GCC
- 4.2. South Africa
- 4.3. Rest of Middle East and Africa
-
5. South America
- 5.1. Brazil
- 5.2. Argentina
- 5.3. Rest of South America
Glycobiology Market REPORT HIGHLIGHTS
| Aspects | Details |
|---|---|
| Study Period | 2019-2033 |
| Base Year | 2024 |
| Estimated Year | 2025 |
| Forecast Period | 2025-2033 |
| Historical Period | 2019-2024 |
| Growth Rate | CAGR of 14.87% from 2019-2033 |
| Segmentation |
|
Table of Contents
- 1. Introduction
- 1.1. Research Scope
- 1.2. Market Segmentation
- 1.3. Research Methodology
- 1.4. Definitions and Assumptions
- 2. Executive Summary
- 2.1. Introduction
- 3. Market Dynamics
- 3.1. Introduction
- 3.2. Market Drivers
- 3.2.1. Increasing Government and Private Funding for Glycomics and Proteomics Research; Growing R&D Expenditures by Pharmaceutical and Biotechnology Companies
- 3.3. Market Restrains
- 3.3.1. High Product Cost; Low Availability of Skilled Professionals
- 3.4. Market Trends
- 3.4.1. Drug Discovery and Development is Expected to be the Largest Growing Segment
- 4. Market Factor Analysis
- 4.1. Porters Five Forces
- 4.2. Supply/Value Chain
- 4.3. PESTEL analysis
- 4.4. Market Entropy
- 4.5. Patent/Trademark Analysis
- 5. Global Glycobiology Market Analysis, Insights and Forecast, 2019-2031
- 5.1. Market Analysis, Insights and Forecast - by Product
- 5.1.1. Enzymes
- 5.1.2. Instruments
- 5.1.3. Kits and Reagents
- 5.2. Market Analysis, Insights and Forecast - by Application
- 5.2.1. Diagnostics
- 5.2.2. Drug Discovery and Development
- 5.2.3. Oncology
- 5.2.4. Immunology
- 5.2.5. Other Applications
- 5.3. Market Analysis, Insights and Forecast - by End User
- 5.3.1. Pharmaceutical and Biotechnology Companies
- 5.3.2. Contract Research Organizations
- 5.3.3. Other End Users
- 5.4. Market Analysis, Insights and Forecast - by Region
- 5.4.1. North America
- 5.4.2. Europe
- 5.4.3. Asia Pacific
- 5.4.4. Middle East and Africa
- 5.4.5. South America
- 5.1. Market Analysis, Insights and Forecast - by Product
- 6. North America Glycobiology Market Analysis, Insights and Forecast, 2019-2031
- 6.1. Market Analysis, Insights and Forecast - by Product
- 6.1.1. Enzymes
- 6.1.2. Instruments
- 6.1.3. Kits and Reagents
- 6.2. Market Analysis, Insights and Forecast - by Application
- 6.2.1. Diagnostics
- 6.2.2. Drug Discovery and Development
- 6.2.3. Oncology
- 6.2.4. Immunology
- 6.2.5. Other Applications
- 6.3. Market Analysis, Insights and Forecast - by End User
- 6.3.1. Pharmaceutical and Biotechnology Companies
- 6.3.2. Contract Research Organizations
- 6.3.3. Other End Users
- 6.1. Market Analysis, Insights and Forecast - by Product
- 7. Europe Glycobiology Market Analysis, Insights and Forecast, 2019-2031
- 7.1. Market Analysis, Insights and Forecast - by Product
- 7.1.1. Enzymes
- 7.1.2. Instruments
- 7.1.3. Kits and Reagents
- 7.2. Market Analysis, Insights and Forecast - by Application
- 7.2.1. Diagnostics
- 7.2.2. Drug Discovery and Development
- 7.2.3. Oncology
- 7.2.4. Immunology
- 7.2.5. Other Applications
- 7.3. Market Analysis, Insights and Forecast - by End User
- 7.3.1. Pharmaceutical and Biotechnology Companies
- 7.3.2. Contract Research Organizations
- 7.3.3. Other End Users
- 7.1. Market Analysis, Insights and Forecast - by Product
- 8. Asia Pacific Glycobiology Market Analysis, Insights and Forecast, 2019-2031
- 8.1. Market Analysis, Insights and Forecast - by Product
- 8.1.1. Enzymes
- 8.1.2. Instruments
- 8.1.3. Kits and Reagents
- 8.2. Market Analysis, Insights and Forecast - by Application
- 8.2.1. Diagnostics
- 8.2.2. Drug Discovery and Development
- 8.2.3. Oncology
- 8.2.4. Immunology
- 8.2.5. Other Applications
- 8.3. Market Analysis, Insights and Forecast - by End User
- 8.3.1. Pharmaceutical and Biotechnology Companies
- 8.3.2. Contract Research Organizations
- 8.3.3. Other End Users
- 8.1. Market Analysis, Insights and Forecast - by Product
- 9. Middle East and Africa Glycobiology Market Analysis, Insights and Forecast, 2019-2031
- 9.1. Market Analysis, Insights and Forecast - by Product
- 9.1.1. Enzymes
- 9.1.2. Instruments
- 9.1.3. Kits and Reagents
- 9.2. Market Analysis, Insights and Forecast - by Application
- 9.2.1. Diagnostics
- 9.2.2. Drug Discovery and Development
- 9.2.3. Oncology
- 9.2.4. Immunology
- 9.2.5. Other Applications
- 9.3. Market Analysis, Insights and Forecast - by End User
- 9.3.1. Pharmaceutical and Biotechnology Companies
- 9.3.2. Contract Research Organizations
- 9.3.3. Other End Users
- 9.1. Market Analysis, Insights and Forecast - by Product
- 10. South America Glycobiology Market Analysis, Insights and Forecast, 2019-2031
- 10.1. Market Analysis, Insights and Forecast - by Product
- 10.1.1. Enzymes
- 10.1.2. Instruments
- 10.1.3. Kits and Reagents
- 10.2. Market Analysis, Insights and Forecast - by Application
- 10.2.1. Diagnostics
- 10.2.2. Drug Discovery and Development
- 10.2.3. Oncology
- 10.2.4. Immunology
- 10.2.5. Other Applications
- 10.3. Market Analysis, Insights and Forecast - by End User
- 10.3.1. Pharmaceutical and Biotechnology Companies
- 10.3.2. Contract Research Organizations
- 10.3.3. Other End Users
- 10.1. Market Analysis, Insights and Forecast - by Product
- 11. North America Glycobiology Market Analysis, Insights and Forecast, 2019-2031
- 11.1. Market Analysis, Insights and Forecast - By Country/Sub-region
- 11.1.1 United States
- 11.1.2 Canada
- 11.1.3 Mexico
- 12. Europe Glycobiology Market Analysis, Insights and Forecast, 2019-2031
- 12.1. Market Analysis, Insights and Forecast - By Country/Sub-region
- 12.1.1 Germany
- 12.1.2 United Kingdom
- 12.1.3 France
- 12.1.4 Italy
- 12.1.5 Spain
- 12.1.6 Rest of Europe
- 13. Asia Pacific Glycobiology Market Analysis, Insights and Forecast, 2019-2031
- 13.1. Market Analysis, Insights and Forecast - By Country/Sub-region
- 13.1.1 China
- 13.1.2 Japan
- 13.1.3 India
- 13.1.4 Australia
- 13.1.5 South Korea
- 13.1.6 Rest of Asia Pacific
- 14. Middle East and Africa Glycobiology Market Analysis, Insights and Forecast, 2019-2031
- 14.1. Market Analysis, Insights and Forecast - By Country/Sub-region
- 14.1.1 GCC
- 14.1.2 South Africa
- 14.1.3 Rest of Middle East and Africa
- 15. South America Glycobiology Market Analysis, Insights and Forecast, 2019-2031
- 15.1. Market Analysis, Insights and Forecast - By Country/Sub-region
- 15.1.1 Brazil
- 15.1.2 Argentina
- 15.1.3 Rest of South America
- 16. Competitive Analysis
- 16.1. Global Market Share Analysis 2024
- 16.2. Company Profiles
- 16.2.1 Waters Corporation
- 16.2.1.1. Overview
- 16.2.1.2. Products
- 16.2.1.3. SWOT Analysis
- 16.2.1.4. Recent Developments
- 16.2.1.5. Financials (Based on Availability)
- 16.2.2 Merck KGaA
- 16.2.2.1. Overview
- 16.2.2.2. Products
- 16.2.2.3. SWOT Analysis
- 16.2.2.4. Recent Developments
- 16.2.2.5. Financials (Based on Availability)
- 16.2.3 New England Biolabs
- 16.2.3.1. Overview
- 16.2.3.2. Products
- 16.2.3.3. SWOT Analysis
- 16.2.3.4. Recent Developments
- 16.2.3.5. Financials (Based on Availability)
- 16.2.4 ProZyme
- 16.2.4.1. Overview
- 16.2.4.2. Products
- 16.2.4.3. SWOT Analysis
- 16.2.4.4. Recent Developments
- 16.2.4.5. Financials (Based on Availability)
- 16.2.5 Takara Bio
- 16.2.5.1. Overview
- 16.2.5.2. Products
- 16.2.5.3. SWOT Analysis
- 16.2.5.4. Recent Developments
- 16.2.5.5. Financials (Based on Availability)
- 16.2.6 Danaher Corporation
- 16.2.6.1. Overview
- 16.2.6.2. Products
- 16.2.6.3. SWOT Analysis
- 16.2.6.4. Recent Developments
- 16.2.6.5. Financials (Based on Availability)
- 16.2.7 Thermo Fisher Scientific
- 16.2.7.1. Overview
- 16.2.7.2. Products
- 16.2.7.3. SWOT Analysis
- 16.2.7.4. Recent Developments
- 16.2.7.5. Financials (Based on Availability)
- 16.2.8 Bruker Corporation
- 16.2.8.1. Overview
- 16.2.8.2. Products
- 16.2.8.3. SWOT Analysis
- 16.2.8.4. Recent Developments
- 16.2.8.5. Financials (Based on Availability)
- 16.2.9 Agilent Technologies
- 16.2.9.1. Overview
- 16.2.9.2. Products
- 16.2.9.3. SWOT Analysis
- 16.2.9.4. Recent Developments
- 16.2.9.5. Financials (Based on Availability)
- 16.2.10 Shimadzu Corporation
- 16.2.10.1. Overview
- 16.2.10.2. Products
- 16.2.10.3. SWOT Analysis
- 16.2.10.4. Recent Developments
- 16.2.10.5. Financials (Based on Availability)
- 16.2.1 Waters Corporation
List of Figures
- Figure 1: Global Glycobiology Market Revenue Breakdown (Million, %) by Region 2024 & 2032
- Figure 2: Global Glycobiology Market Volume Breakdown (K Unit, %) by Region 2024 & 2032
- Figure 3: North America Glycobiology Market Revenue (Million), by Country 2024 & 2032
- Figure 4: North America Glycobiology Market Volume (K Unit), by Country 2024 & 2032
- Figure 5: North America Glycobiology Market Revenue Share (%), by Country 2024 & 2032
- Figure 6: North America Glycobiology Market Volume Share (%), by Country 2024 & 2032
- Figure 7: Europe Glycobiology Market Revenue (Million), by Country 2024 & 2032
- Figure 8: Europe Glycobiology Market Volume (K Unit), by Country 2024 & 2032
- Figure 9: Europe Glycobiology Market Revenue Share (%), by Country 2024 & 2032
- Figure 10: Europe Glycobiology Market Volume Share (%), by Country 2024 & 2032
- Figure 11: Asia Pacific Glycobiology Market Revenue (Million), by Country 2024 & 2032
- Figure 12: Asia Pacific Glycobiology Market Volume (K Unit), by Country 2024 & 2032
- Figure 13: Asia Pacific Glycobiology Market Revenue Share (%), by Country 2024 & 2032
- Figure 14: Asia Pacific Glycobiology Market Volume Share (%), by Country 2024 & 2032
- Figure 15: Middle East and Africa Glycobiology Market Revenue (Million), by Country 2024 & 2032
- Figure 16: Middle East and Africa Glycobiology Market Volume (K Unit), by Country 2024 & 2032
- Figure 17: Middle East and Africa Glycobiology Market Revenue Share (%), by Country 2024 & 2032
- Figure 18: Middle East and Africa Glycobiology Market Volume Share (%), by Country 2024 & 2032
- Figure 19: South America Glycobiology Market Revenue (Million), by Country 2024 & 2032
- Figure 20: South America Glycobiology Market Volume (K Unit), by Country 2024 & 2032
- Figure 21: South America Glycobiology Market Revenue Share (%), by Country 2024 & 2032
- Figure 22: South America Glycobiology Market Volume Share (%), by Country 2024 & 2032
- Figure 23: North America Glycobiology Market Revenue (Million), by Product 2024 & 2032
- Figure 24: North America Glycobiology Market Volume (K Unit), by Product 2024 & 2032
- Figure 25: North America Glycobiology Market Revenue Share (%), by Product 2024 & 2032
- Figure 26: North America Glycobiology Market Volume Share (%), by Product 2024 & 2032
- Figure 27: North America Glycobiology Market Revenue (Million), by Application 2024 & 2032
- Figure 28: North America Glycobiology Market Volume (K Unit), by Application 2024 & 2032
- Figure 29: North America Glycobiology Market Revenue Share (%), by Application 2024 & 2032
- Figure 30: North America Glycobiology Market Volume Share (%), by Application 2024 & 2032
- Figure 31: North America Glycobiology Market Revenue (Million), by End User 2024 & 2032
- Figure 32: North America Glycobiology Market Volume (K Unit), by End User 2024 & 2032
- Figure 33: North America Glycobiology Market Revenue Share (%), by End User 2024 & 2032
- Figure 34: North America Glycobiology Market Volume Share (%), by End User 2024 & 2032
- Figure 35: North America Glycobiology Market Revenue (Million), by Country 2024 & 2032
- Figure 36: North America Glycobiology Market Volume (K Unit), by Country 2024 & 2032
- Figure 37: North America Glycobiology Market Revenue Share (%), by Country 2024 & 2032
- Figure 38: North America Glycobiology Market Volume Share (%), by Country 2024 & 2032
- Figure 39: Europe Glycobiology Market Revenue (Million), by Product 2024 & 2032
- Figure 40: Europe Glycobiology Market Volume (K Unit), by Product 2024 & 2032
- Figure 41: Europe Glycobiology Market Revenue Share (%), by Product 2024 & 2032
- Figure 42: Europe Glycobiology Market Volume Share (%), by Product 2024 & 2032
- Figure 43: Europe Glycobiology Market Revenue (Million), by Application 2024 & 2032
- Figure 44: Europe Glycobiology Market Volume (K Unit), by Application 2024 & 2032
- Figure 45: Europe Glycobiology Market Revenue Share (%), by Application 2024 & 2032
- Figure 46: Europe Glycobiology Market Volume Share (%), by Application 2024 & 2032
- Figure 47: Europe Glycobiology Market Revenue (Million), by End User 2024 & 2032
- Figure 48: Europe Glycobiology Market Volume (K Unit), by End User 2024 & 2032
- Figure 49: Europe Glycobiology Market Revenue Share (%), by End User 2024 & 2032
- Figure 50: Europe Glycobiology Market Volume Share (%), by End User 2024 & 2032
- Figure 51: Europe Glycobiology Market Revenue (Million), by Country 2024 & 2032
- Figure 52: Europe Glycobiology Market Volume (K Unit), by Country 2024 & 2032
- Figure 53: Europe Glycobiology Market Revenue Share (%), by Country 2024 & 2032
- Figure 54: Europe Glycobiology Market Volume Share (%), by Country 2024 & 2032
- Figure 55: Asia Pacific Glycobiology Market Revenue (Million), by Product 2024 & 2032
- Figure 56: Asia Pacific Glycobiology Market Volume (K Unit), by Product 2024 & 2032
- Figure 57: Asia Pacific Glycobiology Market Revenue Share (%), by Product 2024 & 2032
- Figure 58: Asia Pacific Glycobiology Market Volume Share (%), by Product 2024 & 2032
- Figure 59: Asia Pacific Glycobiology Market Revenue (Million), by Application 2024 & 2032
- Figure 60: Asia Pacific Glycobiology Market Volume (K Unit), by Application 2024 & 2032
- Figure 61: Asia Pacific Glycobiology Market Revenue Share (%), by Application 2024 & 2032
- Figure 62: Asia Pacific Glycobiology Market Volume Share (%), by Application 2024 & 2032
- Figure 63: Asia Pacific Glycobiology Market Revenue (Million), by End User 2024 & 2032
- Figure 64: Asia Pacific Glycobiology Market Volume (K Unit), by End User 2024 & 2032
- Figure 65: Asia Pacific Glycobiology Market Revenue Share (%), by End User 2024 & 2032
- Figure 66: Asia Pacific Glycobiology Market Volume Share (%), by End User 2024 & 2032
- Figure 67: Asia Pacific Glycobiology Market Revenue (Million), by Country 2024 & 2032
- Figure 68: Asia Pacific Glycobiology Market Volume (K Unit), by Country 2024 & 2032
- Figure 69: Asia Pacific Glycobiology Market Revenue Share (%), by Country 2024 & 2032
- Figure 70: Asia Pacific Glycobiology Market Volume Share (%), by Country 2024 & 2032
- Figure 71: Middle East and Africa Glycobiology Market Revenue (Million), by Product 2024 & 2032
- Figure 72: Middle East and Africa Glycobiology Market Volume (K Unit), by Product 2024 & 2032
- Figure 73: Middle East and Africa Glycobiology Market Revenue Share (%), by Product 2024 & 2032
- Figure 74: Middle East and Africa Glycobiology Market Volume Share (%), by Product 2024 & 2032
- Figure 75: Middle East and Africa Glycobiology Market Revenue (Million), by Application 2024 & 2032
- Figure 76: Middle East and Africa Glycobiology Market Volume (K Unit), by Application 2024 & 2032
- Figure 77: Middle East and Africa Glycobiology Market Revenue Share (%), by Application 2024 & 2032
- Figure 78: Middle East and Africa Glycobiology Market Volume Share (%), by Application 2024 & 2032
- Figure 79: Middle East and Africa Glycobiology Market Revenue (Million), by End User 2024 & 2032
- Figure 80: Middle East and Africa Glycobiology Market Volume (K Unit), by End User 2024 & 2032
- Figure 81: Middle East and Africa Glycobiology Market Revenue Share (%), by End User 2024 & 2032
- Figure 82: Middle East and Africa Glycobiology Market Volume Share (%), by End User 2024 & 2032
- Figure 83: Middle East and Africa Glycobiology Market Revenue (Million), by Country 2024 & 2032
- Figure 84: Middle East and Africa Glycobiology Market Volume (K Unit), by Country 2024 & 2032
- Figure 85: Middle East and Africa Glycobiology Market Revenue Share (%), by Country 2024 & 2032
- Figure 86: Middle East and Africa Glycobiology Market Volume Share (%), by Country 2024 & 2032
- Figure 87: South America Glycobiology Market Revenue (Million), by Product 2024 & 2032
- Figure 88: South America Glycobiology Market Volume (K Unit), by Product 2024 & 2032
- Figure 89: South America Glycobiology Market Revenue Share (%), by Product 2024 & 2032
- Figure 90: South America Glycobiology Market Volume Share (%), by Product 2024 & 2032
- Figure 91: South America Glycobiology Market Revenue (Million), by Application 2024 & 2032
- Figure 92: South America Glycobiology Market Volume (K Unit), by Application 2024 & 2032
- Figure 93: South America Glycobiology Market Revenue Share (%), by Application 2024 & 2032
- Figure 94: South America Glycobiology Market Volume Share (%), by Application 2024 & 2032
- Figure 95: South America Glycobiology Market Revenue (Million), by End User 2024 & 2032
- Figure 96: South America Glycobiology Market Volume (K Unit), by End User 2024 & 2032
- Figure 97: South America Glycobiology Market Revenue Share (%), by End User 2024 & 2032
- Figure 98: South America Glycobiology Market Volume Share (%), by End User 2024 & 2032
- Figure 99: South America Glycobiology Market Revenue (Million), by Country 2024 & 2032
- Figure 100: South America Glycobiology Market Volume (K Unit), by Country 2024 & 2032
- Figure 101: South America Glycobiology Market Revenue Share (%), by Country 2024 & 2032
- Figure 102: South America Glycobiology Market Volume Share (%), by Country 2024 & 2032
List of Tables
- Table 1: Global Glycobiology Market Revenue Million Forecast, by Region 2019 & 2032
- Table 2: Global Glycobiology Market Volume K Unit Forecast, by Region 2019 & 2032
- Table 3: Global Glycobiology Market Revenue Million Forecast, by Product 2019 & 2032
- Table 4: Global Glycobiology Market Volume K Unit Forecast, by Product 2019 & 2032
- Table 5: Global Glycobiology Market Revenue Million Forecast, by Application 2019 & 2032
- Table 6: Global Glycobiology Market Volume K Unit Forecast, by Application 2019 & 2032
- Table 7: Global Glycobiology Market Revenue Million Forecast, by End User 2019 & 2032
- Table 8: Global Glycobiology Market Volume K Unit Forecast, by End User 2019 & 2032
- Table 9: Global Glycobiology Market Revenue Million Forecast, by Region 2019 & 2032
- Table 10: Global Glycobiology Market Volume K Unit Forecast, by Region 2019 & 2032
- Table 11: Global Glycobiology Market Revenue Million Forecast, by Country 2019 & 2032
- Table 12: Global Glycobiology Market Volume K Unit Forecast, by Country 2019 & 2032
- Table 13: United States Glycobiology Market Revenue (Million) Forecast, by Application 2019 & 2032
- Table 14: United States Glycobiology Market Volume (K Unit) Forecast, by Application 2019 & 2032
- Table 15: Canada Glycobiology Market Revenue (Million) Forecast, by Application 2019 & 2032
- Table 16: Canada Glycobiology Market Volume (K Unit) Forecast, by Application 2019 & 2032
- Table 17: Mexico Glycobiology Market Revenue (Million) Forecast, by Application 2019 & 2032
- Table 18: Mexico Glycobiology Market Volume (K Unit) Forecast, by Application 2019 & 2032
- Table 19: Global Glycobiology Market Revenue Million Forecast, by Country 2019 & 2032
- Table 20: Global Glycobiology Market Volume K Unit Forecast, by Country 2019 & 2032
- Table 21: Germany Glycobiology Market Revenue (Million) Forecast, by Application 2019 & 2032
- Table 22: Germany Glycobiology Market Volume (K Unit) Forecast, by Application 2019 & 2032
- Table 23: United Kingdom Glycobiology Market Revenue (Million) Forecast, by Application 2019 & 2032
- Table 24: United Kingdom Glycobiology Market Volume (K Unit) Forecast, by Application 2019 & 2032
- Table 25: France Glycobiology Market Revenue (Million) Forecast, by Application 2019 & 2032
- Table 26: France Glycobiology Market Volume (K Unit) Forecast, by Application 2019 & 2032
- Table 27: Italy Glycobiology Market Revenue (Million) Forecast, by Application 2019 & 2032
- Table 28: Italy Glycobiology Market Volume (K Unit) Forecast, by Application 2019 & 2032
- Table 29: Spain Glycobiology Market Revenue (Million) Forecast, by Application 2019 & 2032
- Table 30: Spain Glycobiology Market Volume (K Unit) Forecast, by Application 2019 & 2032
- Table 31: Rest of Europe Glycobiology Market Revenue (Million) Forecast, by Application 2019 & 2032
- Table 32: Rest of Europe Glycobiology Market Volume (K Unit) Forecast, by Application 2019 & 2032
- Table 33: Global Glycobiology Market Revenue Million Forecast, by Country 2019 & 2032
- Table 34: Global Glycobiology Market Volume K Unit Forecast, by Country 2019 & 2032
- Table 35: China Glycobiology Market Revenue (Million) Forecast, by Application 2019 & 2032
- Table 36: China Glycobiology Market Volume (K Unit) Forecast, by Application 2019 & 2032
- Table 37: Japan Glycobiology Market Revenue (Million) Forecast, by Application 2019 & 2032
- Table 38: Japan Glycobiology Market Volume (K Unit) Forecast, by Application 2019 & 2032
- Table 39: India Glycobiology Market Revenue (Million) Forecast, by Application 2019 & 2032
- Table 40: India Glycobiology Market Volume (K Unit) Forecast, by Application 2019 & 2032
- Table 41: Australia Glycobiology Market Revenue (Million) Forecast, by Application 2019 & 2032
- Table 42: Australia Glycobiology Market Volume (K Unit) Forecast, by Application 2019 & 2032
- Table 43: South Korea Glycobiology Market Revenue (Million) Forecast, by Application 2019 & 2032
- Table 44: South Korea Glycobiology Market Volume (K Unit) Forecast, by Application 2019 & 2032
- Table 45: Rest of Asia Pacific Glycobiology Market Revenue (Million) Forecast, by Application 2019 & 2032
- Table 46: Rest of Asia Pacific Glycobiology Market Volume (K Unit) Forecast, by Application 2019 & 2032
- Table 47: Global Glycobiology Market Revenue Million Forecast, by Country 2019 & 2032
- Table 48: Global Glycobiology Market Volume K Unit Forecast, by Country 2019 & 2032
- Table 49: GCC Glycobiology Market Revenue (Million) Forecast, by Application 2019 & 2032
- Table 50: GCC Glycobiology Market Volume (K Unit) Forecast, by Application 2019 & 2032
- Table 51: South Africa Glycobiology Market Revenue (Million) Forecast, by Application 2019 & 2032
- Table 52: South Africa Glycobiology Market Volume (K Unit) Forecast, by Application 2019 & 2032
- Table 53: Rest of Middle East and Africa Glycobiology Market Revenue (Million) Forecast, by Application 2019 & 2032
- Table 54: Rest of Middle East and Africa Glycobiology Market Volume (K Unit) Forecast, by Application 2019 & 2032
- Table 55: Global Glycobiology Market Revenue Million Forecast, by Country 2019 & 2032
- Table 56: Global Glycobiology Market Volume K Unit Forecast, by Country 2019 & 2032
- Table 57: Brazil Glycobiology Market Revenue (Million) Forecast, by Application 2019 & 2032
- Table 58: Brazil Glycobiology Market Volume (K Unit) Forecast, by Application 2019 & 2032
- Table 59: Argentina Glycobiology Market Revenue (Million) Forecast, by Application 2019 & 2032
- Table 60: Argentina Glycobiology Market Volume (K Unit) Forecast, by Application 2019 & 2032
- Table 61: Rest of South America Glycobiology Market Revenue (Million) Forecast, by Application 2019 & 2032
- Table 62: Rest of South America Glycobiology Market Volume (K Unit) Forecast, by Application 2019 & 2032
- Table 63: Global Glycobiology Market Revenue Million Forecast, by Product 2019 & 2032
- Table 64: Global Glycobiology Market Volume K Unit Forecast, by Product 2019 & 2032
- Table 65: Global Glycobiology Market Revenue Million Forecast, by Application 2019 & 2032
- Table 66: Global Glycobiology Market Volume K Unit Forecast, by Application 2019 & 2032
- Table 67: Global Glycobiology Market Revenue Million Forecast, by End User 2019 & 2032
- Table 68: Global Glycobiology Market Volume K Unit Forecast, by End User 2019 & 2032
- Table 69: Global Glycobiology Market Revenue Million Forecast, by Country 2019 & 2032
- Table 70: Global Glycobiology Market Volume K Unit Forecast, by Country 2019 & 2032
- Table 71: United States Glycobiology Market Revenue (Million) Forecast, by Application 2019 & 2032
- Table 72: United States Glycobiology Market Volume (K Unit) Forecast, by Application 2019 & 2032
- Table 73: Canada Glycobiology Market Revenue (Million) Forecast, by Application 2019 & 2032
- Table 74: Canada Glycobiology Market Volume (K Unit) Forecast, by Application 2019 & 2032
- Table 75: Mexico Glycobiology Market Revenue (Million) Forecast, by Application 2019 & 2032
- Table 76: Mexico Glycobiology Market Volume (K Unit) Forecast, by Application 2019 & 2032
- Table 77: Global Glycobiology Market Revenue Million Forecast, by Product 2019 & 2032
- Table 78: Global Glycobiology Market Volume K Unit Forecast, by Product 2019 & 2032
- Table 79: Global Glycobiology Market Revenue Million Forecast, by Application 2019 & 2032
- Table 80: Global Glycobiology Market Volume K Unit Forecast, by Application 2019 & 2032
- Table 81: Global Glycobiology Market Revenue Million Forecast, by End User 2019 & 2032
- Table 82: Global Glycobiology Market Volume K Unit Forecast, by End User 2019 & 2032
- Table 83: Global Glycobiology Market Revenue Million Forecast, by Country 2019 & 2032
- Table 84: Global Glycobiology Market Volume K Unit Forecast, by Country 2019 & 2032
- Table 85: Germany Glycobiology Market Revenue (Million) Forecast, by Application 2019 & 2032
- Table 86: Germany Glycobiology Market Volume (K Unit) Forecast, by Application 2019 & 2032
- Table 87: United Kingdom Glycobiology Market Revenue (Million) Forecast, by Application 2019 & 2032
- Table 88: United Kingdom Glycobiology Market Volume (K Unit) Forecast, by Application 2019 & 2032
- Table 89: France Glycobiology Market Revenue (Million) Forecast, by Application 2019 & 2032
- Table 90: France Glycobiology Market Volume (K Unit) Forecast, by Application 2019 & 2032
- Table 91: Italy Glycobiology Market Revenue (Million) Forecast, by Application 2019 & 2032
- Table 92: Italy Glycobiology Market Volume (K Unit) Forecast, by Application 2019 & 2032
- Table 93: Spain Glycobiology Market Revenue (Million) Forecast, by Application 2019 & 2032
- Table 94: Spain Glycobiology Market Volume (K Unit) Forecast, by Application 2019 & 2032
- Table 95: Rest of Europe Glycobiology Market Revenue (Million) Forecast, by Application 2019 & 2032
- Table 96: Rest of Europe Glycobiology Market Volume (K Unit) Forecast, by Application 2019 & 2032
- Table 97: Global Glycobiology Market Revenue Million Forecast, by Product 2019 & 2032
- Table 98: Global Glycobiology Market Volume K Unit Forecast, by Product 2019 & 2032
- Table 99: Global Glycobiology Market Revenue Million Forecast, by Application 2019 & 2032
- Table 100: Global Glycobiology Market Volume K Unit Forecast, by Application 2019 & 2032
- Table 101: Global Glycobiology Market Revenue Million Forecast, by End User 2019 & 2032
- Table 102: Global Glycobiology Market Volume K Unit Forecast, by End User 2019 & 2032
- Table 103: Global Glycobiology Market Revenue Million Forecast, by Country 2019 & 2032
- Table 104: Global Glycobiology Market Volume K Unit Forecast, by Country 2019 & 2032
- Table 105: China Glycobiology Market Revenue (Million) Forecast, by Application 2019 & 2032
- Table 106: China Glycobiology Market Volume (K Unit) Forecast, by Application 2019 & 2032
- Table 107: Japan Glycobiology Market Revenue (Million) Forecast, by Application 2019 & 2032
- Table 108: Japan Glycobiology Market Volume (K Unit) Forecast, by Application 2019 & 2032
- Table 109: India Glycobiology Market Revenue (Million) Forecast, by Application 2019 & 2032
- Table 110: India Glycobiology Market Volume (K Unit) Forecast, by Application 2019 & 2032
- Table 111: Australia Glycobiology Market Revenue (Million) Forecast, by Application 2019 & 2032
- Table 112: Australia Glycobiology Market Volume (K Unit) Forecast, by Application 2019 & 2032
- Table 113: South Korea Glycobiology Market Revenue (Million) Forecast, by Application 2019 & 2032
- Table 114: South Korea Glycobiology Market Volume (K Unit) Forecast, by Application 2019 & 2032
- Table 115: Rest of Asia Pacific Glycobiology Market Revenue (Million) Forecast, by Application 2019 & 2032
- Table 116: Rest of Asia Pacific Glycobiology Market Volume (K Unit) Forecast, by Application 2019 & 2032
- Table 117: Global Glycobiology Market Revenue Million Forecast, by Product 2019 & 2032
- Table 118: Global Glycobiology Market Volume K Unit Forecast, by Product 2019 & 2032
- Table 119: Global Glycobiology Market Revenue Million Forecast, by Application 2019 & 2032
- Table 120: Global Glycobiology Market Volume K Unit Forecast, by Application 2019 & 2032
- Table 121: Global Glycobiology Market Revenue Million Forecast, by End User 2019 & 2032
- Table 122: Global Glycobiology Market Volume K Unit Forecast, by End User 2019 & 2032
- Table 123: Global Glycobiology Market Revenue Million Forecast, by Country 2019 & 2032
- Table 124: Global Glycobiology Market Volume K Unit Forecast, by Country 2019 & 2032
- Table 125: GCC Glycobiology Market Revenue (Million) Forecast, by Application 2019 & 2032
- Table 126: GCC Glycobiology Market Volume (K Unit) Forecast, by Application 2019 & 2032
- Table 127: South Africa Glycobiology Market Revenue (Million) Forecast, by Application 2019 & 2032
- Table 128: South Africa Glycobiology Market Volume (K Unit) Forecast, by Application 2019 & 2032
- Table 129: Rest of Middle East and Africa Glycobiology Market Revenue (Million) Forecast, by Application 2019 & 2032
- Table 130: Rest of Middle East and Africa Glycobiology Market Volume (K Unit) Forecast, by Application 2019 & 2032
- Table 131: Global Glycobiology Market Revenue Million Forecast, by Product 2019 & 2032
- Table 132: Global Glycobiology Market Volume K Unit Forecast, by Product 2019 & 2032
- Table 133: Global Glycobiology Market Revenue Million Forecast, by Application 2019 & 2032
- Table 134: Global Glycobiology Market Volume K Unit Forecast, by Application 2019 & 2032
- Table 135: Global Glycobiology Market Revenue Million Forecast, by End User 2019 & 2032
- Table 136: Global Glycobiology Market Volume K Unit Forecast, by End User 2019 & 2032
- Table 137: Global Glycobiology Market Revenue Million Forecast, by Country 2019 & 2032
- Table 138: Global Glycobiology Market Volume K Unit Forecast, by Country 2019 & 2032
- Table 139: Brazil Glycobiology Market Revenue (Million) Forecast, by Application 2019 & 2032
- Table 140: Brazil Glycobiology Market Volume (K Unit) Forecast, by Application 2019 & 2032
- Table 141: Argentina Glycobiology Market Revenue (Million) Forecast, by Application 2019 & 2032
- Table 142: Argentina Glycobiology Market Volume (K Unit) Forecast, by Application 2019 & 2032
- Table 143: Rest of South America Glycobiology Market Revenue (Million) Forecast, by Application 2019 & 2032
- Table 144: Rest of South America Glycobiology Market Volume (K Unit) Forecast, by Application 2019 & 2032
Frequently Asked Questions
1. What is the projected Compound Annual Growth Rate (CAGR) of the Glycobiology Market?
The projected CAGR is approximately 14.87%.
2. Which companies are prominent players in the Glycobiology Market?
Key companies in the market include Waters Corporation, Merck KGaA, New England Biolabs, ProZyme, Takara Bio, Danaher Corporation, Thermo Fisher Scientific, Bruker Corporation, Agilent Technologies, Shimadzu Corporation.
3. What are the main segments of the Glycobiology Market?
The market segments include Product, Application, End User.
4. Can you provide details about the market size?
The market size is estimated to be USD 0.62 Million as of 2022.
5. What are some drivers contributing to market growth?
Increasing Government and Private Funding for Glycomics and Proteomics Research; Growing R&D Expenditures by Pharmaceutical and Biotechnology Companies.
6. What are the notable trends driving market growth?
Drug Discovery and Development is Expected to be the Largest Growing Segment.
7. Are there any restraints impacting market growth?
High Product Cost; Low Availability of Skilled Professionals.
8. Can you provide examples of recent developments in the market?
In June 2022, Thermo Fisher Scientific announced a co-marketing agreement with TransMIT GmbH Center for Mass Spectrometric Developments to promote the use of a mass spectrometry imaging (MSI) platform for spatial multi-omics applications in pharma and clinical labs.
9. What pricing options are available for accessing the report?
Pricing options include single-user, multi-user, and enterprise licenses priced at USD 4750, USD 5250, and USD 8750 respectively.
10. Is the market size provided in terms of value or volume?
The market size is provided in terms of value, measured in Million and volume, measured in K Unit.
11. Are there any specific market keywords associated with the report?
Yes, the market keyword associated with the report is "Glycobiology Market," which aids in identifying and referencing the specific market segment covered.
12. How do I determine which pricing option suits my needs best?
The pricing options vary based on user requirements and access needs. Individual users may opt for single-user licenses, while businesses requiring broader access may choose multi-user or enterprise licenses for cost-effective access to the report.
13. Are there any additional resources or data provided in the Glycobiology Market report?
While the report offers comprehensive insights, it's advisable to review the specific contents or supplementary materials provided to ascertain if additional resources or data are available.
14. How can I stay updated on further developments or reports in the Glycobiology Market?
To stay informed about further developments, trends, and reports in the Glycobiology Market, consider subscribing to industry newsletters, following relevant companies and organizations, or regularly checking reputable industry news sources and publications.
Methodology
Step 1 - Identification of Relevant Samples Size from Population Database


Step 2 - Approaches for Defining Global Market Size (Value, Volume* & Price*)

Note*: In applicable scenarios
Step 3 - Data Sources
Primary Research
- Web Analytics
- Survey Reports
- Research Institute
- Latest Research Reports
- Opinion Leaders
Secondary Research
- Annual Reports
- White Paper
- Latest Press Release
- Industry Association
- Paid Database
- Investor Presentations

Step 4 - Data Triangulation
Involves using different sources of information in order to increase the validity of a study
These sources are likely to be stakeholders in a program - participants, other researchers, program staff, other community members, and so on.
Then we put all data in single framework & apply various statistical tools to find out the dynamic on the market.
During the analysis stage, feedback from the stakeholder groups would be compared to determine areas of agreement as well as areas of divergence


