
Key Insights
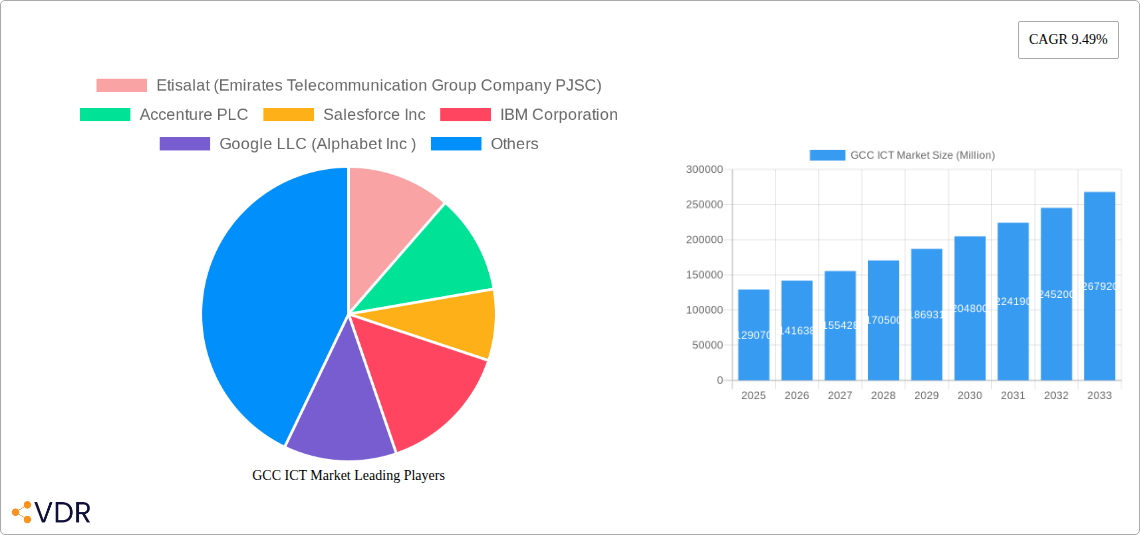
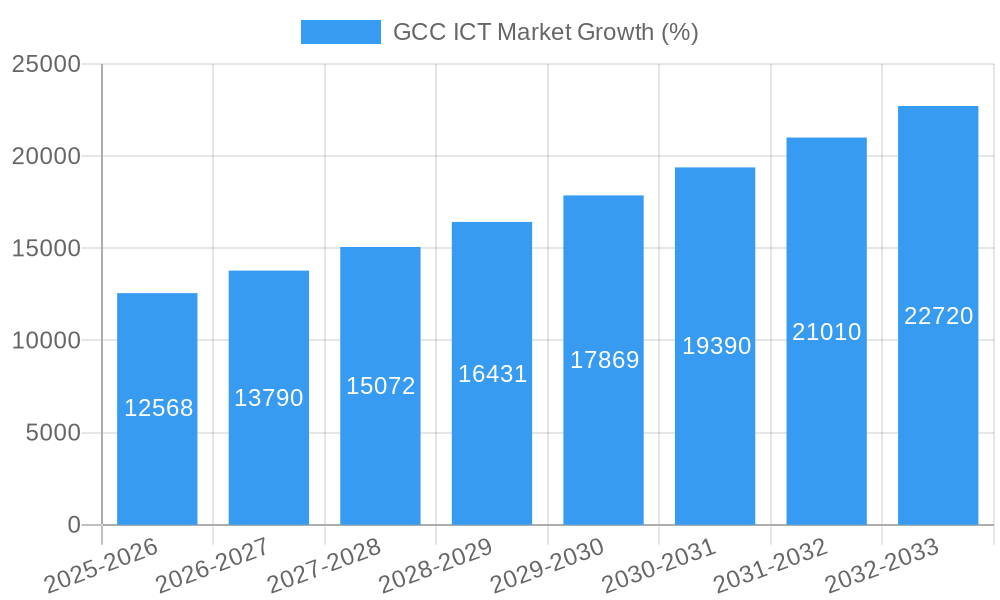
The GCC ICT market, valued at $129.07 billion in 2025, is experiencing robust growth, projected to expand at a CAGR of 9.49% from 2025 to 2033. This expansion is fueled by several key drivers. Firstly, substantial government investments in digital infrastructure and initiatives promoting digital transformation across various sectors are creating a fertile ground for ICT adoption. Secondly, the region's burgeoning population, particularly its young and tech-savvy demographic, is driving demand for advanced technologies like big data analytics, cloud computing, and mobile solutions. Furthermore, the diversification strategies of GCC economies, moving beyond oil and gas, are fueling the adoption of ICT solutions across diverse sectors like finance, healthcare, and tourism. The increasing adoption of smart city initiatives and the rising need for improved cybersecurity solutions also contribute to this growth. While data privacy concerns and potential skills gaps present some challenges, the overall outlook for the GCC ICT market remains highly positive.
The market segmentation reveals significant opportunities within specific areas. The Oil, Gas, and Utilities sector is a key end-user, followed by Travel and Hospitality, reflecting the region's economic structure. Within technology segments, Big Data Analytics, Cloud Computing, and Mobility and Telecom are leading the charge, showing rapid adoption rates. Saudi Arabia, the UAE, and Qatar represent the largest national markets, driving regional growth. Major players like Etisalat, Accenture, Salesforce, and IBM are well-positioned to capitalize on these trends, and the influx of global technology giants further intensifies competition and innovation. The forecast period will likely see increased mergers and acquisitions, strategic partnerships, and further investments in R&D to cater to evolving customer needs and technological advancements. The continued focus on digital transformation across all sectors paints a picture of sustained and impressive growth for the foreseeable future.
GCC ICT Market Report: 2019-2033 Forecast
This comprehensive report provides a detailed analysis of the GCC ICT market, encompassing market dynamics, growth trends, dominant segments, and key players. With a study period spanning 2019-2033, a base year of 2025, and a forecast period of 2025-2033, this report is an invaluable resource for industry professionals, investors, and strategists seeking to understand and capitalize on the opportunities within this rapidly evolving market. The market is segmented by end-user industry, country, technology, and component, providing a granular view of the landscape. The total market size is expected to reach xx Million in 2033.
GCC ICT Market Market Dynamics & Structure
The GCC ICT market is characterized by a dynamic interplay of factors influencing its structure and growth. Market concentration is moderate, with a few large players dominating certain segments while smaller, specialized firms compete in niche areas. Technological innovation, driven by advancements in cloud computing, big data analytics, and AI, is a key driver. However, regulatory frameworks and data privacy concerns present both opportunities and challenges. The market also witnesses significant M&A activity, with larger companies strategically acquiring smaller firms to expand their market share and capabilities. The rising adoption of digital technologies across various sectors fuels significant growth.
- Market Concentration: Moderate, with a few dominant players. Large players hold approximately xx% market share in 2025, with the remaining share spread across numerous smaller players.
- Technological Innovation: Cloud computing, AI, and 5G are major drivers. However, integration challenges and skill gaps represent innovation barriers.
- Regulatory Frameworks: Varying data privacy regulations across GCC countries influence market development.
- Competitive Product Substitutes: Open-source alternatives and emerging technologies present competitive pressure.
- End-User Demographics: A young and digitally savvy population fuels demand for advanced ICT solutions.
- M&A Trends: A significant number (xx) of M&A deals were recorded between 2019 and 2024. Consolidation is expected to continue.
GCC ICT Market Growth Trends & Insights
The GCC ICT market exhibits robust growth, driven by government initiatives promoting digital transformation, increasing investments in infrastructure, and rising demand for advanced technologies across various sectors. The market size experienced substantial growth during the historical period (2019-2024) and is projected to maintain a significant Compound Annual Growth Rate (CAGR) of xx% during the forecast period (2025-2033). This growth is propelled by the widespread adoption of cloud-based solutions, increased mobile penetration, and the expanding role of big data analytics in various industries. Consumer behavior shifts towards digital services and online transactions further contribute to this expansion. Specific metrics like market penetration of cloud services and the adoption rate of IoT devices provide a more detailed picture of this trajectory.
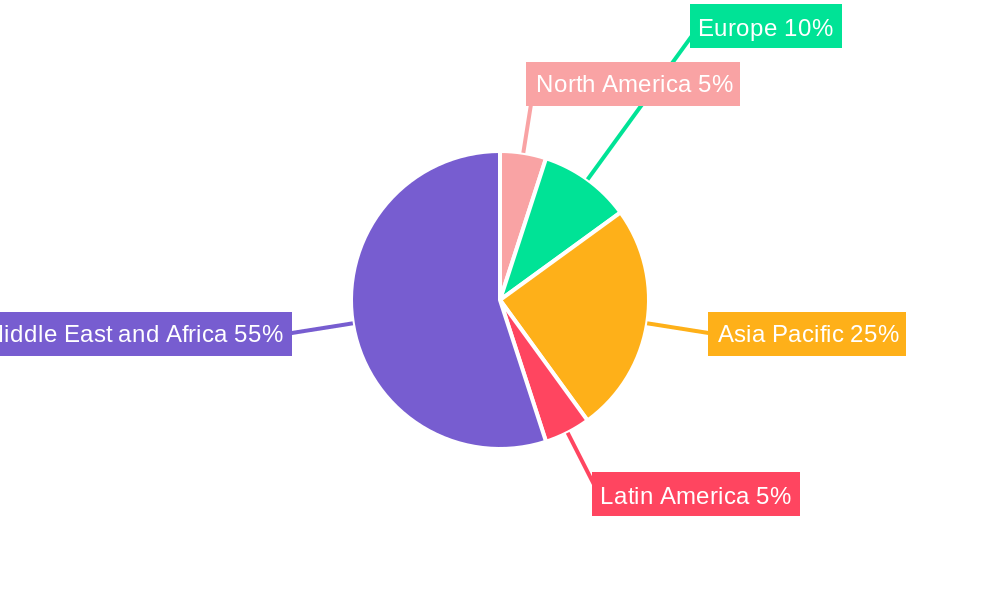
Dominant Regions, Countries, or Segments in GCC ICT Market
Saudi Arabia and the UAE are the leading markets in the GCC region, accounting for the largest share of the overall ICT spending. Within the industry segments, the Oil, Gas and Utilities sector demonstrates strong growth due to its significant investments in digitalization. The Financial Services sector also shows high adoption of ICT solutions for enhanced efficiency and security. The growth is driven by several factors across various regions and segments:
- Saudi Arabia & UAE: Dominate due to high government spending on digital transformation initiatives and large investments in infrastructure.
- Oil, Gas, and Utilities: High spending on digitalization projects.
- Financial Services: Strong demand for cybersecurity and fintech solutions.
- Cloud Computing Technology: Rapid adoption due to scalability and cost-effectiveness.
- Key Drivers: Government support (Vision 2030 in Saudi Arabia), infrastructure development, and increasing digital literacy.
GCC ICT Market Product Landscape
The GCC ICT market showcases a diverse range of products and services, spanning hardware, software, and communication solutions. Innovation focuses on cloud-native applications, AI-powered analytics, and enhanced cybersecurity features. Companies are constantly striving to offer unique selling propositions through superior performance, integration capabilities, and tailored solutions to meet the specific requirements of various industries. The market is witnessing increased adoption of advanced technologies like edge computing and the Internet of Things (IoT).
Key Drivers, Barriers & Challenges in GCC ICT Market
Key Drivers:
- Government initiatives promoting digital transformation.
- Growing adoption of cloud computing and big data analytics.
- Increasing investment in 5G infrastructure.
- Rising demand for cybersecurity solutions.
Key Challenges:
- Regulatory hurdles and data privacy concerns.
- Skill gaps in the ICT workforce.
- High dependence on foreign technology providers.
- Cybersecurity threats and data breaches.
- xx million estimated annual loss due to cybersecurity incidents in 2025.
Emerging Opportunities in GCC ICT Market
- Expansion of fintech solutions and digital payment platforms.
- Growth in the Internet of Things (IoT) and smart city initiatives.
- Increased demand for AI-powered solutions across various sectors.
- Development of specialized ICT solutions for the healthcare and education sectors.
Growth Accelerators in the GCC ICT Market Industry
Long-term growth is fueled by government investments in digital infrastructure, the increasing adoption of cloud and AI technologies across all sectors, and a growing emphasis on cybersecurity. Strategic partnerships between global technology providers and local companies are also accelerating market expansion and fostering innovation. Moreover, the region's ongoing digital transformation initiatives will create substantial opportunities for ICT providers.
Key Players Shaping the GCC ICT Market Market
- Etisalat
- Accenture PLC
- Salesforce Inc
- IBM Corporation
- Google LLC
- Cisco Systems Inc
- HP Inc
- Microsoft Corporation
- Huawei Investment & Holding Co Lt
- Amazon Web Services Inc (AWS)
- Oracle Corporation
- SAP SE
Notable Milestones in GCC ICT Market Sector
- November 2023: Sharjah Electricity, Water and Gas Authority (SEWA) successfully completes digital transformation using SAP solutions.
- September 2023: Microsoft Arabia and KEYSS Project partner to enhance digital transformation of SMEs and startups in Saudi Arabia.
In-Depth GCC ICT Market Market Outlook
The GCC ICT market is poised for continued strong growth, driven by sustained government support, increasing private sector investment, and the growing adoption of advanced technologies. Strategic opportunities exist in areas such as cloud computing, AI, cybersecurity, and the Internet of Things. The market's future success will depend on addressing challenges like cybersecurity threats, skill gaps, and regulatory complexities. However, the long-term outlook remains positive, with significant potential for further expansion and innovation.
GCC ICT Market Segmentation
-
1. Technology
- 1.1. Big Data Analytics
- 1.2. Mobility and Telecom
- 1.3. Cloud Computing
- 1.4. Storage
- 1.5. Business Process Outsourcing
- 1.6. Other Technologies
-
2. Component
- 2.1. Hardware/Devices
- 2.2. Software and Services
- 2.3. Communication and Connectivity
-
3. End-user Industry
- 3.1. Oil, Gas and Utilities
- 3.2. Travel and Hospitality
- 3.3. Healthcare
- 3.4. Financial Services
- 3.5. Manufacturing and Construction
- 3.6. Other End-user Industries
GCC ICT Market Segmentation By Geography
-
1. North America
- 1.1. United States
- 1.2. Canada
- 1.3. Mexico
-
2. South America
- 2.1. Brazil
- 2.2. Argentina
- 2.3. Rest of South America
-
3. Europe
- 3.1. United Kingdom
- 3.2. Germany
- 3.3. France
- 3.4. Italy
- 3.5. Spain
- 3.6. Russia
- 3.7. Benelux
- 3.8. Nordics
- 3.9. Rest of Europe
-
4. Middle East & Africa
- 4.1. Turkey
- 4.2. Israel
- 4.3. GCC
- 4.4. North Africa
- 4.5. South Africa
- 4.6. Rest of Middle East & Africa
-
5. Asia Pacific
- 5.1. China
- 5.2. India
- 5.3. Japan
- 5.4. South Korea
- 5.5. ASEAN
- 5.6. Oceania
- 5.7. Rest of Asia Pacific
GCC ICT Market REPORT HIGHLIGHTS
| Aspects | Details |
|---|---|
| Study Period | 2019-2033 |
| Base Year | 2024 |
| Estimated Year | 2025 |
| Forecast Period | 2025-2033 |
| Historical Period | 2019-2024 |
| Growth Rate | CAGR of 9.49% from 2019-2033 |
| Segmentation |
|
Table of Contents
- 1. Introduction
- 1.1. Research Scope
- 1.2. Market Segmentation
- 1.3. Research Methodology
- 1.4. Definitions and Assumptions
- 2. Executive Summary
- 2.1. Introduction
- 3. Market Dynamics
- 3.1. Introduction
- 3.2. Market Drivers
- 3.2.1. Ongoing Events and Tourism Demanding Automation; Government Policies and PPP Initiatives; Rising Digital Transformation in the Industries
- 3.3. Market Restrains
- 3.3.1. High Dependence on External Sources to Balance the Skill Deficit; Heavy Dependence on the Oil and Gas Sector
- 3.4. Market Trends
- 3.4.1 Oil
- 3.4.2 Gas
- 3.4.3 and Utilities to Witness Major Growth
- 4. Market Factor Analysis
- 4.1. Porters Five Forces
- 4.2. Supply/Value Chain
- 4.3. PESTEL analysis
- 4.4. Market Entropy
- 4.5. Patent/Trademark Analysis
- 5. Global GCC ICT Market Analysis, Insights and Forecast, 2019-2031
- 5.1. Market Analysis, Insights and Forecast - by Technology
- 5.1.1. Big Data Analytics
- 5.1.2. Mobility and Telecom
- 5.1.3. Cloud Computing
- 5.1.4. Storage
- 5.1.5. Business Process Outsourcing
- 5.1.6. Other Technologies
- 5.2. Market Analysis, Insights and Forecast - by Component
- 5.2.1. Hardware/Devices
- 5.2.2. Software and Services
- 5.2.3. Communication and Connectivity
- 5.3. Market Analysis, Insights and Forecast - by End-user Industry
- 5.3.1. Oil, Gas and Utilities
- 5.3.2. Travel and Hospitality
- 5.3.3. Healthcare
- 5.3.4. Financial Services
- 5.3.5. Manufacturing and Construction
- 5.3.6. Other End-user Industries
- 5.4. Market Analysis, Insights and Forecast - by Region
- 5.4.1. North America
- 5.4.2. South America
- 5.4.3. Europe
- 5.4.4. Middle East & Africa
- 5.4.5. Asia Pacific
- 5.1. Market Analysis, Insights and Forecast - by Technology
- 6. North America GCC ICT Market Analysis, Insights and Forecast, 2019-2031
- 6.1. Market Analysis, Insights and Forecast - by Technology
- 6.1.1. Big Data Analytics
- 6.1.2. Mobility and Telecom
- 6.1.3. Cloud Computing
- 6.1.4. Storage
- 6.1.5. Business Process Outsourcing
- 6.1.6. Other Technologies
- 6.2. Market Analysis, Insights and Forecast - by Component
- 6.2.1. Hardware/Devices
- 6.2.2. Software and Services
- 6.2.3. Communication and Connectivity
- 6.3. Market Analysis, Insights and Forecast - by End-user Industry
- 6.3.1. Oil, Gas and Utilities
- 6.3.2. Travel and Hospitality
- 6.3.3. Healthcare
- 6.3.4. Financial Services
- 6.3.5. Manufacturing and Construction
- 6.3.6. Other End-user Industries
- 6.1. Market Analysis, Insights and Forecast - by Technology
- 7. South America GCC ICT Market Analysis, Insights and Forecast, 2019-2031
- 7.1. Market Analysis, Insights and Forecast - by Technology
- 7.1.1. Big Data Analytics
- 7.1.2. Mobility and Telecom
- 7.1.3. Cloud Computing
- 7.1.4. Storage
- 7.1.5. Business Process Outsourcing
- 7.1.6. Other Technologies
- 7.2. Market Analysis, Insights and Forecast - by Component
- 7.2.1. Hardware/Devices
- 7.2.2. Software and Services
- 7.2.3. Communication and Connectivity
- 7.3. Market Analysis, Insights and Forecast - by End-user Industry
- 7.3.1. Oil, Gas and Utilities
- 7.3.2. Travel and Hospitality
- 7.3.3. Healthcare
- 7.3.4. Financial Services
- 7.3.5. Manufacturing and Construction
- 7.3.6. Other End-user Industries
- 7.1. Market Analysis, Insights and Forecast - by Technology
- 8. Europe GCC ICT Market Analysis, Insights and Forecast, 2019-2031
- 8.1. Market Analysis, Insights and Forecast - by Technology
- 8.1.1. Big Data Analytics
- 8.1.2. Mobility and Telecom
- 8.1.3. Cloud Computing
- 8.1.4. Storage
- 8.1.5. Business Process Outsourcing
- 8.1.6. Other Technologies
- 8.2. Market Analysis, Insights and Forecast - by Component
- 8.2.1. Hardware/Devices
- 8.2.2. Software and Services
- 8.2.3. Communication and Connectivity
- 8.3. Market Analysis, Insights and Forecast - by End-user Industry
- 8.3.1. Oil, Gas and Utilities
- 8.3.2. Travel and Hospitality
- 8.3.3. Healthcare
- 8.3.4. Financial Services
- 8.3.5. Manufacturing and Construction
- 8.3.6. Other End-user Industries
- 8.1. Market Analysis, Insights and Forecast - by Technology
- 9. Middle East & Africa GCC ICT Market Analysis, Insights and Forecast, 2019-2031
- 9.1. Market Analysis, Insights and Forecast - by Technology
- 9.1.1. Big Data Analytics
- 9.1.2. Mobility and Telecom
- 9.1.3. Cloud Computing
- 9.1.4. Storage
- 9.1.5. Business Process Outsourcing
- 9.1.6. Other Technologies
- 9.2. Market Analysis, Insights and Forecast - by Component
- 9.2.1. Hardware/Devices
- 9.2.2. Software and Services
- 9.2.3. Communication and Connectivity
- 9.3. Market Analysis, Insights and Forecast - by End-user Industry
- 9.3.1. Oil, Gas and Utilities
- 9.3.2. Travel and Hospitality
- 9.3.3. Healthcare
- 9.3.4. Financial Services
- 9.3.5. Manufacturing and Construction
- 9.3.6. Other End-user Industries
- 9.1. Market Analysis, Insights and Forecast - by Technology
- 10. Asia Pacific GCC ICT Market Analysis, Insights and Forecast, 2019-2031
- 10.1. Market Analysis, Insights and Forecast - by Technology
- 10.1.1. Big Data Analytics
- 10.1.2. Mobility and Telecom
- 10.1.3. Cloud Computing
- 10.1.4. Storage
- 10.1.5. Business Process Outsourcing
- 10.1.6. Other Technologies
- 10.2. Market Analysis, Insights and Forecast - by Component
- 10.2.1. Hardware/Devices
- 10.2.2. Software and Services
- 10.2.3. Communication and Connectivity
- 10.3. Market Analysis, Insights and Forecast - by End-user Industry
- 10.3.1. Oil, Gas and Utilities
- 10.3.2. Travel and Hospitality
- 10.3.3. Healthcare
- 10.3.4. Financial Services
- 10.3.5. Manufacturing and Construction
- 10.3.6. Other End-user Industries
- 10.1. Market Analysis, Insights and Forecast - by Technology
- 11. North America GCC ICT Market Analysis, Insights and Forecast, 2019-2031
- 11.1. Market Analysis, Insights and Forecast - By Country/Sub-region
- 11.1.1.
- 12. Europe GCC ICT Market Analysis, Insights and Forecast, 2019-2031
- 12.1. Market Analysis, Insights and Forecast - By Country/Sub-region
- 12.1.1.
- 13. Asia Pacific GCC ICT Market Analysis, Insights and Forecast, 2019-2031
- 13.1. Market Analysis, Insights and Forecast - By Country/Sub-region
- 13.1.1.
- 14. Latin America GCC ICT Market Analysis, Insights and Forecast, 2019-2031
- 14.1. Market Analysis, Insights and Forecast - By Country/Sub-region
- 14.1.1.
- 15. Middle East and Africa GCC ICT Market Analysis, Insights and Forecast, 2019-2031
- 15.1. Market Analysis, Insights and Forecast - By Country/Sub-region
- 15.1.1.
- 16. Competitive Analysis
- 16.1. Global Market Share Analysis 2024
- 16.2. Company Profiles
- 16.2.1 Etisalat (Emirates Telecommunication Group Company PJSC)
- 16.2.1.1. Overview
- 16.2.1.2. Products
- 16.2.1.3. SWOT Analysis
- 16.2.1.4. Recent Developments
- 16.2.1.5. Financials (Based on Availability)
- 16.2.2 Accenture PLC
- 16.2.2.1. Overview
- 16.2.2.2. Products
- 16.2.2.3. SWOT Analysis
- 16.2.2.4. Recent Developments
- 16.2.2.5. Financials (Based on Availability)
- 16.2.3 Salesforce Inc
- 16.2.3.1. Overview
- 16.2.3.2. Products
- 16.2.3.3. SWOT Analysis
- 16.2.3.4. Recent Developments
- 16.2.3.5. Financials (Based on Availability)
- 16.2.4 IBM Corporation
- 16.2.4.1. Overview
- 16.2.4.2. Products
- 16.2.4.3. SWOT Analysis
- 16.2.4.4. Recent Developments
- 16.2.4.5. Financials (Based on Availability)
- 16.2.5 Google LLC (Alphabet Inc )
- 16.2.5.1. Overview
- 16.2.5.2. Products
- 16.2.5.3. SWOT Analysis
- 16.2.5.4. Recent Developments
- 16.2.5.5. Financials (Based on Availability)
- 16.2.6 Cisco Systems Inc
- 16.2.6.1. Overview
- 16.2.6.2. Products
- 16.2.6.3. SWOT Analysis
- 16.2.6.4. Recent Developments
- 16.2.6.5. Financials (Based on Availability)
- 16.2.7 HP Inc
- 16.2.7.1. Overview
- 16.2.7.2. Products
- 16.2.7.3. SWOT Analysis
- 16.2.7.4. Recent Developments
- 16.2.7.5. Financials (Based on Availability)
- 16.2.8 Microsoft Corporation
- 16.2.8.1. Overview
- 16.2.8.2. Products
- 16.2.8.3. SWOT Analysis
- 16.2.8.4. Recent Developments
- 16.2.8.5. Financials (Based on Availability)
- 16.2.9 Huawei Investment & Holding Co Lt
- 16.2.9.1. Overview
- 16.2.9.2. Products
- 16.2.9.3. SWOT Analysis
- 16.2.9.4. Recent Developments
- 16.2.9.5. Financials (Based on Availability)
- 16.2.10 Amazon Web Services Inc (AWS)
- 16.2.10.1. Overview
- 16.2.10.2. Products
- 16.2.10.3. SWOT Analysis
- 16.2.10.4. Recent Developments
- 16.2.10.5. Financials (Based on Availability)
- 16.2.11 Oracle Corporation
- 16.2.11.1. Overview
- 16.2.11.2. Products
- 16.2.11.3. SWOT Analysis
- 16.2.11.4. Recent Developments
- 16.2.11.5. Financials (Based on Availability)
- 16.2.12 SAP SE
- 16.2.12.1. Overview
- 16.2.12.2. Products
- 16.2.12.3. SWOT Analysis
- 16.2.12.4. Recent Developments
- 16.2.12.5. Financials (Based on Availability)
- 16.2.1 Etisalat (Emirates Telecommunication Group Company PJSC)
List of Figures
- Figure 1: Global GCC ICT Market Revenue Breakdown (Million, %) by Region 2024 & 2032
- Figure 2: Global GCC ICT Market Volume Breakdown (K Unit, %) by Region 2024 & 2032
- Figure 3: North America GCC ICT Market Revenue (Million), by Country 2024 & 2032
- Figure 4: North America GCC ICT Market Volume (K Unit), by Country 2024 & 2032
- Figure 5: North America GCC ICT Market Revenue Share (%), by Country 2024 & 2032
- Figure 6: North America GCC ICT Market Volume Share (%), by Country 2024 & 2032
- Figure 7: Europe GCC ICT Market Revenue (Million), by Country 2024 & 2032
- Figure 8: Europe GCC ICT Market Volume (K Unit), by Country 2024 & 2032
- Figure 9: Europe GCC ICT Market Revenue Share (%), by Country 2024 & 2032
- Figure 10: Europe GCC ICT Market Volume Share (%), by Country 2024 & 2032
- Figure 11: Asia Pacific GCC ICT Market Revenue (Million), by Country 2024 & 2032
- Figure 12: Asia Pacific GCC ICT Market Volume (K Unit), by Country 2024 & 2032
- Figure 13: Asia Pacific GCC ICT Market Revenue Share (%), by Country 2024 & 2032
- Figure 14: Asia Pacific GCC ICT Market Volume Share (%), by Country 2024 & 2032
- Figure 15: Latin America GCC ICT Market Revenue (Million), by Country 2024 & 2032
- Figure 16: Latin America GCC ICT Market Volume (K Unit), by Country 2024 & 2032
- Figure 17: Latin America GCC ICT Market Revenue Share (%), by Country 2024 & 2032
- Figure 18: Latin America GCC ICT Market Volume Share (%), by Country 2024 & 2032
- Figure 19: Middle East and Africa GCC ICT Market Revenue (Million), by Country 2024 & 2032
- Figure 20: Middle East and Africa GCC ICT Market Volume (K Unit), by Country 2024 & 2032
- Figure 21: Middle East and Africa GCC ICT Market Revenue Share (%), by Country 2024 & 2032
- Figure 22: Middle East and Africa GCC ICT Market Volume Share (%), by Country 2024 & 2032
- Figure 23: North America GCC ICT Market Revenue (Million), by Technology 2024 & 2032
- Figure 24: North America GCC ICT Market Volume (K Unit), by Technology 2024 & 2032
- Figure 25: North America GCC ICT Market Revenue Share (%), by Technology 2024 & 2032
- Figure 26: North America GCC ICT Market Volume Share (%), by Technology 2024 & 2032
- Figure 27: North America GCC ICT Market Revenue (Million), by Component 2024 & 2032
- Figure 28: North America GCC ICT Market Volume (K Unit), by Component 2024 & 2032
- Figure 29: North America GCC ICT Market Revenue Share (%), by Component 2024 & 2032
- Figure 30: North America GCC ICT Market Volume Share (%), by Component 2024 & 2032
- Figure 31: North America GCC ICT Market Revenue (Million), by End-user Industry 2024 & 2032
- Figure 32: North America GCC ICT Market Volume (K Unit), by End-user Industry 2024 & 2032
- Figure 33: North America GCC ICT Market Revenue Share (%), by End-user Industry 2024 & 2032
- Figure 34: North America GCC ICT Market Volume Share (%), by End-user Industry 2024 & 2032
- Figure 35: North America GCC ICT Market Revenue (Million), by Country 2024 & 2032
- Figure 36: North America GCC ICT Market Volume (K Unit), by Country 2024 & 2032
- Figure 37: North America GCC ICT Market Revenue Share (%), by Country 2024 & 2032
- Figure 38: North America GCC ICT Market Volume Share (%), by Country 2024 & 2032
- Figure 39: South America GCC ICT Market Revenue (Million), by Technology 2024 & 2032
- Figure 40: South America GCC ICT Market Volume (K Unit), by Technology 2024 & 2032
- Figure 41: South America GCC ICT Market Revenue Share (%), by Technology 2024 & 2032
- Figure 42: South America GCC ICT Market Volume Share (%), by Technology 2024 & 2032
- Figure 43: South America GCC ICT Market Revenue (Million), by Component 2024 & 2032
- Figure 44: South America GCC ICT Market Volume (K Unit), by Component 2024 & 2032
- Figure 45: South America GCC ICT Market Revenue Share (%), by Component 2024 & 2032
- Figure 46: South America GCC ICT Market Volume Share (%), by Component 2024 & 2032
- Figure 47: South America GCC ICT Market Revenue (Million), by End-user Industry 2024 & 2032
- Figure 48: South America GCC ICT Market Volume (K Unit), by End-user Industry 2024 & 2032
- Figure 49: South America GCC ICT Market Revenue Share (%), by End-user Industry 2024 & 2032
- Figure 50: South America GCC ICT Market Volume Share (%), by End-user Industry 2024 & 2032
- Figure 51: South America GCC ICT Market Revenue (Million), by Country 2024 & 2032
- Figure 52: South America GCC ICT Market Volume (K Unit), by Country 2024 & 2032
- Figure 53: South America GCC ICT Market Revenue Share (%), by Country 2024 & 2032
- Figure 54: South America GCC ICT Market Volume Share (%), by Country 2024 & 2032
- Figure 55: Europe GCC ICT Market Revenue (Million), by Technology 2024 & 2032
- Figure 56: Europe GCC ICT Market Volume (K Unit), by Technology 2024 & 2032
- Figure 57: Europe GCC ICT Market Revenue Share (%), by Technology 2024 & 2032
- Figure 58: Europe GCC ICT Market Volume Share (%), by Technology 2024 & 2032
- Figure 59: Europe GCC ICT Market Revenue (Million), by Component 2024 & 2032
- Figure 60: Europe GCC ICT Market Volume (K Unit), by Component 2024 & 2032
- Figure 61: Europe GCC ICT Market Revenue Share (%), by Component 2024 & 2032
- Figure 62: Europe GCC ICT Market Volume Share (%), by Component 2024 & 2032
- Figure 63: Europe GCC ICT Market Revenue (Million), by End-user Industry 2024 & 2032
- Figure 64: Europe GCC ICT Market Volume (K Unit), by End-user Industry 2024 & 2032
- Figure 65: Europe GCC ICT Market Revenue Share (%), by End-user Industry 2024 & 2032
- Figure 66: Europe GCC ICT Market Volume Share (%), by End-user Industry 2024 & 2032
- Figure 67: Europe GCC ICT Market Revenue (Million), by Country 2024 & 2032
- Figure 68: Europe GCC ICT Market Volume (K Unit), by Country 2024 & 2032
- Figure 69: Europe GCC ICT Market Revenue Share (%), by Country 2024 & 2032
- Figure 70: Europe GCC ICT Market Volume Share (%), by Country 2024 & 2032
- Figure 71: Middle East & Africa GCC ICT Market Revenue (Million), by Technology 2024 & 2032
- Figure 72: Middle East & Africa GCC ICT Market Volume (K Unit), by Technology 2024 & 2032
- Figure 73: Middle East & Africa GCC ICT Market Revenue Share (%), by Technology 2024 & 2032
- Figure 74: Middle East & Africa GCC ICT Market Volume Share (%), by Technology 2024 & 2032
- Figure 75: Middle East & Africa GCC ICT Market Revenue (Million), by Component 2024 & 2032
- Figure 76: Middle East & Africa GCC ICT Market Volume (K Unit), by Component 2024 & 2032
- Figure 77: Middle East & Africa GCC ICT Market Revenue Share (%), by Component 2024 & 2032
- Figure 78: Middle East & Africa GCC ICT Market Volume Share (%), by Component 2024 & 2032
- Figure 79: Middle East & Africa GCC ICT Market Revenue (Million), by End-user Industry 2024 & 2032
- Figure 80: Middle East & Africa GCC ICT Market Volume (K Unit), by End-user Industry 2024 & 2032
- Figure 81: Middle East & Africa GCC ICT Market Revenue Share (%), by End-user Industry 2024 & 2032
- Figure 82: Middle East & Africa GCC ICT Market Volume Share (%), by End-user Industry 2024 & 2032
- Figure 83: Middle East & Africa GCC ICT Market Revenue (Million), by Country 2024 & 2032
- Figure 84: Middle East & Africa GCC ICT Market Volume (K Unit), by Country 2024 & 2032
- Figure 85: Middle East & Africa GCC ICT Market Revenue Share (%), by Country 2024 & 2032
- Figure 86: Middle East & Africa GCC ICT Market Volume Share (%), by Country 2024 & 2032
- Figure 87: Asia Pacific GCC ICT Market Revenue (Million), by Technology 2024 & 2032
- Figure 88: Asia Pacific GCC ICT Market Volume (K Unit), by Technology 2024 & 2032
- Figure 89: Asia Pacific GCC ICT Market Revenue Share (%), by Technology 2024 & 2032
- Figure 90: Asia Pacific GCC ICT Market Volume Share (%), by Technology 2024 & 2032
- Figure 91: Asia Pacific GCC ICT Market Revenue (Million), by Component 2024 & 2032
- Figure 92: Asia Pacific GCC ICT Market Volume (K Unit), by Component 2024 & 2032
- Figure 93: Asia Pacific GCC ICT Market Revenue Share (%), by Component 2024 & 2032
- Figure 94: Asia Pacific GCC ICT Market Volume Share (%), by Component 2024 & 2032
- Figure 95: Asia Pacific GCC ICT Market Revenue (Million), by End-user Industry 2024 & 2032
- Figure 96: Asia Pacific GCC ICT Market Volume (K Unit), by End-user Industry 2024 & 2032
- Figure 97: Asia Pacific GCC ICT Market Revenue Share (%), by End-user Industry 2024 & 2032
- Figure 98: Asia Pacific GCC ICT Market Volume Share (%), by End-user Industry 2024 & 2032
- Figure 99: Asia Pacific GCC ICT Market Revenue (Million), by Country 2024 & 2032
- Figure 100: Asia Pacific GCC ICT Market Volume (K Unit), by Country 2024 & 2032
- Figure 101: Asia Pacific GCC ICT Market Revenue Share (%), by Country 2024 & 2032
- Figure 102: Asia Pacific GCC ICT Market Volume Share (%), by Country 2024 & 2032
List of Tables
- Table 1: Global GCC ICT Market Revenue Million Forecast, by Region 2019 & 2032
- Table 2: Global GCC ICT Market Volume K Unit Forecast, by Region 2019 & 2032
- Table 3: Global GCC ICT Market Revenue Million Forecast, by Technology 2019 & 2032
- Table 4: Global GCC ICT Market Volume K Unit Forecast, by Technology 2019 & 2032
- Table 5: Global GCC ICT Market Revenue Million Forecast, by Component 2019 & 2032
- Table 6: Global GCC ICT Market Volume K Unit Forecast, by Component 2019 & 2032
- Table 7: Global GCC ICT Market Revenue Million Forecast, by End-user Industry 2019 & 2032
- Table 8: Global GCC ICT Market Volume K Unit Forecast, by End-user Industry 2019 & 2032
- Table 9: Global GCC ICT Market Revenue Million Forecast, by Region 2019 & 2032
- Table 10: Global GCC ICT Market Volume K Unit Forecast, by Region 2019 & 2032
- Table 11: Global GCC ICT Market Revenue Million Forecast, by Country 2019 & 2032
- Table 12: Global GCC ICT Market Volume K Unit Forecast, by Country 2019 & 2032
- Table 13: GCC ICT Market Revenue (Million) Forecast, by Application 2019 & 2032
- Table 14: GCC ICT Market Volume (K Unit) Forecast, by Application 2019 & 2032
- Table 15: Global GCC ICT Market Revenue Million Forecast, by Country 2019 & 2032
- Table 16: Global GCC ICT Market Volume K Unit Forecast, by Country 2019 & 2032
- Table 17: GCC ICT Market Revenue (Million) Forecast, by Application 2019 & 2032
- Table 18: GCC ICT Market Volume (K Unit) Forecast, by Application 2019 & 2032
- Table 19: Global GCC ICT Market Revenue Million Forecast, by Country 2019 & 2032
- Table 20: Global GCC ICT Market Volume K Unit Forecast, by Country 2019 & 2032
- Table 21: GCC ICT Market Revenue (Million) Forecast, by Application 2019 & 2032
- Table 22: GCC ICT Market Volume (K Unit) Forecast, by Application 2019 & 2032
- Table 23: Global GCC ICT Market Revenue Million Forecast, by Country 2019 & 2032
- Table 24: Global GCC ICT Market Volume K Unit Forecast, by Country 2019 & 2032
- Table 25: GCC ICT Market Revenue (Million) Forecast, by Application 2019 & 2032
- Table 26: GCC ICT Market Volume (K Unit) Forecast, by Application 2019 & 2032
- Table 27: Global GCC ICT Market Revenue Million Forecast, by Country 2019 & 2032
- Table 28: Global GCC ICT Market Volume K Unit Forecast, by Country 2019 & 2032
- Table 29: GCC ICT Market Revenue (Million) Forecast, by Application 2019 & 2032
- Table 30: GCC ICT Market Volume (K Unit) Forecast, by Application 2019 & 2032
- Table 31: Global GCC ICT Market Revenue Million Forecast, by Technology 2019 & 2032
- Table 32: Global GCC ICT Market Volume K Unit Forecast, by Technology 2019 & 2032
- Table 33: Global GCC ICT Market Revenue Million Forecast, by Component 2019 & 2032
- Table 34: Global GCC ICT Market Volume K Unit Forecast, by Component 2019 & 2032
- Table 35: Global GCC ICT Market Revenue Million Forecast, by End-user Industry 2019 & 2032
- Table 36: Global GCC ICT Market Volume K Unit Forecast, by End-user Industry 2019 & 2032
- Table 37: Global GCC ICT Market Revenue Million Forecast, by Country 2019 & 2032
- Table 38: Global GCC ICT Market Volume K Unit Forecast, by Country 2019 & 2032
- Table 39: United States GCC ICT Market Revenue (Million) Forecast, by Application 2019 & 2032
- Table 40: United States GCC ICT Market Volume (K Unit) Forecast, by Application 2019 & 2032
- Table 41: Canada GCC ICT Market Revenue (Million) Forecast, by Application 2019 & 2032
- Table 42: Canada GCC ICT Market Volume (K Unit) Forecast, by Application 2019 & 2032
- Table 43: Mexico GCC ICT Market Revenue (Million) Forecast, by Application 2019 & 2032
- Table 44: Mexico GCC ICT Market Volume (K Unit) Forecast, by Application 2019 & 2032
- Table 45: Global GCC ICT Market Revenue Million Forecast, by Technology 2019 & 2032
- Table 46: Global GCC ICT Market Volume K Unit Forecast, by Technology 2019 & 2032
- Table 47: Global GCC ICT Market Revenue Million Forecast, by Component 2019 & 2032
- Table 48: Global GCC ICT Market Volume K Unit Forecast, by Component 2019 & 2032
- Table 49: Global GCC ICT Market Revenue Million Forecast, by End-user Industry 2019 & 2032
- Table 50: Global GCC ICT Market Volume K Unit Forecast, by End-user Industry 2019 & 2032
- Table 51: Global GCC ICT Market Revenue Million Forecast, by Country 2019 & 2032
- Table 52: Global GCC ICT Market Volume K Unit Forecast, by Country 2019 & 2032
- Table 53: Brazil GCC ICT Market Revenue (Million) Forecast, by Application 2019 & 2032
- Table 54: Brazil GCC ICT Market Volume (K Unit) Forecast, by Application 2019 & 2032
- Table 55: Argentina GCC ICT Market Revenue (Million) Forecast, by Application 2019 & 2032
- Table 56: Argentina GCC ICT Market Volume (K Unit) Forecast, by Application 2019 & 2032
- Table 57: Rest of South America GCC ICT Market Revenue (Million) Forecast, by Application 2019 & 2032
- Table 58: Rest of South America GCC ICT Market Volume (K Unit) Forecast, by Application 2019 & 2032
- Table 59: Global GCC ICT Market Revenue Million Forecast, by Technology 2019 & 2032
- Table 60: Global GCC ICT Market Volume K Unit Forecast, by Technology 2019 & 2032
- Table 61: Global GCC ICT Market Revenue Million Forecast, by Component 2019 & 2032
- Table 62: Global GCC ICT Market Volume K Unit Forecast, by Component 2019 & 2032
- Table 63: Global GCC ICT Market Revenue Million Forecast, by End-user Industry 2019 & 2032
- Table 64: Global GCC ICT Market Volume K Unit Forecast, by End-user Industry 2019 & 2032
- Table 65: Global GCC ICT Market Revenue Million Forecast, by Country 2019 & 2032
- Table 66: Global GCC ICT Market Volume K Unit Forecast, by Country 2019 & 2032
- Table 67: United Kingdom GCC ICT Market Revenue (Million) Forecast, by Application 2019 & 2032
- Table 68: United Kingdom GCC ICT Market Volume (K Unit) Forecast, by Application 2019 & 2032
- Table 69: Germany GCC ICT Market Revenue (Million) Forecast, by Application 2019 & 2032
- Table 70: Germany GCC ICT Market Volume (K Unit) Forecast, by Application 2019 & 2032
- Table 71: France GCC ICT Market Revenue (Million) Forecast, by Application 2019 & 2032
- Table 72: France GCC ICT Market Volume (K Unit) Forecast, by Application 2019 & 2032
- Table 73: Italy GCC ICT Market Revenue (Million) Forecast, by Application 2019 & 2032
- Table 74: Italy GCC ICT Market Volume (K Unit) Forecast, by Application 2019 & 2032
- Table 75: Spain GCC ICT Market Revenue (Million) Forecast, by Application 2019 & 2032
- Table 76: Spain GCC ICT Market Volume (K Unit) Forecast, by Application 2019 & 2032
- Table 77: Russia GCC ICT Market Revenue (Million) Forecast, by Application 2019 & 2032
- Table 78: Russia GCC ICT Market Volume (K Unit) Forecast, by Application 2019 & 2032
- Table 79: Benelux GCC ICT Market Revenue (Million) Forecast, by Application 2019 & 2032
- Table 80: Benelux GCC ICT Market Volume (K Unit) Forecast, by Application 2019 & 2032
- Table 81: Nordics GCC ICT Market Revenue (Million) Forecast, by Application 2019 & 2032
- Table 82: Nordics GCC ICT Market Volume (K Unit) Forecast, by Application 2019 & 2032
- Table 83: Rest of Europe GCC ICT Market Revenue (Million) Forecast, by Application 2019 & 2032
- Table 84: Rest of Europe GCC ICT Market Volume (K Unit) Forecast, by Application 2019 & 2032
- Table 85: Global GCC ICT Market Revenue Million Forecast, by Technology 2019 & 2032
- Table 86: Global GCC ICT Market Volume K Unit Forecast, by Technology 2019 & 2032
- Table 87: Global GCC ICT Market Revenue Million Forecast, by Component 2019 & 2032
- Table 88: Global GCC ICT Market Volume K Unit Forecast, by Component 2019 & 2032
- Table 89: Global GCC ICT Market Revenue Million Forecast, by End-user Industry 2019 & 2032
- Table 90: Global GCC ICT Market Volume K Unit Forecast, by End-user Industry 2019 & 2032
- Table 91: Global GCC ICT Market Revenue Million Forecast, by Country 2019 & 2032
- Table 92: Global GCC ICT Market Volume K Unit Forecast, by Country 2019 & 2032
- Table 93: Turkey GCC ICT Market Revenue (Million) Forecast, by Application 2019 & 2032
- Table 94: Turkey GCC ICT Market Volume (K Unit) Forecast, by Application 2019 & 2032
- Table 95: Israel GCC ICT Market Revenue (Million) Forecast, by Application 2019 & 2032
- Table 96: Israel GCC ICT Market Volume (K Unit) Forecast, by Application 2019 & 2032
- Table 97: GCC GCC ICT Market Revenue (Million) Forecast, by Application 2019 & 2032
- Table 98: GCC GCC ICT Market Volume (K Unit) Forecast, by Application 2019 & 2032
- Table 99: North Africa GCC ICT Market Revenue (Million) Forecast, by Application 2019 & 2032
- Table 100: North Africa GCC ICT Market Volume (K Unit) Forecast, by Application 2019 & 2032
- Table 101: South Africa GCC ICT Market Revenue (Million) Forecast, by Application 2019 & 2032
- Table 102: South Africa GCC ICT Market Volume (K Unit) Forecast, by Application 2019 & 2032
- Table 103: Rest of Middle East & Africa GCC ICT Market Revenue (Million) Forecast, by Application 2019 & 2032
- Table 104: Rest of Middle East & Africa GCC ICT Market Volume (K Unit) Forecast, by Application 2019 & 2032
- Table 105: Global GCC ICT Market Revenue Million Forecast, by Technology 2019 & 2032
- Table 106: Global GCC ICT Market Volume K Unit Forecast, by Technology 2019 & 2032
- Table 107: Global GCC ICT Market Revenue Million Forecast, by Component 2019 & 2032
- Table 108: Global GCC ICT Market Volume K Unit Forecast, by Component 2019 & 2032
- Table 109: Global GCC ICT Market Revenue Million Forecast, by End-user Industry 2019 & 2032
- Table 110: Global GCC ICT Market Volume K Unit Forecast, by End-user Industry 2019 & 2032
- Table 111: Global GCC ICT Market Revenue Million Forecast, by Country 2019 & 2032
- Table 112: Global GCC ICT Market Volume K Unit Forecast, by Country 2019 & 2032
- Table 113: China GCC ICT Market Revenue (Million) Forecast, by Application 2019 & 2032
- Table 114: China GCC ICT Market Volume (K Unit) Forecast, by Application 2019 & 2032
- Table 115: India GCC ICT Market Revenue (Million) Forecast, by Application 2019 & 2032
- Table 116: India GCC ICT Market Volume (K Unit) Forecast, by Application 2019 & 2032
- Table 117: Japan GCC ICT Market Revenue (Million) Forecast, by Application 2019 & 2032
- Table 118: Japan GCC ICT Market Volume (K Unit) Forecast, by Application 2019 & 2032
- Table 119: South Korea GCC ICT Market Revenue (Million) Forecast, by Application 2019 & 2032
- Table 120: South Korea GCC ICT Market Volume (K Unit) Forecast, by Application 2019 & 2032
- Table 121: ASEAN GCC ICT Market Revenue (Million) Forecast, by Application 2019 & 2032
- Table 122: ASEAN GCC ICT Market Volume (K Unit) Forecast, by Application 2019 & 2032
- Table 123: Oceania GCC ICT Market Revenue (Million) Forecast, by Application 2019 & 2032
- Table 124: Oceania GCC ICT Market Volume (K Unit) Forecast, by Application 2019 & 2032
- Table 125: Rest of Asia Pacific GCC ICT Market Revenue (Million) Forecast, by Application 2019 & 2032
- Table 126: Rest of Asia Pacific GCC ICT Market Volume (K Unit) Forecast, by Application 2019 & 2032
Frequently Asked Questions
1. What is the projected Compound Annual Growth Rate (CAGR) of the GCC ICT Market?
The projected CAGR is approximately 9.49%.
2. Which companies are prominent players in the GCC ICT Market?
Key companies in the market include Etisalat (Emirates Telecommunication Group Company PJSC), Accenture PLC, Salesforce Inc, IBM Corporation, Google LLC (Alphabet Inc ), Cisco Systems Inc, HP Inc, Microsoft Corporation, Huawei Investment & Holding Co Lt, Amazon Web Services Inc (AWS), Oracle Corporation, SAP SE.
3. What are the main segments of the GCC ICT Market?
The market segments include Technology, Component, End-user Industry.
4. Can you provide details about the market size?
The market size is estimated to be USD 129.07 Million as of 2022.
5. What are some drivers contributing to market growth?
Ongoing Events and Tourism Demanding Automation; Government Policies and PPP Initiatives; Rising Digital Transformation in the Industries.
6. What are the notable trends driving market growth?
Oil. Gas. and Utilities to Witness Major Growth.
7. Are there any restraints impacting market growth?
High Dependence on External Sources to Balance the Skill Deficit; Heavy Dependence on the Oil and Gas Sector.
8. Can you provide examples of recent developments in the market?
November 2023 - Sharjah Electricity, Water and Gas Authority (SEWA) declared its successful digital transformation powered by global technology company SAP SE. By applying a comprehensive portfolio of SAP solutions involving HR management, enterprise resource planning (ERP), and industry-specific applications, SEWA would automate business processes, maximize visibility and efficiencies over all the key areas of operations, and augment services to customers, employees, and partners.
9. What pricing options are available for accessing the report?
Pricing options include single-user, multi-user, and enterprise licenses priced at USD 3800, USD 4500, and USD 5800 respectively.
10. Is the market size provided in terms of value or volume?
The market size is provided in terms of value, measured in Million and volume, measured in K Unit.
11. Are there any specific market keywords associated with the report?
Yes, the market keyword associated with the report is "GCC ICT Market," which aids in identifying and referencing the specific market segment covered.
12. How do I determine which pricing option suits my needs best?
The pricing options vary based on user requirements and access needs. Individual users may opt for single-user licenses, while businesses requiring broader access may choose multi-user or enterprise licenses for cost-effective access to the report.
13. Are there any additional resources or data provided in the GCC ICT Market report?
While the report offers comprehensive insights, it's advisable to review the specific contents or supplementary materials provided to ascertain if additional resources or data are available.
14. How can I stay updated on further developments or reports in the GCC ICT Market?
To stay informed about further developments, trends, and reports in the GCC ICT Market, consider subscribing to industry newsletters, following relevant companies and organizations, or regularly checking reputable industry news sources and publications.
Methodology
Step 1 - Identification of Relevant Samples Size from Population Database


Step 2 - Approaches for Defining Global Market Size (Value, Volume* & Price*)

Note*: In applicable scenarios
Step 3 - Data Sources
Primary Research
- Web Analytics
- Survey Reports
- Research Institute
- Latest Research Reports
- Opinion Leaders
Secondary Research
- Annual Reports
- White Paper
- Latest Press Release
- Industry Association
- Paid Database
- Investor Presentations

Step 4 - Data Triangulation
Involves using different sources of information in order to increase the validity of a study
These sources are likely to be stakeholders in a program - participants, other researchers, program staff, other community members, and so on.
Then we put all data in single framework & apply various statistical tools to find out the dynamic on the market.
During the analysis stage, feedback from the stakeholder groups would be compared to determine areas of agreement as well as areas of divergence


