
Key Insights
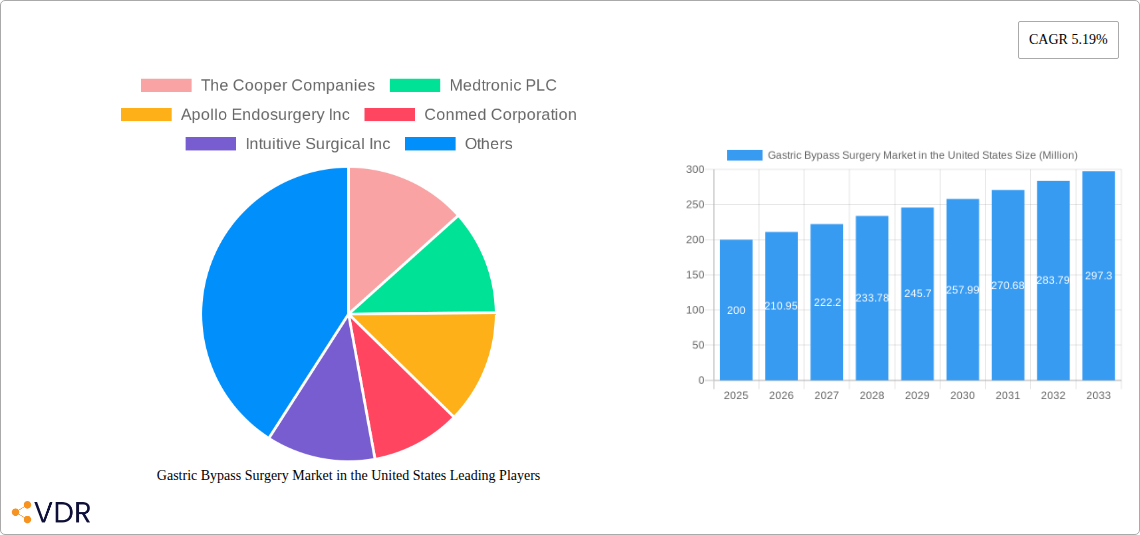
The Gastric Bypass Surgery Market in the United States, a significant segment of the global bariatric surgery landscape, is experiencing robust growth. With a global market size of $0.85 billion in 2025 and a Compound Annual Growth Rate (CAGR) of 5.19%, the US market, representing a substantial portion of this global figure, is projected to witness a similar trajectory. Several factors drive this expansion. Increasing prevalence of obesity and related comorbidities like type 2 diabetes and cardiovascular disease fuels the demand for effective weight-loss solutions. Technological advancements in minimally invasive surgical techniques, such as laparoscopic and robotic-assisted procedures, contribute to faster recovery times and improved patient outcomes, further boosting market growth. The increasing number of specialized weight-loss centers and hospitals equipped to perform these complex surgeries also plays a crucial role. Furthermore, rising awareness campaigns promoting healthy lifestyles and the benefits of bariatric surgery contribute to increased patient demand. However, factors like the high cost of the procedure and potential long-term complications can act as restraints.
Despite these challenges, the market's future outlook remains positive. The increasing acceptance of bariatric surgery as a viable treatment option, coupled with ongoing research and development in surgical techniques and devices, will likely sustain the market's growth momentum. The segment of implantable devices, used in certain advanced surgical procedures, is poised for particularly rapid growth due to its potential for improved long-term outcomes. Hospitals and specialized weight-loss centers will continue to be the primary end-users. Major players like Medtronic, Johnson & Johnson, and Intuitive Surgical are expected to maintain their market share through innovation and strategic partnerships, while emerging companies focused on new technologies and minimally invasive approaches could disrupt the market in the coming years. The focus will increasingly shift towards personalized medicine and patient-specific treatment plans, ensuring optimized outcomes and long-term health management.
Gastric Bypass Surgery Market in the United States: A Comprehensive Report (2019-2033)
This in-depth report provides a comprehensive analysis of the Gastric Bypass Surgery Market in the United States, encompassing market dynamics, growth trends, regional analysis, product landscape, key players, and future outlook. The report covers the parent market of Bariatric Surgery and the child market of Gastric Bypass Surgery, offering a granular view of this vital sector within the healthcare industry. The study period spans from 2019 to 2033, with 2025 serving as the base and estimated year. The forecast period extends from 2025 to 2033, while the historical period covers 2019-2024. Market values are presented in million units.
Gastric Bypass Surgery Market in the United States Market Dynamics & Structure
This section analyzes the competitive landscape, technological advancements, regulatory influences, and market trends within the US Gastric Bypass Surgery market. We examine market concentration, revealing the market share held by key players, and assess the impact of mergers and acquisitions (M&A) activities. Technological innovation drivers, such as advancements in minimally invasive surgical techniques and device technology, are explored in detail. Regulatory frameworks, including FDA approvals and reimbursement policies, are evaluated for their influence on market growth. The analysis also considers the presence of competitive substitutes and their impact on market dynamics. Finally, end-user demographics—including age, BMI, and geographic distribution—are analyzed to understand market demand.
- Market Concentration: The market is moderately concentrated, with the top 5 players holding approximately xx% market share in 2024.
- M&A Activity: An estimated xx M&A deals occurred within the bariatric surgery device sector between 2019 and 2024.
- Innovation Barriers: High regulatory hurdles and significant capital investment requirements pose challenges to innovation.
- Technological Drivers: Minimally invasive techniques and advanced imaging technologies are key growth drivers.
- Regulatory Landscape: FDA approvals and reimbursement policies significantly impact market access and growth.
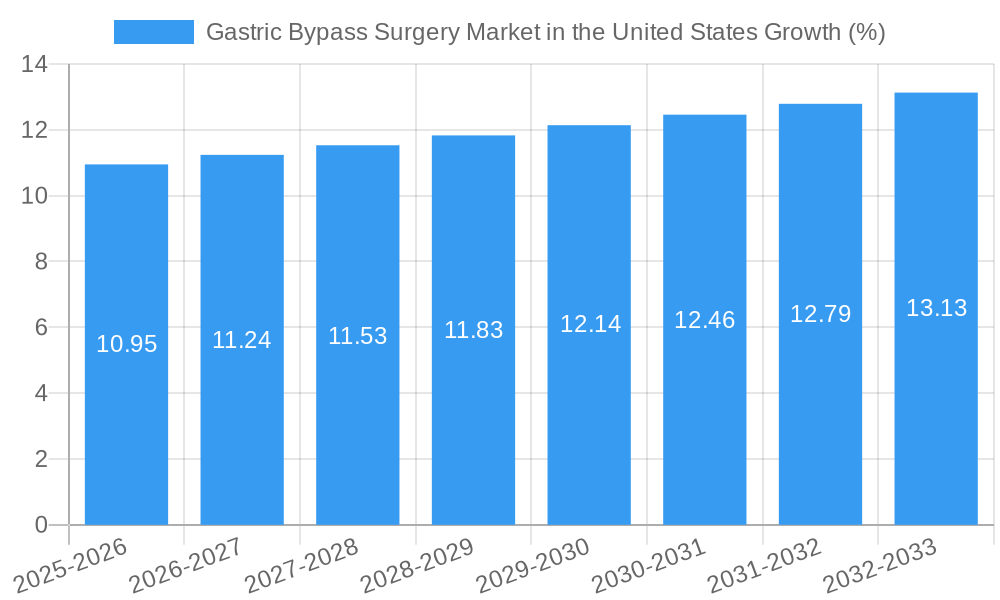
Gastric Bypass Surgery Market in the United States Growth Trends & Insights
This section details the historical and projected growth of the US Gastric Bypass Surgery market. Using rigorous data analysis, we present the market size evolution from 2019 to 2024 and project it to 2033. We analyze adoption rates across different demographics and geographic regions, examining the influence of technological disruptions, such as robotic-assisted surgery, and shifts in consumer behavior, including increasing awareness of obesity-related health risks.
- Market Size (2024): xx Million USD
- Projected Market Size (2033): xx Million USD
- CAGR (2025-2033): xx%
- Market Penetration: xx% in 2024, projected to reach xx% by 2033.
- Key Growth Drivers: Increasing prevalence of obesity, advancements in surgical techniques, and rising healthcare expenditure.
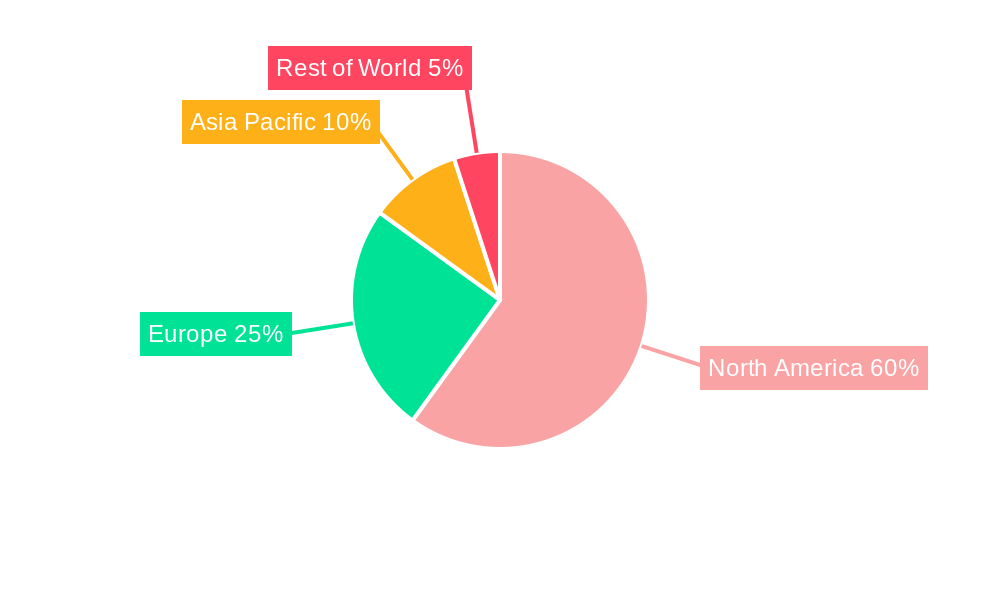
Dominant Regions, Countries, or Segments in Gastric Bypass Surgery Market in the United States
This section identifies the leading geographical regions and market segments within the US Gastric Bypass Surgery market. We analyze the factors driving growth in these dominant areas, including economic factors, healthcare infrastructure, and regional disparities in obesity prevalence. Detailed market share data and growth potential projections are provided for each segment (Device: Assisting Devices, Other Assisting Devices, Implantable Devices; End-Use: Hospitals, Clinics, Specialty Centers).
- Leading Segment: Hospitals account for the largest market share due to their advanced infrastructure and established surgical capabilities.
- Fastest Growing Segment: Specialty Centers are expected to experience the fastest growth due to rising demand for specialized bariatric care.
- Key Drivers by Segment:
- Hospitals: High surgical volume, established infrastructure.
- Clinics: Convenient access and increasing number of specialized clinics.
- Specialty Centers: Focus on comprehensive weight loss programs.
- Geographic Dominance: The Northeast and West Coast regions are expected to retain the highest market share due to high obesity prevalence and access to advanced healthcare facilities.
Gastric Bypass Surgery Market in the United States Product Landscape
This section provides a detailed overview of the product landscape, focusing on technological advancements, applications, and performance metrics of devices used in gastric bypass surgery. We highlight the unique selling propositions (USPs) of leading products and analyze their performance characteristics.
Recent product innovations include advancements in minimally invasive surgical instruments, improved implant designs, and the development of advanced energy devices. These improvements enhance surgical precision, reduce complications, and improve patient outcomes. The market is seeing a shift towards less-invasive techniques and improved patient recovery times.
Key Drivers, Barriers & Challenges in Gastric Bypass Surgery Market in the United States
Key Drivers: Increasing prevalence of obesity and related comorbidities, advancements in surgical techniques (minimally invasive procedures, robotic surgery), rising healthcare expenditure, and increased insurance coverage for bariatric surgery are key drivers.
Key Barriers and Challenges: High procedure costs, limited insurance coverage in some areas, potential complications, post-operative care requirements, the need for lifestyle changes, and the availability of skilled surgeons. Competition among existing players and the potential entry of new players add to the complexity. These challenges could result in a xx% reduction in market growth if not addressed effectively.
Emerging Opportunities in Gastric Bypass Surgery Market in the United States
Emerging opportunities include the expansion into underserved markets, development of innovative minimally invasive techniques, and growth in personalized medicine approaches. The increasing focus on patient education and post-operative support programs also presents significant growth prospects.
Growth Accelerators in the Gastric Bypass Surgery Market in the United States Industry
Technological breakthroughs in robotic surgery and minimally invasive techniques are key growth accelerators. Strategic partnerships between device manufacturers and healthcare providers to improve access to care and promote these procedures also drive growth. The expansion of bariatric surgery centers and the growing adoption of telehealth for remote monitoring are also playing a significant role.
Key Players Shaping the Gastric Bypass Surgery Market in the United States Market
- The Cooper Companies
- Medtronic PLC
- Apollo Endosurgery Inc
- Conmed Corporation
- Intuitive Surgical Inc
- B Braun Melsungen AG
- Johnson and Johnson (Ethicon Inc)
- Olympus Corporation
- Aspire Bariatrics Inc
Notable Milestones in Gastric Bypass Surgery Market in the United States Sector
- September 2021: Olympus launched the POWERSEAL advanced bipolar surgical energy devices, strengthening its surgical portfolio and expanding applications in bariatric procedures.
- June 2021: Ethicon (Johnson & Johnson) launched the ENSEAL X1 Curved Jaw Tissue Sealer, enhancing capabilities for bariatric surgery among other procedures.
In-Depth Gastric Bypass Surgery Market in the United States Market Outlook
The US Gastric Bypass Surgery market is poised for significant growth, driven by technological advancements, increasing obesity rates, and expanded access to care. Strategic partnerships, investments in research and development, and a focus on minimally invasive techniques will shape the future of this market. The continued development of innovative devices, coupled with a greater understanding of patient needs and preferences, will drive market expansion and improve patient outcomes over the forecast period.
Gastric Bypass Surgery Market in the United States Segmentation
-
1. Device
-
1.1. Assisting Devices
- 1.1.1. Suturing Device
- 1.1.2. Closure Device
- 1.1.3. Stapling Device
- 1.1.4. Trocars
- 1.1.5. Other Assisting Devices
-
1.2. Implantable Devices
- 1.2.1. Gastric Bands
- 1.2.2. Electrical Stimulation Devices
- 1.2.3. Gastric Balloons
- 1.2.4. Gastric Emptying
- 1.2.5. Other Devices
-
1.1. Assisting Devices
Gastric Bypass Surgery Market in the United States Segmentation By Geography
-
1. North America
- 1.1. United States
- 1.2. Canada
- 1.3. Mexico
-
2. South America
- 2.1. Brazil
- 2.2. Argentina
- 2.3. Rest of South America
-
3. Europe
- 3.1. United Kingdom
- 3.2. Germany
- 3.3. France
- 3.4. Italy
- 3.5. Spain
- 3.6. Russia
- 3.7. Benelux
- 3.8. Nordics
- 3.9. Rest of Europe
-
4. Middle East & Africa
- 4.1. Turkey
- 4.2. Israel
- 4.3. GCC
- 4.4. North Africa
- 4.5. South Africa
- 4.6. Rest of Middle East & Africa
-
5. Asia Pacific
- 5.1. China
- 5.2. India
- 5.3. Japan
- 5.4. South Korea
- 5.5. ASEAN
- 5.6. Oceania
- 5.7. Rest of Asia Pacific
Gastric Bypass Surgery Market in the United States REPORT HIGHLIGHTS
| Aspects | Details |
|---|---|
| Study Period | 2019-2033 |
| Base Year | 2024 |
| Estimated Year | 2025 |
| Forecast Period | 2025-2033 |
| Historical Period | 2019-2024 |
| Growth Rate | CAGR of 5.19% from 2019-2033 |
| Segmentation |
|
Table of Contents
- 1. Introduction
- 1.1. Research Scope
- 1.2. Market Segmentation
- 1.3. Research Methodology
- 1.4. Definitions and Assumptions
- 2. Executive Summary
- 2.1. Introduction
- 3. Market Dynamics
- 3.1. Introduction
- 3.2. Market Drivers
- 3.2.1. Increase in Obesity Patients; Rising Prevalence Rate of Type 2 Diabetes and Heart Diseases; Growing Government Initiatives to Curb Obesity
- 3.3. Market Restrains
- 3.3.1. High Cost of Surgery
- 3.4. Market Trends
- 3.4.1. Closure Device Segment is Expected to Register a High CAGR in the Assisting Device Segment
- 4. Market Factor Analysis
- 4.1. Porters Five Forces
- 4.2. Supply/Value Chain
- 4.3. PESTEL analysis
- 4.4. Market Entropy
- 4.5. Patent/Trademark Analysis
- 5. Global Gastric Bypass Surgery Market in the United States Analysis, Insights and Forecast, 2019-2031
- 5.1. Market Analysis, Insights and Forecast - by Device
- 5.1.1. Assisting Devices
- 5.1.1.1. Suturing Device
- 5.1.1.2. Closure Device
- 5.1.1.3. Stapling Device
- 5.1.1.4. Trocars
- 5.1.1.5. Other Assisting Devices
- 5.1.2. Implantable Devices
- 5.1.2.1. Gastric Bands
- 5.1.2.2. Electrical Stimulation Devices
- 5.1.2.3. Gastric Balloons
- 5.1.2.4. Gastric Emptying
- 5.1.2.5. Other Devices
- 5.1.1. Assisting Devices
- 5.2. Market Analysis, Insights and Forecast - by Region
- 5.2.1. North America
- 5.2.2. South America
- 5.2.3. Europe
- 5.2.4. Middle East & Africa
- 5.2.5. Asia Pacific
- 5.1. Market Analysis, Insights and Forecast - by Device
- 6. North America Gastric Bypass Surgery Market in the United States Analysis, Insights and Forecast, 2019-2031
- 6.1. Market Analysis, Insights and Forecast - by Device
- 6.1.1. Assisting Devices
- 6.1.1.1. Suturing Device
- 6.1.1.2. Closure Device
- 6.1.1.3. Stapling Device
- 6.1.1.4. Trocars
- 6.1.1.5. Other Assisting Devices
- 6.1.2. Implantable Devices
- 6.1.2.1. Gastric Bands
- 6.1.2.2. Electrical Stimulation Devices
- 6.1.2.3. Gastric Balloons
- 6.1.2.4. Gastric Emptying
- 6.1.2.5. Other Devices
- 6.1.1. Assisting Devices
- 6.1. Market Analysis, Insights and Forecast - by Device
- 7. South America Gastric Bypass Surgery Market in the United States Analysis, Insights and Forecast, 2019-2031
- 7.1. Market Analysis, Insights and Forecast - by Device
- 7.1.1. Assisting Devices
- 7.1.1.1. Suturing Device
- 7.1.1.2. Closure Device
- 7.1.1.3. Stapling Device
- 7.1.1.4. Trocars
- 7.1.1.5. Other Assisting Devices
- 7.1.2. Implantable Devices
- 7.1.2.1. Gastric Bands
- 7.1.2.2. Electrical Stimulation Devices
- 7.1.2.3. Gastric Balloons
- 7.1.2.4. Gastric Emptying
- 7.1.2.5. Other Devices
- 7.1.1. Assisting Devices
- 7.1. Market Analysis, Insights and Forecast - by Device
- 8. Europe Gastric Bypass Surgery Market in the United States Analysis, Insights and Forecast, 2019-2031
- 8.1. Market Analysis, Insights and Forecast - by Device
- 8.1.1. Assisting Devices
- 8.1.1.1. Suturing Device
- 8.1.1.2. Closure Device
- 8.1.1.3. Stapling Device
- 8.1.1.4. Trocars
- 8.1.1.5. Other Assisting Devices
- 8.1.2. Implantable Devices
- 8.1.2.1. Gastric Bands
- 8.1.2.2. Electrical Stimulation Devices
- 8.1.2.3. Gastric Balloons
- 8.1.2.4. Gastric Emptying
- 8.1.2.5. Other Devices
- 8.1.1. Assisting Devices
- 8.1. Market Analysis, Insights and Forecast - by Device
- 9. Middle East & Africa Gastric Bypass Surgery Market in the United States Analysis, Insights and Forecast, 2019-2031
- 9.1. Market Analysis, Insights and Forecast - by Device
- 9.1.1. Assisting Devices
- 9.1.1.1. Suturing Device
- 9.1.1.2. Closure Device
- 9.1.1.3. Stapling Device
- 9.1.1.4. Trocars
- 9.1.1.5. Other Assisting Devices
- 9.1.2. Implantable Devices
- 9.1.2.1. Gastric Bands
- 9.1.2.2. Electrical Stimulation Devices
- 9.1.2.3. Gastric Balloons
- 9.1.2.4. Gastric Emptying
- 9.1.2.5. Other Devices
- 9.1.1. Assisting Devices
- 9.1. Market Analysis, Insights and Forecast - by Device
- 10. Asia Pacific Gastric Bypass Surgery Market in the United States Analysis, Insights and Forecast, 2019-2031
- 10.1. Market Analysis, Insights and Forecast - by Device
- 10.1.1. Assisting Devices
- 10.1.1.1. Suturing Device
- 10.1.1.2. Closure Device
- 10.1.1.3. Stapling Device
- 10.1.1.4. Trocars
- 10.1.1.5. Other Assisting Devices
- 10.1.2. Implantable Devices
- 10.1.2.1. Gastric Bands
- 10.1.2.2. Electrical Stimulation Devices
- 10.1.2.3. Gastric Balloons
- 10.1.2.4. Gastric Emptying
- 10.1.2.5. Other Devices
- 10.1.1. Assisting Devices
- 10.1. Market Analysis, Insights and Forecast - by Device
- 11. North America Gastric Bypass Surgery Market in the United States Analysis, Insights and Forecast, 2019-2031
- 11.1. Market Analysis, Insights and Forecast - By Country/Sub-region
- 11.1.1 United States
- 11.1.2 Canada
- 11.1.3 Mexico
- 12. Europe Gastric Bypass Surgery Market in the United States Analysis, Insights and Forecast, 2019-2031
- 12.1. Market Analysis, Insights and Forecast - By Country/Sub-region
- 12.1.1 Germany
- 12.1.2 United Kingdom
- 12.1.3 France
- 12.1.4 Italy
- 12.1.5 Spain
- 12.1.6 Rest of Europe
- 13. Asia Pacific Gastric Bypass Surgery Market in the United States Analysis, Insights and Forecast, 2019-2031
- 13.1. Market Analysis, Insights and Forecast - By Country/Sub-region
- 13.1.1 China
- 13.1.2 Japan
- 13.1.3 India
- 13.1.4 Australia
- 13.1.5 South Korea
- 13.1.6 Rest of Asia Pacific
- 14. Middle East and Africa Gastric Bypass Surgery Market in the United States Analysis, Insights and Forecast, 2019-2031
- 14.1. Market Analysis, Insights and Forecast - By Country/Sub-region
- 14.1.1 GCC
- 14.1.2 South Africa
- 14.1.3 Rest of Middle East and Africa
- 15. South America Gastric Bypass Surgery Market in the United States Analysis, Insights and Forecast, 2019-2031
- 15.1. Market Analysis, Insights and Forecast - By Country/Sub-region
- 15.1.1 Brazil
- 15.1.2 Argentina
- 15.1.3 Rest of South America
- 16. Competitive Analysis
- 16.1. Global Market Share Analysis 2024
- 16.2. Company Profiles
- 16.2.1 The Cooper Companies
- 16.2.1.1. Overview
- 16.2.1.2. Products
- 16.2.1.3. SWOT Analysis
- 16.2.1.4. Recent Developments
- 16.2.1.5. Financials (Based on Availability)
- 16.2.2 Medtronic PLC
- 16.2.2.1. Overview
- 16.2.2.2. Products
- 16.2.2.3. SWOT Analysis
- 16.2.2.4. Recent Developments
- 16.2.2.5. Financials (Based on Availability)
- 16.2.3 Apollo Endosurgery Inc
- 16.2.3.1. Overview
- 16.2.3.2. Products
- 16.2.3.3. SWOT Analysis
- 16.2.3.4. Recent Developments
- 16.2.3.5. Financials (Based on Availability)
- 16.2.4 Conmed Corporation
- 16.2.4.1. Overview
- 16.2.4.2. Products
- 16.2.4.3. SWOT Analysis
- 16.2.4.4. Recent Developments
- 16.2.4.5. Financials (Based on Availability)
- 16.2.5 Intuitive Surgical Inc
- 16.2.5.1. Overview
- 16.2.5.2. Products
- 16.2.5.3. SWOT Analysis
- 16.2.5.4. Recent Developments
- 16.2.5.5. Financials (Based on Availability)
- 16.2.6 B Braun Melsungen AG
- 16.2.6.1. Overview
- 16.2.6.2. Products
- 16.2.6.3. SWOT Analysis
- 16.2.6.4. Recent Developments
- 16.2.6.5. Financials (Based on Availability)
- 16.2.7 Johnson and Johnson (Ethicon Inc)
- 16.2.7.1. Overview
- 16.2.7.2. Products
- 16.2.7.3. SWOT Analysis
- 16.2.7.4. Recent Developments
- 16.2.7.5. Financials (Based on Availability)
- 16.2.8 Olympus Corporation
- 16.2.8.1. Overview
- 16.2.8.2. Products
- 16.2.8.3. SWOT Analysis
- 16.2.8.4. Recent Developments
- 16.2.8.5. Financials (Based on Availability)
- 16.2.9 Aspire Bariatrics Inc
- 16.2.9.1. Overview
- 16.2.9.2. Products
- 16.2.9.3. SWOT Analysis
- 16.2.9.4. Recent Developments
- 16.2.9.5. Financials (Based on Availability)
- 16.2.1 The Cooper Companies
List of Figures
- Figure 1: Global Gastric Bypass Surgery Market in the United States Revenue Breakdown (Million, %) by Region 2024 & 2032
- Figure 2: Global Gastric Bypass Surgery Market in the United States Volume Breakdown (K Unit, %) by Region 2024 & 2032
- Figure 3: North America Gastric Bypass Surgery Market in the United States Revenue (Million), by Country 2024 & 2032
- Figure 4: North America Gastric Bypass Surgery Market in the United States Volume (K Unit), by Country 2024 & 2032
- Figure 5: North America Gastric Bypass Surgery Market in the United States Revenue Share (%), by Country 2024 & 2032
- Figure 6: North America Gastric Bypass Surgery Market in the United States Volume Share (%), by Country 2024 & 2032
- Figure 7: Europe Gastric Bypass Surgery Market in the United States Revenue (Million), by Country 2024 & 2032
- Figure 8: Europe Gastric Bypass Surgery Market in the United States Volume (K Unit), by Country 2024 & 2032
- Figure 9: Europe Gastric Bypass Surgery Market in the United States Revenue Share (%), by Country 2024 & 2032
- Figure 10: Europe Gastric Bypass Surgery Market in the United States Volume Share (%), by Country 2024 & 2032
- Figure 11: Asia Pacific Gastric Bypass Surgery Market in the United States Revenue (Million), by Country 2024 & 2032
- Figure 12: Asia Pacific Gastric Bypass Surgery Market in the United States Volume (K Unit), by Country 2024 & 2032
- Figure 13: Asia Pacific Gastric Bypass Surgery Market in the United States Revenue Share (%), by Country 2024 & 2032
- Figure 14: Asia Pacific Gastric Bypass Surgery Market in the United States Volume Share (%), by Country 2024 & 2032
- Figure 15: Middle East and Africa Gastric Bypass Surgery Market in the United States Revenue (Million), by Country 2024 & 2032
- Figure 16: Middle East and Africa Gastric Bypass Surgery Market in the United States Volume (K Unit), by Country 2024 & 2032
- Figure 17: Middle East and Africa Gastric Bypass Surgery Market in the United States Revenue Share (%), by Country 2024 & 2032
- Figure 18: Middle East and Africa Gastric Bypass Surgery Market in the United States Volume Share (%), by Country 2024 & 2032
- Figure 19: South America Gastric Bypass Surgery Market in the United States Revenue (Million), by Country 2024 & 2032
- Figure 20: South America Gastric Bypass Surgery Market in the United States Volume (K Unit), by Country 2024 & 2032
- Figure 21: South America Gastric Bypass Surgery Market in the United States Revenue Share (%), by Country 2024 & 2032
- Figure 22: South America Gastric Bypass Surgery Market in the United States Volume Share (%), by Country 2024 & 2032
- Figure 23: North America Gastric Bypass Surgery Market in the United States Revenue (Million), by Device 2024 & 2032
- Figure 24: North America Gastric Bypass Surgery Market in the United States Volume (K Unit), by Device 2024 & 2032
- Figure 25: North America Gastric Bypass Surgery Market in the United States Revenue Share (%), by Device 2024 & 2032
- Figure 26: North America Gastric Bypass Surgery Market in the United States Volume Share (%), by Device 2024 & 2032
- Figure 27: North America Gastric Bypass Surgery Market in the United States Revenue (Million), by Country 2024 & 2032
- Figure 28: North America Gastric Bypass Surgery Market in the United States Volume (K Unit), by Country 2024 & 2032
- Figure 29: North America Gastric Bypass Surgery Market in the United States Revenue Share (%), by Country 2024 & 2032
- Figure 30: North America Gastric Bypass Surgery Market in the United States Volume Share (%), by Country 2024 & 2032
- Figure 31: South America Gastric Bypass Surgery Market in the United States Revenue (Million), by Device 2024 & 2032
- Figure 32: South America Gastric Bypass Surgery Market in the United States Volume (K Unit), by Device 2024 & 2032
- Figure 33: South America Gastric Bypass Surgery Market in the United States Revenue Share (%), by Device 2024 & 2032
- Figure 34: South America Gastric Bypass Surgery Market in the United States Volume Share (%), by Device 2024 & 2032
- Figure 35: South America Gastric Bypass Surgery Market in the United States Revenue (Million), by Country 2024 & 2032
- Figure 36: South America Gastric Bypass Surgery Market in the United States Volume (K Unit), by Country 2024 & 2032
- Figure 37: South America Gastric Bypass Surgery Market in the United States Revenue Share (%), by Country 2024 & 2032
- Figure 38: South America Gastric Bypass Surgery Market in the United States Volume Share (%), by Country 2024 & 2032
- Figure 39: Europe Gastric Bypass Surgery Market in the United States Revenue (Million), by Device 2024 & 2032
- Figure 40: Europe Gastric Bypass Surgery Market in the United States Volume (K Unit), by Device 2024 & 2032
- Figure 41: Europe Gastric Bypass Surgery Market in the United States Revenue Share (%), by Device 2024 & 2032
- Figure 42: Europe Gastric Bypass Surgery Market in the United States Volume Share (%), by Device 2024 & 2032
- Figure 43: Europe Gastric Bypass Surgery Market in the United States Revenue (Million), by Country 2024 & 2032
- Figure 44: Europe Gastric Bypass Surgery Market in the United States Volume (K Unit), by Country 2024 & 2032
- Figure 45: Europe Gastric Bypass Surgery Market in the United States Revenue Share (%), by Country 2024 & 2032
- Figure 46: Europe Gastric Bypass Surgery Market in the United States Volume Share (%), by Country 2024 & 2032
- Figure 47: Middle East & Africa Gastric Bypass Surgery Market in the United States Revenue (Million), by Device 2024 & 2032
- Figure 48: Middle East & Africa Gastric Bypass Surgery Market in the United States Volume (K Unit), by Device 2024 & 2032
- Figure 49: Middle East & Africa Gastric Bypass Surgery Market in the United States Revenue Share (%), by Device 2024 & 2032
- Figure 50: Middle East & Africa Gastric Bypass Surgery Market in the United States Volume Share (%), by Device 2024 & 2032
- Figure 51: Middle East & Africa Gastric Bypass Surgery Market in the United States Revenue (Million), by Country 2024 & 2032
- Figure 52: Middle East & Africa Gastric Bypass Surgery Market in the United States Volume (K Unit), by Country 2024 & 2032
- Figure 53: Middle East & Africa Gastric Bypass Surgery Market in the United States Revenue Share (%), by Country 2024 & 2032
- Figure 54: Middle East & Africa Gastric Bypass Surgery Market in the United States Volume Share (%), by Country 2024 & 2032
- Figure 55: Asia Pacific Gastric Bypass Surgery Market in the United States Revenue (Million), by Device 2024 & 2032
- Figure 56: Asia Pacific Gastric Bypass Surgery Market in the United States Volume (K Unit), by Device 2024 & 2032
- Figure 57: Asia Pacific Gastric Bypass Surgery Market in the United States Revenue Share (%), by Device 2024 & 2032
- Figure 58: Asia Pacific Gastric Bypass Surgery Market in the United States Volume Share (%), by Device 2024 & 2032
- Figure 59: Asia Pacific Gastric Bypass Surgery Market in the United States Revenue (Million), by Country 2024 & 2032
- Figure 60: Asia Pacific Gastric Bypass Surgery Market in the United States Volume (K Unit), by Country 2024 & 2032
- Figure 61: Asia Pacific Gastric Bypass Surgery Market in the United States Revenue Share (%), by Country 2024 & 2032
- Figure 62: Asia Pacific Gastric Bypass Surgery Market in the United States Volume Share (%), by Country 2024 & 2032
List of Tables
- Table 1: Global Gastric Bypass Surgery Market in the United States Revenue Million Forecast, by Region 2019 & 2032
- Table 2: Global Gastric Bypass Surgery Market in the United States Volume K Unit Forecast, by Region 2019 & 2032
- Table 3: Global Gastric Bypass Surgery Market in the United States Revenue Million Forecast, by Device 2019 & 2032
- Table 4: Global Gastric Bypass Surgery Market in the United States Volume K Unit Forecast, by Device 2019 & 2032
- Table 5: Global Gastric Bypass Surgery Market in the United States Revenue Million Forecast, by Region 2019 & 2032
- Table 6: Global Gastric Bypass Surgery Market in the United States Volume K Unit Forecast, by Region 2019 & 2032
- Table 7: Global Gastric Bypass Surgery Market in the United States Revenue Million Forecast, by Country 2019 & 2032
- Table 8: Global Gastric Bypass Surgery Market in the United States Volume K Unit Forecast, by Country 2019 & 2032
- Table 9: United States Gastric Bypass Surgery Market in the United States Revenue (Million) Forecast, by Application 2019 & 2032
- Table 10: United States Gastric Bypass Surgery Market in the United States Volume (K Unit) Forecast, by Application 2019 & 2032
- Table 11: Canada Gastric Bypass Surgery Market in the United States Revenue (Million) Forecast, by Application 2019 & 2032
- Table 12: Canada Gastric Bypass Surgery Market in the United States Volume (K Unit) Forecast, by Application 2019 & 2032
- Table 13: Mexico Gastric Bypass Surgery Market in the United States Revenue (Million) Forecast, by Application 2019 & 2032
- Table 14: Mexico Gastric Bypass Surgery Market in the United States Volume (K Unit) Forecast, by Application 2019 & 2032
- Table 15: Global Gastric Bypass Surgery Market in the United States Revenue Million Forecast, by Country 2019 & 2032
- Table 16: Global Gastric Bypass Surgery Market in the United States Volume K Unit Forecast, by Country 2019 & 2032
- Table 17: Germany Gastric Bypass Surgery Market in the United States Revenue (Million) Forecast, by Application 2019 & 2032
- Table 18: Germany Gastric Bypass Surgery Market in the United States Volume (K Unit) Forecast, by Application 2019 & 2032
- Table 19: United Kingdom Gastric Bypass Surgery Market in the United States Revenue (Million) Forecast, by Application 2019 & 2032
- Table 20: United Kingdom Gastric Bypass Surgery Market in the United States Volume (K Unit) Forecast, by Application 2019 & 2032
- Table 21: France Gastric Bypass Surgery Market in the United States Revenue (Million) Forecast, by Application 2019 & 2032
- Table 22: France Gastric Bypass Surgery Market in the United States Volume (K Unit) Forecast, by Application 2019 & 2032
- Table 23: Italy Gastric Bypass Surgery Market in the United States Revenue (Million) Forecast, by Application 2019 & 2032
- Table 24: Italy Gastric Bypass Surgery Market in the United States Volume (K Unit) Forecast, by Application 2019 & 2032
- Table 25: Spain Gastric Bypass Surgery Market in the United States Revenue (Million) Forecast, by Application 2019 & 2032
- Table 26: Spain Gastric Bypass Surgery Market in the United States Volume (K Unit) Forecast, by Application 2019 & 2032
- Table 27: Rest of Europe Gastric Bypass Surgery Market in the United States Revenue (Million) Forecast, by Application 2019 & 2032
- Table 28: Rest of Europe Gastric Bypass Surgery Market in the United States Volume (K Unit) Forecast, by Application 2019 & 2032
- Table 29: Global Gastric Bypass Surgery Market in the United States Revenue Million Forecast, by Country 2019 & 2032
- Table 30: Global Gastric Bypass Surgery Market in the United States Volume K Unit Forecast, by Country 2019 & 2032
- Table 31: China Gastric Bypass Surgery Market in the United States Revenue (Million) Forecast, by Application 2019 & 2032
- Table 32: China Gastric Bypass Surgery Market in the United States Volume (K Unit) Forecast, by Application 2019 & 2032
- Table 33: Japan Gastric Bypass Surgery Market in the United States Revenue (Million) Forecast, by Application 2019 & 2032
- Table 34: Japan Gastric Bypass Surgery Market in the United States Volume (K Unit) Forecast, by Application 2019 & 2032
- Table 35: India Gastric Bypass Surgery Market in the United States Revenue (Million) Forecast, by Application 2019 & 2032
- Table 36: India Gastric Bypass Surgery Market in the United States Volume (K Unit) Forecast, by Application 2019 & 2032
- Table 37: Australia Gastric Bypass Surgery Market in the United States Revenue (Million) Forecast, by Application 2019 & 2032
- Table 38: Australia Gastric Bypass Surgery Market in the United States Volume (K Unit) Forecast, by Application 2019 & 2032
- Table 39: South Korea Gastric Bypass Surgery Market in the United States Revenue (Million) Forecast, by Application 2019 & 2032
- Table 40: South Korea Gastric Bypass Surgery Market in the United States Volume (K Unit) Forecast, by Application 2019 & 2032
- Table 41: Rest of Asia Pacific Gastric Bypass Surgery Market in the United States Revenue (Million) Forecast, by Application 2019 & 2032
- Table 42: Rest of Asia Pacific Gastric Bypass Surgery Market in the United States Volume (K Unit) Forecast, by Application 2019 & 2032
- Table 43: Global Gastric Bypass Surgery Market in the United States Revenue Million Forecast, by Country 2019 & 2032
- Table 44: Global Gastric Bypass Surgery Market in the United States Volume K Unit Forecast, by Country 2019 & 2032
- Table 45: GCC Gastric Bypass Surgery Market in the United States Revenue (Million) Forecast, by Application 2019 & 2032
- Table 46: GCC Gastric Bypass Surgery Market in the United States Volume (K Unit) Forecast, by Application 2019 & 2032
- Table 47: South Africa Gastric Bypass Surgery Market in the United States Revenue (Million) Forecast, by Application 2019 & 2032
- Table 48: South Africa Gastric Bypass Surgery Market in the United States Volume (K Unit) Forecast, by Application 2019 & 2032
- Table 49: Rest of Middle East and Africa Gastric Bypass Surgery Market in the United States Revenue (Million) Forecast, by Application 2019 & 2032
- Table 50: Rest of Middle East and Africa Gastric Bypass Surgery Market in the United States Volume (K Unit) Forecast, by Application 2019 & 2032
- Table 51: Global Gastric Bypass Surgery Market in the United States Revenue Million Forecast, by Country 2019 & 2032
- Table 52: Global Gastric Bypass Surgery Market in the United States Volume K Unit Forecast, by Country 2019 & 2032
- Table 53: Brazil Gastric Bypass Surgery Market in the United States Revenue (Million) Forecast, by Application 2019 & 2032
- Table 54: Brazil Gastric Bypass Surgery Market in the United States Volume (K Unit) Forecast, by Application 2019 & 2032
- Table 55: Argentina Gastric Bypass Surgery Market in the United States Revenue (Million) Forecast, by Application 2019 & 2032
- Table 56: Argentina Gastric Bypass Surgery Market in the United States Volume (K Unit) Forecast, by Application 2019 & 2032
- Table 57: Rest of South America Gastric Bypass Surgery Market in the United States Revenue (Million) Forecast, by Application 2019 & 2032
- Table 58: Rest of South America Gastric Bypass Surgery Market in the United States Volume (K Unit) Forecast, by Application 2019 & 2032
- Table 59: Global Gastric Bypass Surgery Market in the United States Revenue Million Forecast, by Device 2019 & 2032
- Table 60: Global Gastric Bypass Surgery Market in the United States Volume K Unit Forecast, by Device 2019 & 2032
- Table 61: Global Gastric Bypass Surgery Market in the United States Revenue Million Forecast, by Country 2019 & 2032
- Table 62: Global Gastric Bypass Surgery Market in the United States Volume K Unit Forecast, by Country 2019 & 2032
- Table 63: United States Gastric Bypass Surgery Market in the United States Revenue (Million) Forecast, by Application 2019 & 2032
- Table 64: United States Gastric Bypass Surgery Market in the United States Volume (K Unit) Forecast, by Application 2019 & 2032
- Table 65: Canada Gastric Bypass Surgery Market in the United States Revenue (Million) Forecast, by Application 2019 & 2032
- Table 66: Canada Gastric Bypass Surgery Market in the United States Volume (K Unit) Forecast, by Application 2019 & 2032
- Table 67: Mexico Gastric Bypass Surgery Market in the United States Revenue (Million) Forecast, by Application 2019 & 2032
- Table 68: Mexico Gastric Bypass Surgery Market in the United States Volume (K Unit) Forecast, by Application 2019 & 2032
- Table 69: Global Gastric Bypass Surgery Market in the United States Revenue Million Forecast, by Device 2019 & 2032
- Table 70: Global Gastric Bypass Surgery Market in the United States Volume K Unit Forecast, by Device 2019 & 2032
- Table 71: Global Gastric Bypass Surgery Market in the United States Revenue Million Forecast, by Country 2019 & 2032
- Table 72: Global Gastric Bypass Surgery Market in the United States Volume K Unit Forecast, by Country 2019 & 2032
- Table 73: Brazil Gastric Bypass Surgery Market in the United States Revenue (Million) Forecast, by Application 2019 & 2032
- Table 74: Brazil Gastric Bypass Surgery Market in the United States Volume (K Unit) Forecast, by Application 2019 & 2032
- Table 75: Argentina Gastric Bypass Surgery Market in the United States Revenue (Million) Forecast, by Application 2019 & 2032
- Table 76: Argentina Gastric Bypass Surgery Market in the United States Volume (K Unit) Forecast, by Application 2019 & 2032
- Table 77: Rest of South America Gastric Bypass Surgery Market in the United States Revenue (Million) Forecast, by Application 2019 & 2032
- Table 78: Rest of South America Gastric Bypass Surgery Market in the United States Volume (K Unit) Forecast, by Application 2019 & 2032
- Table 79: Global Gastric Bypass Surgery Market in the United States Revenue Million Forecast, by Device 2019 & 2032
- Table 80: Global Gastric Bypass Surgery Market in the United States Volume K Unit Forecast, by Device 2019 & 2032
- Table 81: Global Gastric Bypass Surgery Market in the United States Revenue Million Forecast, by Country 2019 & 2032
- Table 82: Global Gastric Bypass Surgery Market in the United States Volume K Unit Forecast, by Country 2019 & 2032
- Table 83: United Kingdom Gastric Bypass Surgery Market in the United States Revenue (Million) Forecast, by Application 2019 & 2032
- Table 84: United Kingdom Gastric Bypass Surgery Market in the United States Volume (K Unit) Forecast, by Application 2019 & 2032
- Table 85: Germany Gastric Bypass Surgery Market in the United States Revenue (Million) Forecast, by Application 2019 & 2032
- Table 86: Germany Gastric Bypass Surgery Market in the United States Volume (K Unit) Forecast, by Application 2019 & 2032
- Table 87: France Gastric Bypass Surgery Market in the United States Revenue (Million) Forecast, by Application 2019 & 2032
- Table 88: France Gastric Bypass Surgery Market in the United States Volume (K Unit) Forecast, by Application 2019 & 2032
- Table 89: Italy Gastric Bypass Surgery Market in the United States Revenue (Million) Forecast, by Application 2019 & 2032
- Table 90: Italy Gastric Bypass Surgery Market in the United States Volume (K Unit) Forecast, by Application 2019 & 2032
- Table 91: Spain Gastric Bypass Surgery Market in the United States Revenue (Million) Forecast, by Application 2019 & 2032
- Table 92: Spain Gastric Bypass Surgery Market in the United States Volume (K Unit) Forecast, by Application 2019 & 2032
- Table 93: Russia Gastric Bypass Surgery Market in the United States Revenue (Million) Forecast, by Application 2019 & 2032
- Table 94: Russia Gastric Bypass Surgery Market in the United States Volume (K Unit) Forecast, by Application 2019 & 2032
- Table 95: Benelux Gastric Bypass Surgery Market in the United States Revenue (Million) Forecast, by Application 2019 & 2032
- Table 96: Benelux Gastric Bypass Surgery Market in the United States Volume (K Unit) Forecast, by Application 2019 & 2032
- Table 97: Nordics Gastric Bypass Surgery Market in the United States Revenue (Million) Forecast, by Application 2019 & 2032
- Table 98: Nordics Gastric Bypass Surgery Market in the United States Volume (K Unit) Forecast, by Application 2019 & 2032
- Table 99: Rest of Europe Gastric Bypass Surgery Market in the United States Revenue (Million) Forecast, by Application 2019 & 2032
- Table 100: Rest of Europe Gastric Bypass Surgery Market in the United States Volume (K Unit) Forecast, by Application 2019 & 2032
- Table 101: Global Gastric Bypass Surgery Market in the United States Revenue Million Forecast, by Device 2019 & 2032
- Table 102: Global Gastric Bypass Surgery Market in the United States Volume K Unit Forecast, by Device 2019 & 2032
- Table 103: Global Gastric Bypass Surgery Market in the United States Revenue Million Forecast, by Country 2019 & 2032
- Table 104: Global Gastric Bypass Surgery Market in the United States Volume K Unit Forecast, by Country 2019 & 2032
- Table 105: Turkey Gastric Bypass Surgery Market in the United States Revenue (Million) Forecast, by Application 2019 & 2032
- Table 106: Turkey Gastric Bypass Surgery Market in the United States Volume (K Unit) Forecast, by Application 2019 & 2032
- Table 107: Israel Gastric Bypass Surgery Market in the United States Revenue (Million) Forecast, by Application 2019 & 2032
- Table 108: Israel Gastric Bypass Surgery Market in the United States Volume (K Unit) Forecast, by Application 2019 & 2032
- Table 109: GCC Gastric Bypass Surgery Market in the United States Revenue (Million) Forecast, by Application 2019 & 2032
- Table 110: GCC Gastric Bypass Surgery Market in the United States Volume (K Unit) Forecast, by Application 2019 & 2032
- Table 111: North Africa Gastric Bypass Surgery Market in the United States Revenue (Million) Forecast, by Application 2019 & 2032
- Table 112: North Africa Gastric Bypass Surgery Market in the United States Volume (K Unit) Forecast, by Application 2019 & 2032
- Table 113: South Africa Gastric Bypass Surgery Market in the United States Revenue (Million) Forecast, by Application 2019 & 2032
- Table 114: South Africa Gastric Bypass Surgery Market in the United States Volume (K Unit) Forecast, by Application 2019 & 2032
- Table 115: Rest of Middle East & Africa Gastric Bypass Surgery Market in the United States Revenue (Million) Forecast, by Application 2019 & 2032
- Table 116: Rest of Middle East & Africa Gastric Bypass Surgery Market in the United States Volume (K Unit) Forecast, by Application 2019 & 2032
- Table 117: Global Gastric Bypass Surgery Market in the United States Revenue Million Forecast, by Device 2019 & 2032
- Table 118: Global Gastric Bypass Surgery Market in the United States Volume K Unit Forecast, by Device 2019 & 2032
- Table 119: Global Gastric Bypass Surgery Market in the United States Revenue Million Forecast, by Country 2019 & 2032
- Table 120: Global Gastric Bypass Surgery Market in the United States Volume K Unit Forecast, by Country 2019 & 2032
- Table 121: China Gastric Bypass Surgery Market in the United States Revenue (Million) Forecast, by Application 2019 & 2032
- Table 122: China Gastric Bypass Surgery Market in the United States Volume (K Unit) Forecast, by Application 2019 & 2032
- Table 123: India Gastric Bypass Surgery Market in the United States Revenue (Million) Forecast, by Application 2019 & 2032
- Table 124: India Gastric Bypass Surgery Market in the United States Volume (K Unit) Forecast, by Application 2019 & 2032
- Table 125: Japan Gastric Bypass Surgery Market in the United States Revenue (Million) Forecast, by Application 2019 & 2032
- Table 126: Japan Gastric Bypass Surgery Market in the United States Volume (K Unit) Forecast, by Application 2019 & 2032
- Table 127: South Korea Gastric Bypass Surgery Market in the United States Revenue (Million) Forecast, by Application 2019 & 2032
- Table 128: South Korea Gastric Bypass Surgery Market in the United States Volume (K Unit) Forecast, by Application 2019 & 2032
- Table 129: ASEAN Gastric Bypass Surgery Market in the United States Revenue (Million) Forecast, by Application 2019 & 2032
- Table 130: ASEAN Gastric Bypass Surgery Market in the United States Volume (K Unit) Forecast, by Application 2019 & 2032
- Table 131: Oceania Gastric Bypass Surgery Market in the United States Revenue (Million) Forecast, by Application 2019 & 2032
- Table 132: Oceania Gastric Bypass Surgery Market in the United States Volume (K Unit) Forecast, by Application 2019 & 2032
- Table 133: Rest of Asia Pacific Gastric Bypass Surgery Market in the United States Revenue (Million) Forecast, by Application 2019 & 2032
- Table 134: Rest of Asia Pacific Gastric Bypass Surgery Market in the United States Volume (K Unit) Forecast, by Application 2019 & 2032
Frequently Asked Questions
1. What is the projected Compound Annual Growth Rate (CAGR) of the Gastric Bypass Surgery Market in the United States?
The projected CAGR is approximately 5.19%.
2. Which companies are prominent players in the Gastric Bypass Surgery Market in the United States?
Key companies in the market include The Cooper Companies, Medtronic PLC, Apollo Endosurgery Inc, Conmed Corporation, Intuitive Surgical Inc, B Braun Melsungen AG, Johnson and Johnson (Ethicon Inc), Olympus Corporation, Aspire Bariatrics Inc.
3. What are the main segments of the Gastric Bypass Surgery Market in the United States?
The market segments include Device.
4. Can you provide details about the market size?
The market size is estimated to be USD 0.85 Million as of 2022.
5. What are some drivers contributing to market growth?
Increase in Obesity Patients; Rising Prevalence Rate of Type 2 Diabetes and Heart Diseases; Growing Government Initiatives to Curb Obesity.
6. What are the notable trends driving market growth?
Closure Device Segment is Expected to Register a High CAGR in the Assisting Device Segment.
7. Are there any restraints impacting market growth?
High Cost of Surgery.
8. Can you provide examples of recent developments in the market?
In September 2021, Olympus launched the POWERSEAL advanced bipolar surgical energy devices to Strengthen its Surgical Portfolio. The POWERSEAL devices can be used in numerous forms of surgical intervention including bariatric surgical procedures.
9. What pricing options are available for accessing the report?
Pricing options include single-user, multi-user, and enterprise licenses priced at USD 3800, USD 4500, and USD 5800 respectively.
10. Is the market size provided in terms of value or volume?
The market size is provided in terms of value, measured in Million and volume, measured in K Unit.
11. Are there any specific market keywords associated with the report?
Yes, the market keyword associated with the report is "Gastric Bypass Surgery Market in the United States," which aids in identifying and referencing the specific market segment covered.
12. How do I determine which pricing option suits my needs best?
The pricing options vary based on user requirements and access needs. Individual users may opt for single-user licenses, while businesses requiring broader access may choose multi-user or enterprise licenses for cost-effective access to the report.
13. Are there any additional resources or data provided in the Gastric Bypass Surgery Market in the United States report?
While the report offers comprehensive insights, it's advisable to review the specific contents or supplementary materials provided to ascertain if additional resources or data are available.
14. How can I stay updated on further developments or reports in the Gastric Bypass Surgery Market in the United States?
To stay informed about further developments, trends, and reports in the Gastric Bypass Surgery Market in the United States, consider subscribing to industry newsletters, following relevant companies and organizations, or regularly checking reputable industry news sources and publications.
Methodology
Step 1 - Identification of Relevant Samples Size from Population Database


Step 2 - Approaches for Defining Global Market Size (Value, Volume* & Price*)

Note*: In applicable scenarios
Step 3 - Data Sources
Primary Research
- Web Analytics
- Survey Reports
- Research Institute
- Latest Research Reports
- Opinion Leaders
Secondary Research
- Annual Reports
- White Paper
- Latest Press Release
- Industry Association
- Paid Database
- Investor Presentations

Step 4 - Data Triangulation
Involves using different sources of information in order to increase the validity of a study
These sources are likely to be stakeholders in a program - participants, other researchers, program staff, other community members, and so on.
Then we put all data in single framework & apply various statistical tools to find out the dynamic on the market.
During the analysis stage, feedback from the stakeholder groups would be compared to determine areas of agreement as well as areas of divergence


