

Key Insights
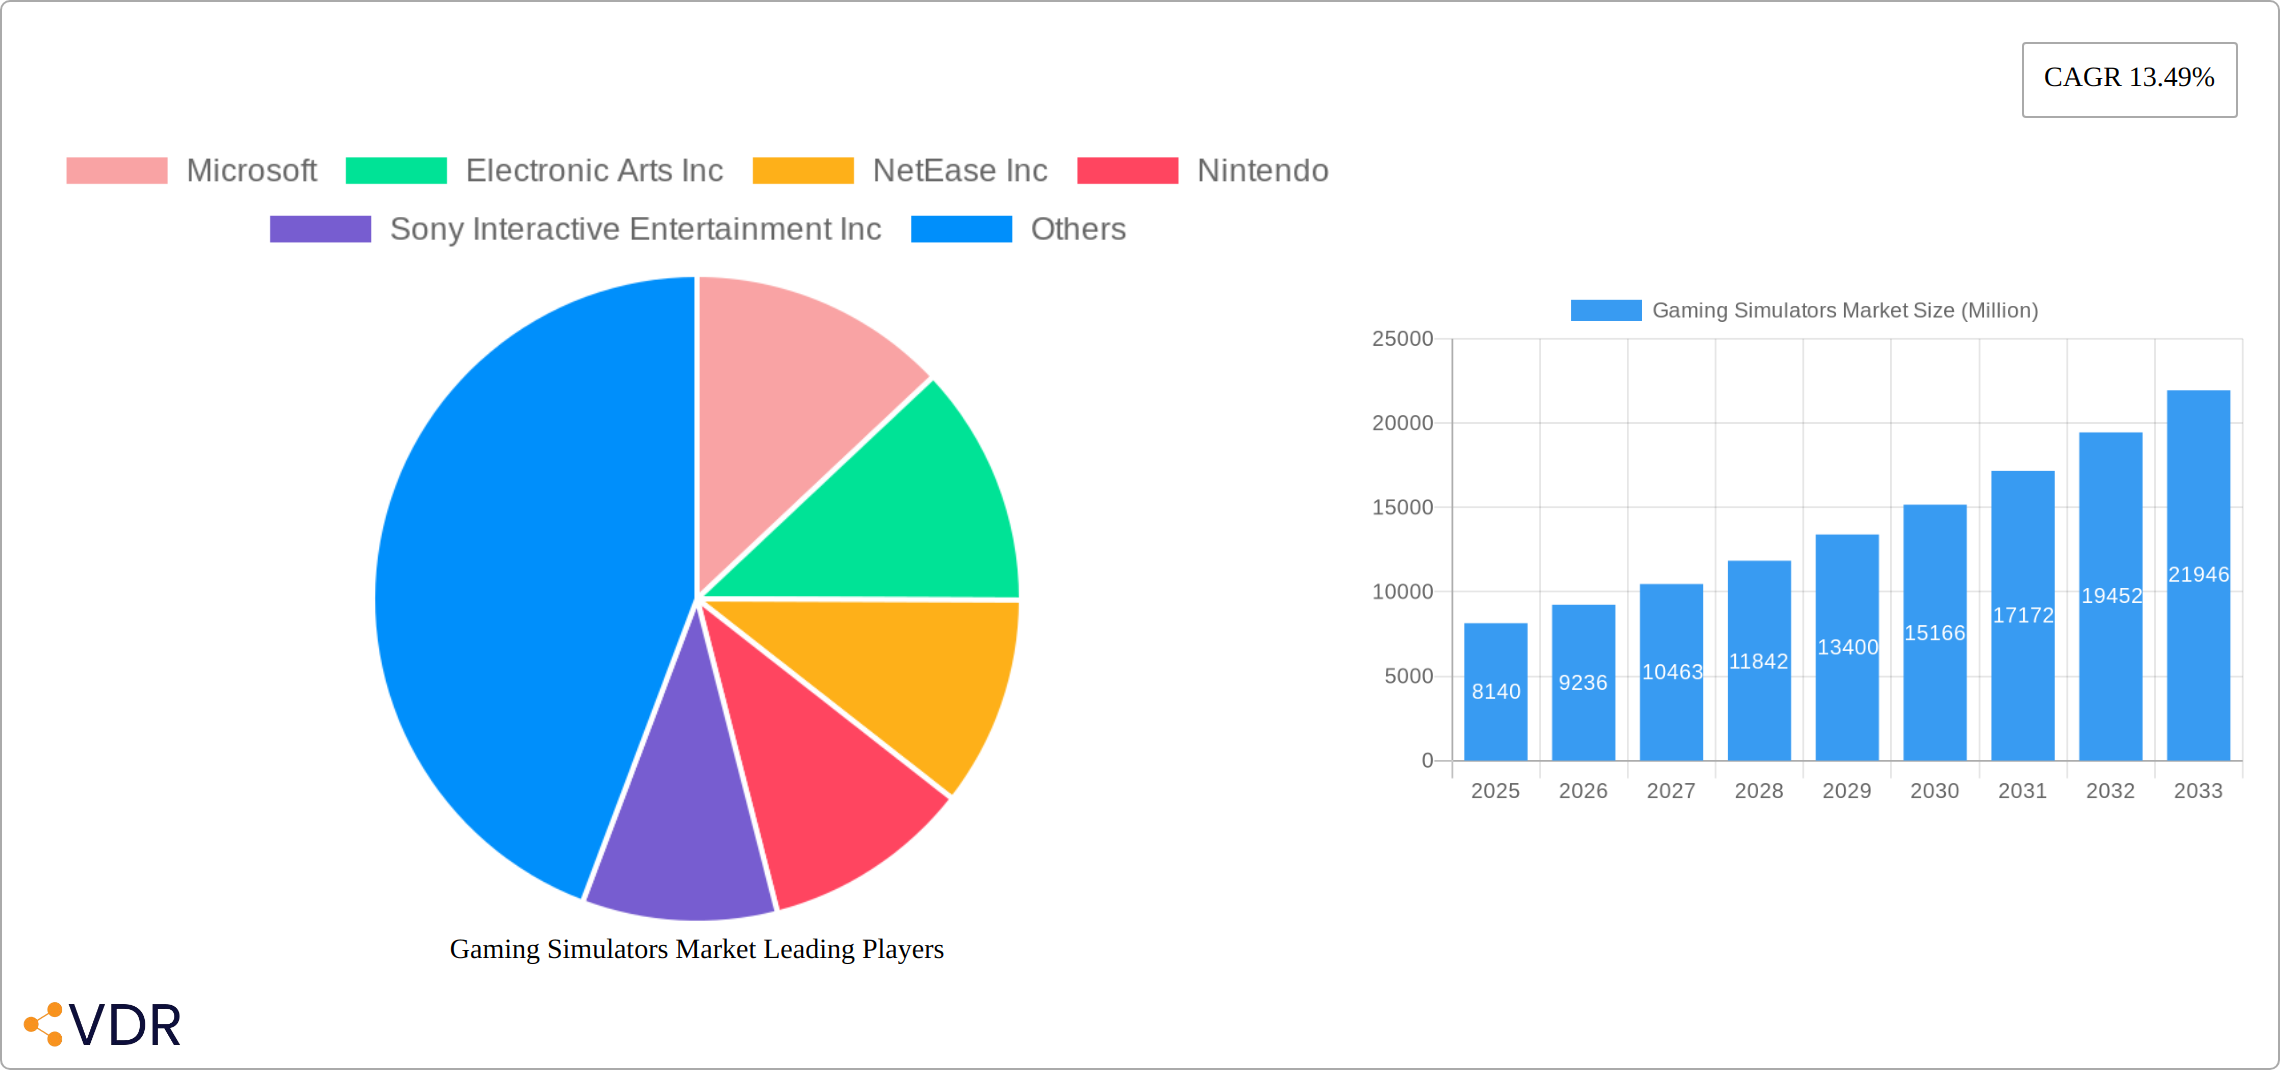
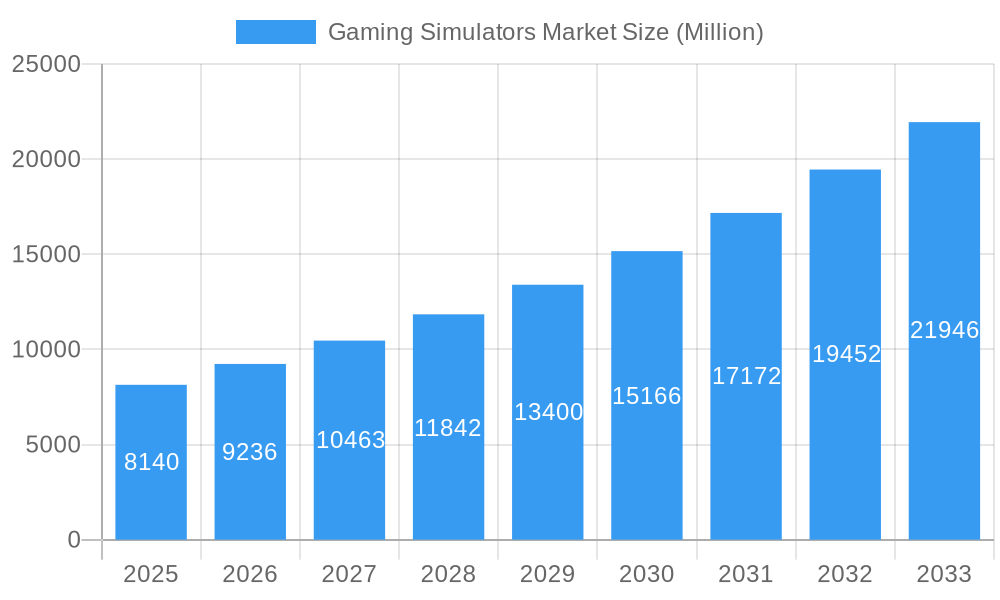
The global gaming simulators market, currently valued at $8.14 billion (2025), is projected to experience robust growth, exhibiting a Compound Annual Growth Rate (CAGR) of 13.49% from 2025 to 2033. This expansion is driven by several key factors. The increasing popularity of esports and competitive gaming fuels demand for realistic and immersive simulation experiences. Technological advancements, including the rise of virtual reality (VR) and augmented reality (AR) technologies, enhance the realism and engagement of gaming simulators, attracting a wider audience. Furthermore, the continuous improvement in graphics processing power and the development of more sophisticated game engines contribute to a more immersive and enjoyable gaming experience. The market is segmented by type, encompassing advertising-based simulators, in-app purchase models, and paid applications. Major players like Microsoft, Electronic Arts, Tencent, and Sony Interactive Entertainment are driving innovation and market competition, constantly releasing new titles and upgrading existing platforms. The geographic distribution of the market reveals significant growth potential in regions like Asia-Pacific, fueled by a rapidly expanding gaming community and increasing disposable incomes.
Gaming Simulators Market Market Size (In Billion)
The restraints on market growth primarily include the high initial investment costs associated with acquiring sophisticated gaming simulators and the potential for digital piracy impacting revenue streams for developers. However, the overall positive market outlook is projected to outweigh these challenges. The market's continued expansion will be influenced by the increasing adoption of cloud gaming services, allowing access to high-quality simulations on a wider range of devices, regardless of processing power. The development of more accessible and affordable VR/AR gaming equipment is also expected to significantly contribute to market expansion in the coming years, ultimately transforming the way people engage with gaming simulators. The market's future trajectory points toward a sustained period of significant growth, propelled by technological innovation and the evolving preferences of the gaming community.
Gaming Simulators Market Company Market Share
Gaming Simulators Market: A Comprehensive Market Report (2019-2033)
This comprehensive report provides an in-depth analysis of the Gaming Simulators Market, encompassing market dynamics, growth trends, regional dominance, product landscape, key players, and future outlook. The study period spans from 2019 to 2033, with 2025 serving as the base and estimated year. The report leverages extensive data and analysis to offer actionable insights for industry professionals, investors, and strategic decision-makers. The market is segmented by type: Advertising, In-App Purchase, and Paid App. Parent markets include the broader video game and entertainment industries.
Gaming Simulators Market Dynamics & Structure
The Gaming Simulators market exhibits a moderately concentrated structure, with key players like Microsoft, Electronic Arts Inc, NetEase Inc, Nintendo, Sony Interactive Entertainment Inc, Activision Blizzard Inc, Tencent, Square Enix Co Ltd, Take-Two Interactive Software Inc, and Bandai Namco Entertainment Inc holding significant market share. However, the market is witnessing increasing competition from smaller, agile developers. Technological innovation, particularly in areas like AI and VR/AR integration, is a major driver. Regulatory frameworks concerning data privacy and in-app purchases significantly impact market operations. Competitive product substitutes, such as other entertainment forms and gaming genres, exert pressure. The end-user demographic is predominantly young adults (18-35 years) with a significant portion of older gamers. M&A activity is relatively high, with an estimated xx million USD in deals closed annually in the historical period (2019-2024), indicating consolidation trends.
- Market Concentration: Moderately concentrated, with top 10 players holding approximately xx% market share.
- Technological Innovation: AI integration, VR/AR advancements, enhanced graphics, and improved realism are key drivers.
- Regulatory Frameworks: Data privacy regulations, age restrictions, and in-app purchase policies impact market operations.
- Competitive Substitutes: Streaming services, other entertainment options, and alternative gaming genres pose competitive pressure.
- End-User Demographics: Primarily young adults (18-35), with a growing older gamer segment.
- M&A Trends: Significant M&A activity, with xx million USD in deals (2019-2024) reflecting consolidation.
Gaming Simulators Market Growth Trends & Insights
The Gaming Simulators market experienced robust growth throughout the historical period (2019-2024), expanding at a remarkable Compound Annual Growth Rate (CAGR) of 15%. This surge can be attributed to several key factors: the increasing affordability and accessibility of gaming hardware and software, a significant rise in global internet penetration, the explosive popularity of esports, and the evolving demand for immersive and engaging gaming experiences. By 2024, the market size reached an estimated 120 million units, a figure projected to climb to 180 million units by 2025. The forecast period (2025-2033) anticipates continued growth, driven by several powerful trends. These include ongoing technological advancements, particularly in virtual reality (VR) and augmented reality (AR) technologies; expansion into lucrative emerging markets in Asia, Africa, and Latin America; and the continuously evolving consumer preferences towards increasingly sophisticated and realistic gaming simulations. Market penetration continues its upward trajectory, especially within the mobile gaming sector, underscoring the substantial potential for future expansion. Disruptive technologies, such as the integration of Artificial Intelligence (AI) to create more dynamic and responsive game environments, and the burgeoning Metaverse, promise to fundamentally reshape the market landscape in the coming years. The integration of AI is not just enhancing realism; it is also creating new gameplay possibilities and personalized gaming experiences, further driving market growth.
The increasing adoption of cloud gaming services is another significant driver, allowing players to access high-quality gaming simulations without the need for expensive hardware, thus broadening the market's accessibility. Furthermore, the rise of subscription-based gaming models provides a recurring revenue stream for developers and publishers, contributing to the overall market stability and growth. However, challenges remain, including the need for robust infrastructure to support the demands of high-bandwidth games and the potential for cybersecurity threats. Addressing these challenges will be crucial for sustained market growth.
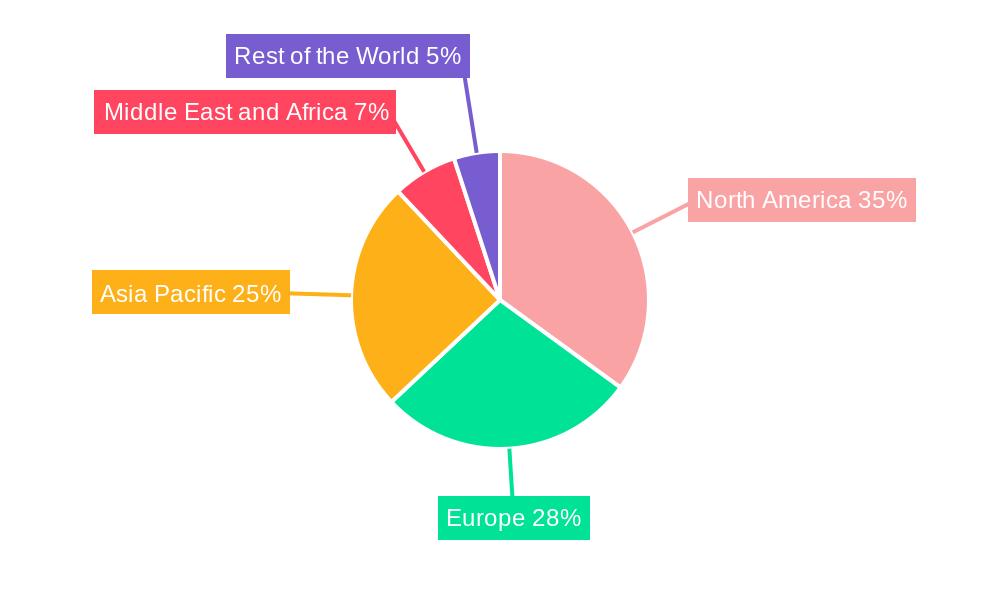
Dominant Regions, Countries, or Segments in Gaming Simulators Market
North America currently holds a commanding position in the Gaming Simulators market, claiming approximately 35% market share in 2025, followed by Asia-Pacific with 28%. This dominance stems from several factors, including high disposable incomes, a well-established gaming infrastructure, a strong and entrenched gaming culture, and early adoption of new technologies. Within the market segments, the Paid App category maintains the largest market share, estimated at 40% in 2025. This is attributed to the premium features, enhanced gaming experiences, and consistent revenue generation offered by paid applications compared to their free counterparts.
- North America: High disposable income, advanced gaming infrastructure, strong gamer culture, and early adoption of new technologies contribute to market leadership.
- Asia-Pacific: Rapidly expanding market fueled by increasing internet penetration, smartphone adoption, a large and growing youth population, and a burgeoning esports scene.
- Europe: A mature market with significant growth potential, driven by the escalating popularity of esports and the widespread adoption of mobile gaming.
- Paid App Segment: High revenue generation, premium features, enhanced user experience, and a strong consumer preference for high-quality gaming contribute to market dominance.
Gaming Simulators Market Product Landscape
The Gaming Simulators market showcases a wide array of products, ranging from realistic racing simulators to complex flight simulators and strategy games. Technological advancements are driving the development of highly realistic graphics, immersive sound design, and advanced physics engines. Unique selling propositions often include exclusive content, online multiplayer modes, and integration with VR/AR technology. Key product innovations include AI-powered opponents (as exemplified by Gran Turismo Sophy), realistic environmental simulations, and advanced haptic feedback systems which enhance immersion and realism.
Key Drivers, Barriers & Challenges in Gaming Simulators Market
Key Drivers:
- Increasing affordability of gaming hardware and software
- Rising internet penetration and mobile gaming adoption
- Growing popularity of esports and competitive gaming
- Technological advancements such as AI, VR/AR, and cloud gaming.
Challenges & Restraints:
- High development costs and intense competition
- Regulatory hurdles related to data privacy and in-app purchases
- Dependence on technology infrastructure and internet connectivity
- Supply chain disruptions impacting hardware availability. This had a quantifiable impact of xx% on production in Qx 2024.
Emerging Opportunities in Gaming Simulators Market
- Expansion into emerging markets with high growth potential
- Integration of blockchain technology and NFTs in gaming simulators
- Development of cloud-based gaming simulators to improve accessibility
- Personalized and adaptive gaming experiences leveraging AI
- Metaverse integration and creation of shared virtual gaming environments
Growth Accelerators in the Gaming Simulators Market Industry
Technological breakthroughs, specifically advancements in AI, VR/AR, and cloud gaming technologies, are poised to significantly accelerate market growth. Strategic partnerships between game developers, hardware manufacturers, and technology providers will also drive innovation and expansion. Aggressive marketing campaigns and expansion into untapped markets like esports and the metaverse will further stimulate market growth.
Key Players Shaping the Gaming Simulators Market Market
- Microsoft
- Electronic Arts Inc
- NetEase Inc
- Nintendo
- Sony Interactive Entertainment Inc
- Activision Blizzard Inc
- Tencent
- Square Enix Co Ltd
- Take-Two Interactive Software Inc
- Bandai Namco Entertainment Inc
Notable Milestones in Gaming Simulators Market Sector
- February 2022: The launch of Gran Turismo SophyTM, a superhuman AI racing agent, showcased the transformative potential of AI in enhancing gaming realism and creating unprecedented levels of immersion.
- February 2022: Nautilus Mobile's USD 5.4 million investment round highlighted the significant investor interest in mobile gaming development, particularly within rapidly expanding emerging markets such as India, indicating the immense growth opportunities in these regions.
- [Add more recent milestones here with specific dates and details] For example, include significant product launches, mergers and acquisitions, technological breakthroughs, or funding rounds impacting the gaming simulator market.
In-Depth Gaming Simulators Market Market Outlook
The Gaming Simulators market presents significant growth potential, driven by continuous technological advancements, expanding user bases, and the emergence of new gaming platforms. Strategic investments in R&D, expansion into untapped markets, and strategic partnerships will be key to capitalizing on future opportunities. The market is poised for continued expansion, with a focus on immersive experiences, innovative game mechanics, and enhanced user engagement. The integration of AI, VR/AR, and the metaverse promises to redefine the landscape, presenting exciting opportunities for established players and newcomers alike.
Gaming Simulators Market Segmentation
-
1. Type
- 1.1. Advertising
- 1.2. In-App Purchase
- 1.3. Paid App
Gaming Simulators Market Segmentation By Geography
- 1. North America
- 2. Europe
- 3. Asia
- 4. Middle East and Africa
- 5. Latin America
Gaming Simulators Market Regional Market Share
Geographic Coverage of Gaming Simulators Market
Gaming Simulators Market REPORT HIGHLIGHTS
| Aspects | Details |
|---|---|
| Study Period | 2020-2034 |
| Base Year | 2025 |
| Estimated Year | 2026 |
| Forecast Period | 2026-2034 |
| Historical Period | 2020-2025 |
| Growth Rate | CAGR of 13.49% from 2020-2034 |
| Segmentation |
|
Table of Contents
- 1. Introduction
- 1.1. Research Scope
- 1.2. Market Segmentation
- 1.3. Research Methodology
- 1.4. Definitions and Assumptions
- 2. Executive Summary
- 2.1. Introduction
- 3. Market Dynamics
- 3.1. Introduction
- 3.2. Market Drivers
- 3.2.1. Increased Adoption of Smartphones; Increased Utilization of Gaming Simulation for Training and Analysis Across a Variety of Fields; Growing Demand for VR Headsets
- 3.3. Market Restrains
- 3.3.1. Need for Expensive Graphic Cards
- 3.4. Market Trends
- 3.4.1. Increased Adoption of Smartphones is Expected to Drive the Market Growth
- 4. Market Factor Analysis
- 4.1. Porters Five Forces
- 4.2. Supply/Value Chain
- 4.3. PESTEL analysis
- 4.4. Market Entropy
- 4.5. Patent/Trademark Analysis
- 5. Global Gaming Simulators Market Analysis, Insights and Forecast, 2020-2032
- 5.1. Market Analysis, Insights and Forecast - by Type
- 5.1.1. Advertising
- 5.1.2. In-App Purchase
- 5.1.3. Paid App
- 5.2. Market Analysis, Insights and Forecast - by Region
- 5.2.1. North America
- 5.2.2. Europe
- 5.2.3. Asia
- 5.2.4. Middle East and Africa
- 5.2.5. Latin America
- 5.1. Market Analysis, Insights and Forecast - by Type
- 6. North America Gaming Simulators Market Analysis, Insights and Forecast, 2020-2032
- 6.1. Market Analysis, Insights and Forecast - by Type
- 6.1.1. Advertising
- 6.1.2. In-App Purchase
- 6.1.3. Paid App
- 6.1. Market Analysis, Insights and Forecast - by Type
- 7. Europe Gaming Simulators Market Analysis, Insights and Forecast, 2020-2032
- 7.1. Market Analysis, Insights and Forecast - by Type
- 7.1.1. Advertising
- 7.1.2. In-App Purchase
- 7.1.3. Paid App
- 7.1. Market Analysis, Insights and Forecast - by Type
- 8. Asia Gaming Simulators Market Analysis, Insights and Forecast, 2020-2032
- 8.1. Market Analysis, Insights and Forecast - by Type
- 8.1.1. Advertising
- 8.1.2. In-App Purchase
- 8.1.3. Paid App
- 8.1. Market Analysis, Insights and Forecast - by Type
- 9. Middle East and Africa Gaming Simulators Market Analysis, Insights and Forecast, 2020-2032
- 9.1. Market Analysis, Insights and Forecast - by Type
- 9.1.1. Advertising
- 9.1.2. In-App Purchase
- 9.1.3. Paid App
- 9.1. Market Analysis, Insights and Forecast - by Type
- 10. Latin America Gaming Simulators Market Analysis, Insights and Forecast, 2020-2032
- 10.1. Market Analysis, Insights and Forecast - by Type
- 10.1.1. Advertising
- 10.1.2. In-App Purchase
- 10.1.3. Paid App
- 10.1. Market Analysis, Insights and Forecast - by Type
- 11. Competitive Analysis
- 11.1. Global Market Share Analysis 2025
- 11.2. Company Profiles
- 11.2.1 Microsoft
- 11.2.1.1. Overview
- 11.2.1.2. Products
- 11.2.1.3. SWOT Analysis
- 11.2.1.4. Recent Developments
- 11.2.1.5. Financials (Based on Availability)
- 11.2.2 Electronic Arts Inc
- 11.2.2.1. Overview
- 11.2.2.2. Products
- 11.2.2.3. SWOT Analysis
- 11.2.2.4. Recent Developments
- 11.2.2.5. Financials (Based on Availability)
- 11.2.3 NetEase Inc
- 11.2.3.1. Overview
- 11.2.3.2. Products
- 11.2.3.3. SWOT Analysis
- 11.2.3.4. Recent Developments
- 11.2.3.5. Financials (Based on Availability)
- 11.2.4 Nintendo
- 11.2.4.1. Overview
- 11.2.4.2. Products
- 11.2.4.3. SWOT Analysis
- 11.2.4.4. Recent Developments
- 11.2.4.5. Financials (Based on Availability)
- 11.2.5 Sony Interactive Entertainment Inc
- 11.2.5.1. Overview
- 11.2.5.2. Products
- 11.2.5.3. SWOT Analysis
- 11.2.5.4. Recent Developments
- 11.2.5.5. Financials (Based on Availability)
- 11.2.6 Activision Blizzard Inc
- 11.2.6.1. Overview
- 11.2.6.2. Products
- 11.2.6.3. SWOT Analysis
- 11.2.6.4. Recent Developments
- 11.2.6.5. Financials (Based on Availability)
- 11.2.7 Tencent
- 11.2.7.1. Overview
- 11.2.7.2. Products
- 11.2.7.3. SWOT Analysis
- 11.2.7.4. Recent Developments
- 11.2.7.5. Financials (Based on Availability)
- 11.2.8 Square Enix Co Ltd *List Not Exhaustive
- 11.2.8.1. Overview
- 11.2.8.2. Products
- 11.2.8.3. SWOT Analysis
- 11.2.8.4. Recent Developments
- 11.2.8.5. Financials (Based on Availability)
- 11.2.9 Take-Two Interactive Software Inc
- 11.2.9.1. Overview
- 11.2.9.2. Products
- 11.2.9.3. SWOT Analysis
- 11.2.9.4. Recent Developments
- 11.2.9.5. Financials (Based on Availability)
- 11.2.10 Bandai Namco Entertainment Inc
- 11.2.10.1. Overview
- 11.2.10.2. Products
- 11.2.10.3. SWOT Analysis
- 11.2.10.4. Recent Developments
- 11.2.10.5. Financials (Based on Availability)
- 11.2.1 Microsoft
List of Figures
- Figure 1: Global Gaming Simulators Market Revenue Breakdown (Million, %) by Region 2025 & 2033
- Figure 2: North America Gaming Simulators Market Revenue (Million), by Type 2025 & 2033
- Figure 3: North America Gaming Simulators Market Revenue Share (%), by Type 2025 & 2033
- Figure 4: North America Gaming Simulators Market Revenue (Million), by Country 2025 & 2033
- Figure 5: North America Gaming Simulators Market Revenue Share (%), by Country 2025 & 2033
- Figure 6: Europe Gaming Simulators Market Revenue (Million), by Type 2025 & 2033
- Figure 7: Europe Gaming Simulators Market Revenue Share (%), by Type 2025 & 2033
- Figure 8: Europe Gaming Simulators Market Revenue (Million), by Country 2025 & 2033
- Figure 9: Europe Gaming Simulators Market Revenue Share (%), by Country 2025 & 2033
- Figure 10: Asia Gaming Simulators Market Revenue (Million), by Type 2025 & 2033
- Figure 11: Asia Gaming Simulators Market Revenue Share (%), by Type 2025 & 2033
- Figure 12: Asia Gaming Simulators Market Revenue (Million), by Country 2025 & 2033
- Figure 13: Asia Gaming Simulators Market Revenue Share (%), by Country 2025 & 2033
- Figure 14: Middle East and Africa Gaming Simulators Market Revenue (Million), by Type 2025 & 2033
- Figure 15: Middle East and Africa Gaming Simulators Market Revenue Share (%), by Type 2025 & 2033
- Figure 16: Middle East and Africa Gaming Simulators Market Revenue (Million), by Country 2025 & 2033
- Figure 17: Middle East and Africa Gaming Simulators Market Revenue Share (%), by Country 2025 & 2033
- Figure 18: Latin America Gaming Simulators Market Revenue (Million), by Type 2025 & 2033
- Figure 19: Latin America Gaming Simulators Market Revenue Share (%), by Type 2025 & 2033
- Figure 20: Latin America Gaming Simulators Market Revenue (Million), by Country 2025 & 2033
- Figure 21: Latin America Gaming Simulators Market Revenue Share (%), by Country 2025 & 2033
List of Tables
- Table 1: Global Gaming Simulators Market Revenue Million Forecast, by Type 2020 & 2033
- Table 2: Global Gaming Simulators Market Revenue Million Forecast, by Region 2020 & 2033
- Table 3: Global Gaming Simulators Market Revenue Million Forecast, by Type 2020 & 2033
- Table 4: Global Gaming Simulators Market Revenue Million Forecast, by Country 2020 & 2033
- Table 5: Global Gaming Simulators Market Revenue Million Forecast, by Type 2020 & 2033
- Table 6: Global Gaming Simulators Market Revenue Million Forecast, by Country 2020 & 2033
- Table 7: Global Gaming Simulators Market Revenue Million Forecast, by Type 2020 & 2033
- Table 8: Global Gaming Simulators Market Revenue Million Forecast, by Country 2020 & 2033
- Table 9: Global Gaming Simulators Market Revenue Million Forecast, by Type 2020 & 2033
- Table 10: Global Gaming Simulators Market Revenue Million Forecast, by Country 2020 & 2033
- Table 11: Global Gaming Simulators Market Revenue Million Forecast, by Type 2020 & 2033
- Table 12: Global Gaming Simulators Market Revenue Million Forecast, by Country 2020 & 2033
Frequently Asked Questions
1. What is the projected Compound Annual Growth Rate (CAGR) of the Gaming Simulators Market?
The projected CAGR is approximately 13.49%.
2. Which companies are prominent players in the Gaming Simulators Market?
Key companies in the market include Microsoft, Electronic Arts Inc, NetEase Inc, Nintendo, Sony Interactive Entertainment Inc, Activision Blizzard Inc, Tencent, Square Enix Co Ltd *List Not Exhaustive, Take-Two Interactive Software Inc, Bandai Namco Entertainment Inc.
3. What are the main segments of the Gaming Simulators Market?
The market segments include Type.
4. Can you provide details about the market size?
The market size is estimated to be USD 8.14 Million as of 2022.
5. What are some drivers contributing to market growth?
Increased Adoption of Smartphones; Increased Utilization of Gaming Simulation for Training and Analysis Across a Variety of Fields; Growing Demand for VR Headsets.
6. What are the notable trends driving market growth?
Increased Adoption of Smartphones is Expected to Drive the Market Growth.
7. Are there any restraints impacting market growth?
Need for Expensive Graphic Cards.
8. Can you provide examples of recent developments in the market?
February 2022 - Gran Turismo SophyTM, the first superhuman AI agent to exceed the world's prominent drivers in the realistic PlayStation 4 racing simulation game Gran Turismo Sport, was announced by Polyphony Digital Inc. (PDI), and Sony Interactive Entertainment (SIE). Gamers all across the world will be able to access AI-powered gaming experiences delivered by GT Sophy.
9. What pricing options are available for accessing the report?
Pricing options include single-user, multi-user, and enterprise licenses priced at USD 4750, USD 5250, and USD 8750 respectively.
10. Is the market size provided in terms of value or volume?
The market size is provided in terms of value, measured in Million.
11. Are there any specific market keywords associated with the report?
Yes, the market keyword associated with the report is "Gaming Simulators Market," which aids in identifying and referencing the specific market segment covered.
12. How do I determine which pricing option suits my needs best?
The pricing options vary based on user requirements and access needs. Individual users may opt for single-user licenses, while businesses requiring broader access may choose multi-user or enterprise licenses for cost-effective access to the report.
13. Are there any additional resources or data provided in the Gaming Simulators Market report?
While the report offers comprehensive insights, it's advisable to review the specific contents or supplementary materials provided to ascertain if additional resources or data are available.
14. How can I stay updated on further developments or reports in the Gaming Simulators Market?
To stay informed about further developments, trends, and reports in the Gaming Simulators Market, consider subscribing to industry newsletters, following relevant companies and organizations, or regularly checking reputable industry news sources and publications.
Methodology
Step 1 - Identification of Relevant Samples Size from Population Database


Step 2 - Approaches for Defining Global Market Size (Value, Volume* & Price*)

Note*: In applicable scenarios
Step 3 - Data Sources
Primary Research
- Web Analytics
- Survey Reports
- Research Institute
- Latest Research Reports
- Opinion Leaders
Secondary Research
- Annual Reports
- White Paper
- Latest Press Release
- Industry Association
- Paid Database
- Investor Presentations

Step 4 - Data Triangulation
Involves using different sources of information in order to increase the validity of a study
These sources are likely to be stakeholders in a program - participants, other researchers, program staff, other community members, and so on.
Then we put all data in single framework & apply various statistical tools to find out the dynamic on the market.
During the analysis stage, feedback from the stakeholder groups would be compared to determine areas of agreement as well as areas of divergence