
Key Insights
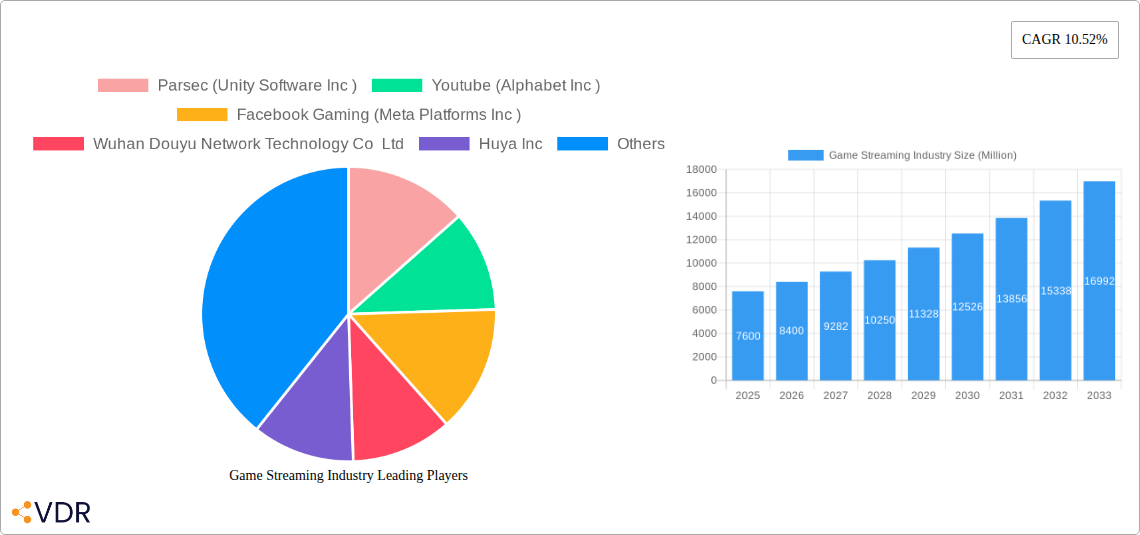
The global game streaming market, currently valued at $7.6 billion (2025), is projected to experience robust growth, exhibiting a Compound Annual Growth Rate (CAGR) of 10.52% from 2025 to 2033. This expansion is fueled by several key factors. The increasing popularity of esports and competitive gaming drives demand for high-quality streaming platforms, allowing viewers to engage with professional players and tournaments. Simultaneously, advancements in internet infrastructure, particularly the widespread adoption of high-speed broadband and 5G networks, enable smoother, lag-free streaming experiences, further fueling market growth. The rise of cloud gaming services, offering subscription-based access to a library of games without requiring high-end hardware, significantly contributes to market expansion, particularly among casual gamers. Furthermore, the integration of social features within streaming platforms, facilitating community building and interaction, enhances user engagement and platform stickiness. The market is segmented by revenue models (in-game advertising, subscriptions, others) and solutions (web-based, app-based), with both segments experiencing substantial growth, reflecting the diverse preferences and needs of gamers and viewers.
Competitive intensity is high, with major players like YouTube Gaming, Facebook Gaming, Twitch (owned by Amazon), and numerous smaller, region-specific platforms vying for market share. The dominance of established technology giants such as Alphabet, Meta, Amazon, and others highlights the significant investment and strategic importance of the game streaming sector. However, challenges remain, including the need for continuous infrastructure upgrades to support the increasing bandwidth demands of high-definition streaming and the ongoing competition for user attention within the broader entertainment landscape. Regional variations exist, with North America and Asia-Pacific currently dominating the market, though emerging markets in other regions are expected to contribute to significant growth in the coming years, driven by increasing internet penetration and smartphone adoption. The successful players will need to focus on providing high-quality streaming services, innovative features, and robust community support to maintain competitive advantage and capitalize on the expanding global game streaming market.
Game Streaming Industry Market Report: 2019-2033
This comprehensive report provides a detailed analysis of the game streaming market, encompassing market dynamics, growth trends, regional analysis, competitive landscape, and future outlook. The study period covers 2019-2033, with 2025 as the base and estimated year. The forecast period spans 2025-2033, and the historical period encompasses 2019-2024. This report is invaluable for industry professionals, investors, and anyone seeking a deep understanding of this rapidly evolving market.
Game Streaming Industry Market Dynamics & Structure
The game streaming market, a child market of the broader video game industry, is characterized by intense competition, rapid technological advancements, and evolving regulatory landscapes. Market concentration is moderate, with key players like YouTube (Alphabet Inc.), Facebook Gaming (Meta Platforms Inc.), and Nvidia Corporation holding significant market share, but smaller players like Parsec and others contributing significantly to innovation. The market is estimated at xx million units in 2025.
- Market Concentration: Moderate, with top 5 players holding approximately xx% of the market share in 2025.
- Technological Innovation Drivers: Advancements in cloud computing, 5G network infrastructure, and GPU technology are key drivers. Innovation barriers include high infrastructure costs and latency issues.
- Regulatory Frameworks: Vary significantly across regions, impacting data privacy, content moderation, and market access.
- Competitive Product Substitutes: Traditional console and PC gaming remain primary substitutes, although the convenience of streaming is driving adoption.
- End-User Demographics: Primarily millennials and Gen Z, with growing appeal among older gamers.
- M&A Trends: A moderate level of mergers and acquisitions activity is observed, with larger players acquiring smaller companies to expand capabilities and market reach. An estimated xx M&A deals occurred between 2019 and 2024.
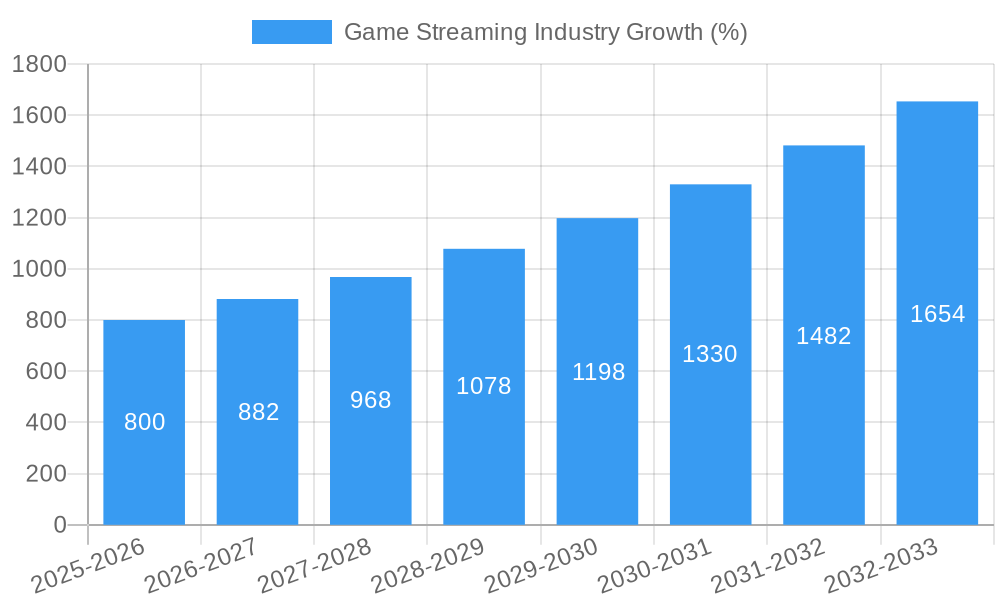
Game Streaming Industry Growth Trends & Insights
The game streaming market is experiencing robust growth, driven by increasing internet penetration, affordability of high-speed internet, and the rising popularity of mobile gaming. The market size is projected to reach xx million units by 2033, exhibiting a Compound Annual Growth Rate (CAGR) of xx% during the forecast period (2025-2033). This growth is fueled by the adoption of advanced technologies like cloud gaming, increasing demand for high-quality graphics, and the convenience of playing games across various devices. Consumer behavior is shifting towards on-demand gaming experiences, emphasizing convenience and accessibility.
Market penetration is increasing steadily, particularly in developed economies with robust infrastructure. Technological disruptions, such as the introduction of improved compression algorithms and advancements in 5G network technology, are further propelling the market's expansion. The evolution of consumer preferences towards subscription-based services also contributes significantly to market growth.
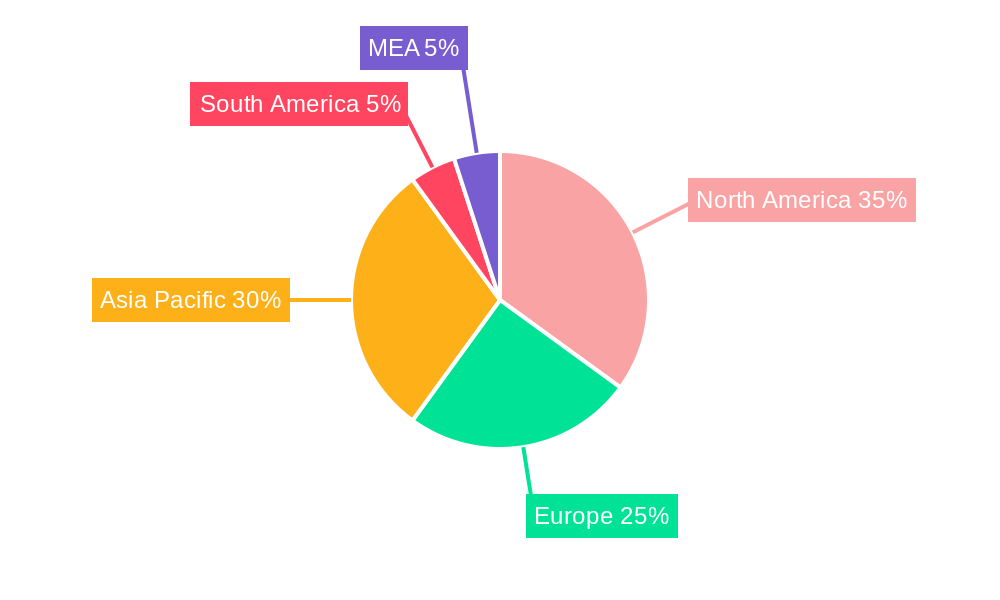
Dominant Regions, Countries, or Segments in Game Streaming Industry
North America and Asia (particularly China and South Korea) are currently the dominant regions in the game streaming market. Within the revenue model segment, the Subscription Model is showing the strongest growth potential, followed by the In-game Advertising Model. The App-Based solution segment is also exhibiting rapid growth compared to the Web-Based segment.
- Key Drivers (North America): High internet penetration, strong gaming culture, and high disposable income.
- Key Drivers (Asia): Massive gaming communities, burgeoning mobile gaming market, and government support for digital infrastructure development.
- Key Drivers (Subscription Model): Predictable revenue streams for providers, offering value to consumers through curated content libraries.
- Key Drivers (App-Based Solutions): Enhanced user experience through personalized features and offline capabilities.
- Market Share: North America holds approximately xx% of the global market share in 2025, while Asia holds approximately xx%. The Subscription Model is projected to account for xx% of total revenue in 2025.
Game Streaming Industry Product Landscape
The game streaming landscape showcases a dynamic mix of products, ranging from dedicated game streaming platforms to integrated solutions within existing gaming ecosystems. Key innovations include advancements in compression technology, improved latency management, and the seamless integration of cross-platform features. These advancements enhance game quality, reduce lag, and provide a more immersive and user-friendly experience. Unique selling propositions often revolve around exclusive game libraries, high-quality streaming capabilities, and cross-platform functionality.
Key Drivers, Barriers & Challenges in Game Streaming Industry
Key Drivers:
- Advancements in cloud computing and 5G network technologies.
- Rising demand for high-quality gaming experiences on various devices.
- Increased affordability and accessibility of high-speed internet.
Key Challenges:
- High infrastructure costs, impacting profitability for providers.
- Latency issues, hindering the overall gaming experience.
- Data security and privacy concerns.
- Regulatory hurdles related to data transfer and content regulations. These challenges lead to an estimated xx million units reduction in potential market size annually.
Emerging Opportunities in Game Streaming Industry
- Expansion into untapped markets, particularly in developing countries with increasing internet penetration.
- Development of innovative applications, such as cloud-based esports tournaments and interactive streaming experiences.
- Catering to evolving consumer preferences, including personalized content, social features, and accessibility options. These opportunities represent an estimated xx million units potential market expansion by 2033.
Growth Accelerators in the Game Streaming Industry
Technological breakthroughs in compression technology and network infrastructure are key catalysts for long-term growth. Strategic partnerships between game developers, platform providers, and network operators are expanding the ecosystem. Market expansion strategies targeting underserved regions and demographics further fuel growth.
Key Players Shaping the Game Streaming Industry Market
- Parsec (Unity Software Inc)
- YouTube (Alphabet Inc)
- Facebook Gaming (Meta Platforms Inc)
- Wuhan Douyu Network Technology Co Ltd
- Huya Inc
- Amazon com Inc
- Nvidia Corporation
- Sony Group Corporation
- Apple Inc
- Afreecatv Co Ltd
Notable Milestones in Game Streaming Industry Sector
- November 2023: Sony partnered with NCSoft to expand its mobile gaming reach.
- August 2023: GeForce NOW launched Ultimate KovvaK's challenge, enhancing user experience.
In-Depth Game Streaming Industry Market Outlook
The game streaming market is poised for continued growth, driven by technological advancements, increased consumer adoption, and strategic partnerships. Future market potential lies in expanding into emerging markets, developing innovative applications, and improving accessibility. Strategic opportunities involve partnerships with telecommunication companies to ensure a better user experience and investment in infrastructure improvement to expand the market to countries with low internet penetration. The market is poised to reach xx million units by 2033, with significant potential for further growth.
Game Streaming Industry Segmentation
-
1. Revenue Model
- 1.1. In-game Advertising Model
- 1.2. Subscription Model
- 1.3. Other Revenue Models
-
2. Solutions
-
2.1. Web Based
- 2.1.1. Twitch
- 2.1.2. YouTube
- 2.1.3. Mixer
- 2.1.4. Facebook
- 2.1.5. Dailymotion
-
2.2. App Based
- 2.2.1. Xbox Game Streaming
- 2.2.2. Remotr
- 2.2.3. Steam Link
- 2.2.4. Rainway Inc
- 2.2.5. Others
-
2.1. Web Based
Game Streaming Industry Segmentation By Geography
-
1. North America
- 1.1. United States
- 1.2. Canada
-
2. Europe
- 2.1. Germany
- 2.2. United Kingdom
-
3. Asia Pacific
- 3.1. China
- 3.2. Japan
- 3.3. India
- 3.4. South Korea
- 3.5. Australia and New Zealand
- 4. Latin America
- 5. Middle East and Africa
Game Streaming Industry REPORT HIGHLIGHTS
| Aspects | Details |
|---|---|
| Study Period | 2019-2033 |
| Base Year | 2024 |
| Estimated Year | 2025 |
| Forecast Period | 2025-2033 |
| Historical Period | 2019-2024 |
| Growth Rate | CAGR of 10.52% from 2019-2033 |
| Segmentation |
|
Table of Contents
- 1. Introduction
- 1.1. Research Scope
- 1.2. Market Segmentation
- 1.3. Research Methodology
- 1.4. Definitions and Assumptions
- 2. Executive Summary
- 2.1. Introduction
- 3. Market Dynamics
- 3.1. Introduction
- 3.2. Market Drivers
- 3.2.1. Growing Popularity of Esports and Broadcasting of Esports Events; Growth of Video Game Streaming Software for Mobile Devices
- 3.3. Market Restrains
- 3.3.1. High Cost of Content Creation
- 3.4. Market Trends
- 3.4.1. YouTube to be the Largest Web-based Solution
- 4. Market Factor Analysis
- 4.1. Porters Five Forces
- 4.2. Supply/Value Chain
- 4.3. PESTEL analysis
- 4.4. Market Entropy
- 4.5. Patent/Trademark Analysis
- 5. Global Game Streaming Industry Analysis, Insights and Forecast, 2019-2031
- 5.1. Market Analysis, Insights and Forecast - by Revenue Model
- 5.1.1. In-game Advertising Model
- 5.1.2. Subscription Model
- 5.1.3. Other Revenue Models
- 5.2. Market Analysis, Insights and Forecast - by Solutions
- 5.2.1. Web Based
- 5.2.1.1. Twitch
- 5.2.1.2. YouTube
- 5.2.1.3. Mixer
- 5.2.1.4. Facebook
- 5.2.1.5. Dailymotion
- 5.2.2. App Based
- 5.2.2.1. Xbox Game Streaming
- 5.2.2.2. Remotr
- 5.2.2.3. Steam Link
- 5.2.2.4. Rainway Inc
- 5.2.2.5. Others
- 5.2.1. Web Based
- 5.3. Market Analysis, Insights and Forecast - by Region
- 5.3.1. North America
- 5.3.2. Europe
- 5.3.3. Asia Pacific
- 5.3.4. Latin America
- 5.3.5. Middle East and Africa
- 5.1. Market Analysis, Insights and Forecast - by Revenue Model
- 6. North America Game Streaming Industry Analysis, Insights and Forecast, 2019-2031
- 6.1. Market Analysis, Insights and Forecast - by Revenue Model
- 6.1.1. In-game Advertising Model
- 6.1.2. Subscription Model
- 6.1.3. Other Revenue Models
- 6.2. Market Analysis, Insights and Forecast - by Solutions
- 6.2.1. Web Based
- 6.2.1.1. Twitch
- 6.2.1.2. YouTube
- 6.2.1.3. Mixer
- 6.2.1.4. Facebook
- 6.2.1.5. Dailymotion
- 6.2.2. App Based
- 6.2.2.1. Xbox Game Streaming
- 6.2.2.2. Remotr
- 6.2.2.3. Steam Link
- 6.2.2.4. Rainway Inc
- 6.2.2.5. Others
- 6.2.1. Web Based
- 6.1. Market Analysis, Insights and Forecast - by Revenue Model
- 7. Europe Game Streaming Industry Analysis, Insights and Forecast, 2019-2031
- 7.1. Market Analysis, Insights and Forecast - by Revenue Model
- 7.1.1. In-game Advertising Model
- 7.1.2. Subscription Model
- 7.1.3. Other Revenue Models
- 7.2. Market Analysis, Insights and Forecast - by Solutions
- 7.2.1. Web Based
- 7.2.1.1. Twitch
- 7.2.1.2. YouTube
- 7.2.1.3. Mixer
- 7.2.1.4. Facebook
- 7.2.1.5. Dailymotion
- 7.2.2. App Based
- 7.2.2.1. Xbox Game Streaming
- 7.2.2.2. Remotr
- 7.2.2.3. Steam Link
- 7.2.2.4. Rainway Inc
- 7.2.2.5. Others
- 7.2.1. Web Based
- 7.1. Market Analysis, Insights and Forecast - by Revenue Model
- 8. Asia Pacific Game Streaming Industry Analysis, Insights and Forecast, 2019-2031
- 8.1. Market Analysis, Insights and Forecast - by Revenue Model
- 8.1.1. In-game Advertising Model
- 8.1.2. Subscription Model
- 8.1.3. Other Revenue Models
- 8.2. Market Analysis, Insights and Forecast - by Solutions
- 8.2.1. Web Based
- 8.2.1.1. Twitch
- 8.2.1.2. YouTube
- 8.2.1.3. Mixer
- 8.2.1.4. Facebook
- 8.2.1.5. Dailymotion
- 8.2.2. App Based
- 8.2.2.1. Xbox Game Streaming
- 8.2.2.2. Remotr
- 8.2.2.3. Steam Link
- 8.2.2.4. Rainway Inc
- 8.2.2.5. Others
- 8.2.1. Web Based
- 8.1. Market Analysis, Insights and Forecast - by Revenue Model
- 9. Latin America Game Streaming Industry Analysis, Insights and Forecast, 2019-2031
- 9.1. Market Analysis, Insights and Forecast - by Revenue Model
- 9.1.1. In-game Advertising Model
- 9.1.2. Subscription Model
- 9.1.3. Other Revenue Models
- 9.2. Market Analysis, Insights and Forecast - by Solutions
- 9.2.1. Web Based
- 9.2.1.1. Twitch
- 9.2.1.2. YouTube
- 9.2.1.3. Mixer
- 9.2.1.4. Facebook
- 9.2.1.5. Dailymotion
- 9.2.2. App Based
- 9.2.2.1. Xbox Game Streaming
- 9.2.2.2. Remotr
- 9.2.2.3. Steam Link
- 9.2.2.4. Rainway Inc
- 9.2.2.5. Others
- 9.2.1. Web Based
- 9.1. Market Analysis, Insights and Forecast - by Revenue Model
- 10. Middle East and Africa Game Streaming Industry Analysis, Insights and Forecast, 2019-2031
- 10.1. Market Analysis, Insights and Forecast - by Revenue Model
- 10.1.1. In-game Advertising Model
- 10.1.2. Subscription Model
- 10.1.3. Other Revenue Models
- 10.2. Market Analysis, Insights and Forecast - by Solutions
- 10.2.1. Web Based
- 10.2.1.1. Twitch
- 10.2.1.2. YouTube
- 10.2.1.3. Mixer
- 10.2.1.4. Facebook
- 10.2.1.5. Dailymotion
- 10.2.2. App Based
- 10.2.2.1. Xbox Game Streaming
- 10.2.2.2. Remotr
- 10.2.2.3. Steam Link
- 10.2.2.4. Rainway Inc
- 10.2.2.5. Others
- 10.2.1. Web Based
- 10.1. Market Analysis, Insights and Forecast - by Revenue Model
- 11. North America Game Streaming Industry Analysis, Insights and Forecast, 2019-2031
- 11.1. Market Analysis, Insights and Forecast - By Country/Sub-region
- 11.1.1 United States
- 11.1.2 Canada
- 11.1.3 Mexico
- 12. Europe Game Streaming Industry Analysis, Insights and Forecast, 2019-2031
- 12.1. Market Analysis, Insights and Forecast - By Country/Sub-region
- 12.1.1 Germany
- 12.1.2 United Kingdom
- 12.1.3 France
- 12.1.4 Spain
- 12.1.5 Italy
- 12.1.6 Spain
- 12.1.7 Belgium
- 12.1.8 Netherland
- 12.1.9 Nordics
- 12.1.10 Rest of Europe
- 13. Asia Pacific Game Streaming Industry Analysis, Insights and Forecast, 2019-2031
- 13.1. Market Analysis, Insights and Forecast - By Country/Sub-region
- 13.1.1 China
- 13.1.2 Japan
- 13.1.3 India
- 13.1.4 South Korea
- 13.1.5 Southeast Asia
- 13.1.6 Australia
- 13.1.7 Indonesia
- 13.1.8 Phillipes
- 13.1.9 Singapore
- 13.1.10 Thailandc
- 13.1.11 Rest of Asia Pacific
- 14. South America Game Streaming Industry Analysis, Insights and Forecast, 2019-2031
- 14.1. Market Analysis, Insights and Forecast - By Country/Sub-region
- 14.1.1 Brazil
- 14.1.2 Argentina
- 14.1.3 Peru
- 14.1.4 Chile
- 14.1.5 Colombia
- 14.1.6 Ecuador
- 14.1.7 Venezuela
- 14.1.8 Rest of South America
- 15. North America Game Streaming Industry Analysis, Insights and Forecast, 2019-2031
- 15.1. Market Analysis, Insights and Forecast - By Country/Sub-region
- 15.1.1 United States
- 15.1.2 Canada
- 15.1.3 Mexico
- 16. MEA Game Streaming Industry Analysis, Insights and Forecast, 2019-2031
- 16.1. Market Analysis, Insights and Forecast - By Country/Sub-region
- 16.1.1 United Arab Emirates
- 16.1.2 Saudi Arabia
- 16.1.3 South Africa
- 16.1.4 Rest of Middle East and Africa
- 17. Competitive Analysis
- 17.1. Global Market Share Analysis 2024
- 17.2. Company Profiles
- 17.2.1 Parsec (Unity Software Inc )
- 17.2.1.1. Overview
- 17.2.1.2. Products
- 17.2.1.3. SWOT Analysis
- 17.2.1.4. Recent Developments
- 17.2.1.5. Financials (Based on Availability)
- 17.2.2 Youtube (Alphabet Inc )
- 17.2.2.1. Overview
- 17.2.2.2. Products
- 17.2.2.3. SWOT Analysis
- 17.2.2.4. Recent Developments
- 17.2.2.5. Financials (Based on Availability)
- 17.2.3 Facebook Gaming (Meta Platforms Inc )
- 17.2.3.1. Overview
- 17.2.3.2. Products
- 17.2.3.3. SWOT Analysis
- 17.2.3.4. Recent Developments
- 17.2.3.5. Financials (Based on Availability)
- 17.2.4 Wuhan Douyu Network Technology Co Ltd
- 17.2.4.1. Overview
- 17.2.4.2. Products
- 17.2.4.3. SWOT Analysis
- 17.2.4.4. Recent Developments
- 17.2.4.5. Financials (Based on Availability)
- 17.2.5 Huya Inc
- 17.2.5.1. Overview
- 17.2.5.2. Products
- 17.2.5.3. SWOT Analysis
- 17.2.5.4. Recent Developments
- 17.2.5.5. Financials (Based on Availability)
- 17.2.6 Amazon com Inc
- 17.2.6.1. Overview
- 17.2.6.2. Products
- 17.2.6.3. SWOT Analysis
- 17.2.6.4. Recent Developments
- 17.2.6.5. Financials (Based on Availability)
- 17.2.7 Nvidia Corporation
- 17.2.7.1. Overview
- 17.2.7.2. Products
- 17.2.7.3. SWOT Analysis
- 17.2.7.4. Recent Developments
- 17.2.7.5. Financials (Based on Availability)
- 17.2.8 Sony Group Corporatio
- 17.2.8.1. Overview
- 17.2.8.2. Products
- 17.2.8.3. SWOT Analysis
- 17.2.8.4. Recent Developments
- 17.2.8.5. Financials (Based on Availability)
- 17.2.9 Apple Inc
- 17.2.9.1. Overview
- 17.2.9.2. Products
- 17.2.9.3. SWOT Analysis
- 17.2.9.4. Recent Developments
- 17.2.9.5. Financials (Based on Availability)
- 17.2.10 Afreecatv Co Ltd
- 17.2.10.1. Overview
- 17.2.10.2. Products
- 17.2.10.3. SWOT Analysis
- 17.2.10.4. Recent Developments
- 17.2.10.5. Financials (Based on Availability)
- 17.2.1 Parsec (Unity Software Inc )
List of Figures
- Figure 1: Global Game Streaming Industry Revenue Breakdown (Million, %) by Region 2024 & 2032
- Figure 2: Global Game Streaming Industry Volume Breakdown (K Unit, %) by Region 2024 & 2032
- Figure 3: North America Game Streaming Industry Revenue (Million), by Country 2024 & 2032
- Figure 4: North America Game Streaming Industry Volume (K Unit), by Country 2024 & 2032
- Figure 5: North America Game Streaming Industry Revenue Share (%), by Country 2024 & 2032
- Figure 6: North America Game Streaming Industry Volume Share (%), by Country 2024 & 2032
- Figure 7: Europe Game Streaming Industry Revenue (Million), by Country 2024 & 2032
- Figure 8: Europe Game Streaming Industry Volume (K Unit), by Country 2024 & 2032
- Figure 9: Europe Game Streaming Industry Revenue Share (%), by Country 2024 & 2032
- Figure 10: Europe Game Streaming Industry Volume Share (%), by Country 2024 & 2032
- Figure 11: Asia Pacific Game Streaming Industry Revenue (Million), by Country 2024 & 2032
- Figure 12: Asia Pacific Game Streaming Industry Volume (K Unit), by Country 2024 & 2032
- Figure 13: Asia Pacific Game Streaming Industry Revenue Share (%), by Country 2024 & 2032
- Figure 14: Asia Pacific Game Streaming Industry Volume Share (%), by Country 2024 & 2032
- Figure 15: South America Game Streaming Industry Revenue (Million), by Country 2024 & 2032
- Figure 16: South America Game Streaming Industry Volume (K Unit), by Country 2024 & 2032
- Figure 17: South America Game Streaming Industry Revenue Share (%), by Country 2024 & 2032
- Figure 18: South America Game Streaming Industry Volume Share (%), by Country 2024 & 2032
- Figure 19: North America Game Streaming Industry Revenue (Million), by Country 2024 & 2032
- Figure 20: North America Game Streaming Industry Volume (K Unit), by Country 2024 & 2032
- Figure 21: North America Game Streaming Industry Revenue Share (%), by Country 2024 & 2032
- Figure 22: North America Game Streaming Industry Volume Share (%), by Country 2024 & 2032
- Figure 23: MEA Game Streaming Industry Revenue (Million), by Country 2024 & 2032
- Figure 24: MEA Game Streaming Industry Volume (K Unit), by Country 2024 & 2032
- Figure 25: MEA Game Streaming Industry Revenue Share (%), by Country 2024 & 2032
- Figure 26: MEA Game Streaming Industry Volume Share (%), by Country 2024 & 2032
- Figure 27: North America Game Streaming Industry Revenue (Million), by Revenue Model 2024 & 2032
- Figure 28: North America Game Streaming Industry Volume (K Unit), by Revenue Model 2024 & 2032
- Figure 29: North America Game Streaming Industry Revenue Share (%), by Revenue Model 2024 & 2032
- Figure 30: North America Game Streaming Industry Volume Share (%), by Revenue Model 2024 & 2032
- Figure 31: North America Game Streaming Industry Revenue (Million), by Solutions 2024 & 2032
- Figure 32: North America Game Streaming Industry Volume (K Unit), by Solutions 2024 & 2032
- Figure 33: North America Game Streaming Industry Revenue Share (%), by Solutions 2024 & 2032
- Figure 34: North America Game Streaming Industry Volume Share (%), by Solutions 2024 & 2032
- Figure 35: North America Game Streaming Industry Revenue (Million), by Country 2024 & 2032
- Figure 36: North America Game Streaming Industry Volume (K Unit), by Country 2024 & 2032
- Figure 37: North America Game Streaming Industry Revenue Share (%), by Country 2024 & 2032
- Figure 38: North America Game Streaming Industry Volume Share (%), by Country 2024 & 2032
- Figure 39: Europe Game Streaming Industry Revenue (Million), by Revenue Model 2024 & 2032
- Figure 40: Europe Game Streaming Industry Volume (K Unit), by Revenue Model 2024 & 2032
- Figure 41: Europe Game Streaming Industry Revenue Share (%), by Revenue Model 2024 & 2032
- Figure 42: Europe Game Streaming Industry Volume Share (%), by Revenue Model 2024 & 2032
- Figure 43: Europe Game Streaming Industry Revenue (Million), by Solutions 2024 & 2032
- Figure 44: Europe Game Streaming Industry Volume (K Unit), by Solutions 2024 & 2032
- Figure 45: Europe Game Streaming Industry Revenue Share (%), by Solutions 2024 & 2032
- Figure 46: Europe Game Streaming Industry Volume Share (%), by Solutions 2024 & 2032
- Figure 47: Europe Game Streaming Industry Revenue (Million), by Country 2024 & 2032
- Figure 48: Europe Game Streaming Industry Volume (K Unit), by Country 2024 & 2032
- Figure 49: Europe Game Streaming Industry Revenue Share (%), by Country 2024 & 2032
- Figure 50: Europe Game Streaming Industry Volume Share (%), by Country 2024 & 2032
- Figure 51: Asia Pacific Game Streaming Industry Revenue (Million), by Revenue Model 2024 & 2032
- Figure 52: Asia Pacific Game Streaming Industry Volume (K Unit), by Revenue Model 2024 & 2032
- Figure 53: Asia Pacific Game Streaming Industry Revenue Share (%), by Revenue Model 2024 & 2032
- Figure 54: Asia Pacific Game Streaming Industry Volume Share (%), by Revenue Model 2024 & 2032
- Figure 55: Asia Pacific Game Streaming Industry Revenue (Million), by Solutions 2024 & 2032
- Figure 56: Asia Pacific Game Streaming Industry Volume (K Unit), by Solutions 2024 & 2032
- Figure 57: Asia Pacific Game Streaming Industry Revenue Share (%), by Solutions 2024 & 2032
- Figure 58: Asia Pacific Game Streaming Industry Volume Share (%), by Solutions 2024 & 2032
- Figure 59: Asia Pacific Game Streaming Industry Revenue (Million), by Country 2024 & 2032
- Figure 60: Asia Pacific Game Streaming Industry Volume (K Unit), by Country 2024 & 2032
- Figure 61: Asia Pacific Game Streaming Industry Revenue Share (%), by Country 2024 & 2032
- Figure 62: Asia Pacific Game Streaming Industry Volume Share (%), by Country 2024 & 2032
- Figure 63: Latin America Game Streaming Industry Revenue (Million), by Revenue Model 2024 & 2032
- Figure 64: Latin America Game Streaming Industry Volume (K Unit), by Revenue Model 2024 & 2032
- Figure 65: Latin America Game Streaming Industry Revenue Share (%), by Revenue Model 2024 & 2032
- Figure 66: Latin America Game Streaming Industry Volume Share (%), by Revenue Model 2024 & 2032
- Figure 67: Latin America Game Streaming Industry Revenue (Million), by Solutions 2024 & 2032
- Figure 68: Latin America Game Streaming Industry Volume (K Unit), by Solutions 2024 & 2032
- Figure 69: Latin America Game Streaming Industry Revenue Share (%), by Solutions 2024 & 2032
- Figure 70: Latin America Game Streaming Industry Volume Share (%), by Solutions 2024 & 2032
- Figure 71: Latin America Game Streaming Industry Revenue (Million), by Country 2024 & 2032
- Figure 72: Latin America Game Streaming Industry Volume (K Unit), by Country 2024 & 2032
- Figure 73: Latin America Game Streaming Industry Revenue Share (%), by Country 2024 & 2032
- Figure 74: Latin America Game Streaming Industry Volume Share (%), by Country 2024 & 2032
- Figure 75: Middle East and Africa Game Streaming Industry Revenue (Million), by Revenue Model 2024 & 2032
- Figure 76: Middle East and Africa Game Streaming Industry Volume (K Unit), by Revenue Model 2024 & 2032
- Figure 77: Middle East and Africa Game Streaming Industry Revenue Share (%), by Revenue Model 2024 & 2032
- Figure 78: Middle East and Africa Game Streaming Industry Volume Share (%), by Revenue Model 2024 & 2032
- Figure 79: Middle East and Africa Game Streaming Industry Revenue (Million), by Solutions 2024 & 2032
- Figure 80: Middle East and Africa Game Streaming Industry Volume (K Unit), by Solutions 2024 & 2032
- Figure 81: Middle East and Africa Game Streaming Industry Revenue Share (%), by Solutions 2024 & 2032
- Figure 82: Middle East and Africa Game Streaming Industry Volume Share (%), by Solutions 2024 & 2032
- Figure 83: Middle East and Africa Game Streaming Industry Revenue (Million), by Country 2024 & 2032
- Figure 84: Middle East and Africa Game Streaming Industry Volume (K Unit), by Country 2024 & 2032
- Figure 85: Middle East and Africa Game Streaming Industry Revenue Share (%), by Country 2024 & 2032
- Figure 86: Middle East and Africa Game Streaming Industry Volume Share (%), by Country 2024 & 2032
List of Tables
- Table 1: Global Game Streaming Industry Revenue Million Forecast, by Region 2019 & 2032
- Table 2: Global Game Streaming Industry Volume K Unit Forecast, by Region 2019 & 2032
- Table 3: Global Game Streaming Industry Revenue Million Forecast, by Revenue Model 2019 & 2032
- Table 4: Global Game Streaming Industry Volume K Unit Forecast, by Revenue Model 2019 & 2032
- Table 5: Global Game Streaming Industry Revenue Million Forecast, by Solutions 2019 & 2032
- Table 6: Global Game Streaming Industry Volume K Unit Forecast, by Solutions 2019 & 2032
- Table 7: Global Game Streaming Industry Revenue Million Forecast, by Region 2019 & 2032
- Table 8: Global Game Streaming Industry Volume K Unit Forecast, by Region 2019 & 2032
- Table 9: Global Game Streaming Industry Revenue Million Forecast, by Country 2019 & 2032
- Table 10: Global Game Streaming Industry Volume K Unit Forecast, by Country 2019 & 2032
- Table 11: United States Game Streaming Industry Revenue (Million) Forecast, by Application 2019 & 2032
- Table 12: United States Game Streaming Industry Volume (K Unit) Forecast, by Application 2019 & 2032
- Table 13: Canada Game Streaming Industry Revenue (Million) Forecast, by Application 2019 & 2032
- Table 14: Canada Game Streaming Industry Volume (K Unit) Forecast, by Application 2019 & 2032
- Table 15: Mexico Game Streaming Industry Revenue (Million) Forecast, by Application 2019 & 2032
- Table 16: Mexico Game Streaming Industry Volume (K Unit) Forecast, by Application 2019 & 2032
- Table 17: Global Game Streaming Industry Revenue Million Forecast, by Country 2019 & 2032
- Table 18: Global Game Streaming Industry Volume K Unit Forecast, by Country 2019 & 2032
- Table 19: Germany Game Streaming Industry Revenue (Million) Forecast, by Application 2019 & 2032
- Table 20: Germany Game Streaming Industry Volume (K Unit) Forecast, by Application 2019 & 2032
- Table 21: United Kingdom Game Streaming Industry Revenue (Million) Forecast, by Application 2019 & 2032
- Table 22: United Kingdom Game Streaming Industry Volume (K Unit) Forecast, by Application 2019 & 2032
- Table 23: France Game Streaming Industry Revenue (Million) Forecast, by Application 2019 & 2032
- Table 24: France Game Streaming Industry Volume (K Unit) Forecast, by Application 2019 & 2032
- Table 25: Spain Game Streaming Industry Revenue (Million) Forecast, by Application 2019 & 2032
- Table 26: Spain Game Streaming Industry Volume (K Unit) Forecast, by Application 2019 & 2032
- Table 27: Italy Game Streaming Industry Revenue (Million) Forecast, by Application 2019 & 2032
- Table 28: Italy Game Streaming Industry Volume (K Unit) Forecast, by Application 2019 & 2032
- Table 29: Spain Game Streaming Industry Revenue (Million) Forecast, by Application 2019 & 2032
- Table 30: Spain Game Streaming Industry Volume (K Unit) Forecast, by Application 2019 & 2032
- Table 31: Belgium Game Streaming Industry Revenue (Million) Forecast, by Application 2019 & 2032
- Table 32: Belgium Game Streaming Industry Volume (K Unit) Forecast, by Application 2019 & 2032
- Table 33: Netherland Game Streaming Industry Revenue (Million) Forecast, by Application 2019 & 2032
- Table 34: Netherland Game Streaming Industry Volume (K Unit) Forecast, by Application 2019 & 2032
- Table 35: Nordics Game Streaming Industry Revenue (Million) Forecast, by Application 2019 & 2032
- Table 36: Nordics Game Streaming Industry Volume (K Unit) Forecast, by Application 2019 & 2032
- Table 37: Rest of Europe Game Streaming Industry Revenue (Million) Forecast, by Application 2019 & 2032
- Table 38: Rest of Europe Game Streaming Industry Volume (K Unit) Forecast, by Application 2019 & 2032
- Table 39: Global Game Streaming Industry Revenue Million Forecast, by Country 2019 & 2032
- Table 40: Global Game Streaming Industry Volume K Unit Forecast, by Country 2019 & 2032
- Table 41: China Game Streaming Industry Revenue (Million) Forecast, by Application 2019 & 2032
- Table 42: China Game Streaming Industry Volume (K Unit) Forecast, by Application 2019 & 2032
- Table 43: Japan Game Streaming Industry Revenue (Million) Forecast, by Application 2019 & 2032
- Table 44: Japan Game Streaming Industry Volume (K Unit) Forecast, by Application 2019 & 2032
- Table 45: India Game Streaming Industry Revenue (Million) Forecast, by Application 2019 & 2032
- Table 46: India Game Streaming Industry Volume (K Unit) Forecast, by Application 2019 & 2032
- Table 47: South Korea Game Streaming Industry Revenue (Million) Forecast, by Application 2019 & 2032
- Table 48: South Korea Game Streaming Industry Volume (K Unit) Forecast, by Application 2019 & 2032
- Table 49: Southeast Asia Game Streaming Industry Revenue (Million) Forecast, by Application 2019 & 2032
- Table 50: Southeast Asia Game Streaming Industry Volume (K Unit) Forecast, by Application 2019 & 2032
- Table 51: Australia Game Streaming Industry Revenue (Million) Forecast, by Application 2019 & 2032
- Table 52: Australia Game Streaming Industry Volume (K Unit) Forecast, by Application 2019 & 2032
- Table 53: Indonesia Game Streaming Industry Revenue (Million) Forecast, by Application 2019 & 2032
- Table 54: Indonesia Game Streaming Industry Volume (K Unit) Forecast, by Application 2019 & 2032
- Table 55: Phillipes Game Streaming Industry Revenue (Million) Forecast, by Application 2019 & 2032
- Table 56: Phillipes Game Streaming Industry Volume (K Unit) Forecast, by Application 2019 & 2032
- Table 57: Singapore Game Streaming Industry Revenue (Million) Forecast, by Application 2019 & 2032
- Table 58: Singapore Game Streaming Industry Volume (K Unit) Forecast, by Application 2019 & 2032
- Table 59: Thailandc Game Streaming Industry Revenue (Million) Forecast, by Application 2019 & 2032
- Table 60: Thailandc Game Streaming Industry Volume (K Unit) Forecast, by Application 2019 & 2032
- Table 61: Rest of Asia Pacific Game Streaming Industry Revenue (Million) Forecast, by Application 2019 & 2032
- Table 62: Rest of Asia Pacific Game Streaming Industry Volume (K Unit) Forecast, by Application 2019 & 2032
- Table 63: Global Game Streaming Industry Revenue Million Forecast, by Country 2019 & 2032
- Table 64: Global Game Streaming Industry Volume K Unit Forecast, by Country 2019 & 2032
- Table 65: Brazil Game Streaming Industry Revenue (Million) Forecast, by Application 2019 & 2032
- Table 66: Brazil Game Streaming Industry Volume (K Unit) Forecast, by Application 2019 & 2032
- Table 67: Argentina Game Streaming Industry Revenue (Million) Forecast, by Application 2019 & 2032
- Table 68: Argentina Game Streaming Industry Volume (K Unit) Forecast, by Application 2019 & 2032
- Table 69: Peru Game Streaming Industry Revenue (Million) Forecast, by Application 2019 & 2032
- Table 70: Peru Game Streaming Industry Volume (K Unit) Forecast, by Application 2019 & 2032
- Table 71: Chile Game Streaming Industry Revenue (Million) Forecast, by Application 2019 & 2032
- Table 72: Chile Game Streaming Industry Volume (K Unit) Forecast, by Application 2019 & 2032
- Table 73: Colombia Game Streaming Industry Revenue (Million) Forecast, by Application 2019 & 2032
- Table 74: Colombia Game Streaming Industry Volume (K Unit) Forecast, by Application 2019 & 2032
- Table 75: Ecuador Game Streaming Industry Revenue (Million) Forecast, by Application 2019 & 2032
- Table 76: Ecuador Game Streaming Industry Volume (K Unit) Forecast, by Application 2019 & 2032
- Table 77: Venezuela Game Streaming Industry Revenue (Million) Forecast, by Application 2019 & 2032
- Table 78: Venezuela Game Streaming Industry Volume (K Unit) Forecast, by Application 2019 & 2032
- Table 79: Rest of South America Game Streaming Industry Revenue (Million) Forecast, by Application 2019 & 2032
- Table 80: Rest of South America Game Streaming Industry Volume (K Unit) Forecast, by Application 2019 & 2032
- Table 81: Global Game Streaming Industry Revenue Million Forecast, by Country 2019 & 2032
- Table 82: Global Game Streaming Industry Volume K Unit Forecast, by Country 2019 & 2032
- Table 83: United States Game Streaming Industry Revenue (Million) Forecast, by Application 2019 & 2032
- Table 84: United States Game Streaming Industry Volume (K Unit) Forecast, by Application 2019 & 2032
- Table 85: Canada Game Streaming Industry Revenue (Million) Forecast, by Application 2019 & 2032
- Table 86: Canada Game Streaming Industry Volume (K Unit) Forecast, by Application 2019 & 2032
- Table 87: Mexico Game Streaming Industry Revenue (Million) Forecast, by Application 2019 & 2032
- Table 88: Mexico Game Streaming Industry Volume (K Unit) Forecast, by Application 2019 & 2032
- Table 89: Global Game Streaming Industry Revenue Million Forecast, by Country 2019 & 2032
- Table 90: Global Game Streaming Industry Volume K Unit Forecast, by Country 2019 & 2032
- Table 91: United Arab Emirates Game Streaming Industry Revenue (Million) Forecast, by Application 2019 & 2032
- Table 92: United Arab Emirates Game Streaming Industry Volume (K Unit) Forecast, by Application 2019 & 2032
- Table 93: Saudi Arabia Game Streaming Industry Revenue (Million) Forecast, by Application 2019 & 2032
- Table 94: Saudi Arabia Game Streaming Industry Volume (K Unit) Forecast, by Application 2019 & 2032
- Table 95: South Africa Game Streaming Industry Revenue (Million) Forecast, by Application 2019 & 2032
- Table 96: South Africa Game Streaming Industry Volume (K Unit) Forecast, by Application 2019 & 2032
- Table 97: Rest of Middle East and Africa Game Streaming Industry Revenue (Million) Forecast, by Application 2019 & 2032
- Table 98: Rest of Middle East and Africa Game Streaming Industry Volume (K Unit) Forecast, by Application 2019 & 2032
- Table 99: Global Game Streaming Industry Revenue Million Forecast, by Revenue Model 2019 & 2032
- Table 100: Global Game Streaming Industry Volume K Unit Forecast, by Revenue Model 2019 & 2032
- Table 101: Global Game Streaming Industry Revenue Million Forecast, by Solutions 2019 & 2032
- Table 102: Global Game Streaming Industry Volume K Unit Forecast, by Solutions 2019 & 2032
- Table 103: Global Game Streaming Industry Revenue Million Forecast, by Country 2019 & 2032
- Table 104: Global Game Streaming Industry Volume K Unit Forecast, by Country 2019 & 2032
- Table 105: United States Game Streaming Industry Revenue (Million) Forecast, by Application 2019 & 2032
- Table 106: United States Game Streaming Industry Volume (K Unit) Forecast, by Application 2019 & 2032
- Table 107: Canada Game Streaming Industry Revenue (Million) Forecast, by Application 2019 & 2032
- Table 108: Canada Game Streaming Industry Volume (K Unit) Forecast, by Application 2019 & 2032
- Table 109: Global Game Streaming Industry Revenue Million Forecast, by Revenue Model 2019 & 2032
- Table 110: Global Game Streaming Industry Volume K Unit Forecast, by Revenue Model 2019 & 2032
- Table 111: Global Game Streaming Industry Revenue Million Forecast, by Solutions 2019 & 2032
- Table 112: Global Game Streaming Industry Volume K Unit Forecast, by Solutions 2019 & 2032
- Table 113: Global Game Streaming Industry Revenue Million Forecast, by Country 2019 & 2032
- Table 114: Global Game Streaming Industry Volume K Unit Forecast, by Country 2019 & 2032
- Table 115: Germany Game Streaming Industry Revenue (Million) Forecast, by Application 2019 & 2032
- Table 116: Germany Game Streaming Industry Volume (K Unit) Forecast, by Application 2019 & 2032
- Table 117: United Kingdom Game Streaming Industry Revenue (Million) Forecast, by Application 2019 & 2032
- Table 118: United Kingdom Game Streaming Industry Volume (K Unit) Forecast, by Application 2019 & 2032
- Table 119: Global Game Streaming Industry Revenue Million Forecast, by Revenue Model 2019 & 2032
- Table 120: Global Game Streaming Industry Volume K Unit Forecast, by Revenue Model 2019 & 2032
- Table 121: Global Game Streaming Industry Revenue Million Forecast, by Solutions 2019 & 2032
- Table 122: Global Game Streaming Industry Volume K Unit Forecast, by Solutions 2019 & 2032
- Table 123: Global Game Streaming Industry Revenue Million Forecast, by Country 2019 & 2032
- Table 124: Global Game Streaming Industry Volume K Unit Forecast, by Country 2019 & 2032
- Table 125: China Game Streaming Industry Revenue (Million) Forecast, by Application 2019 & 2032
- Table 126: China Game Streaming Industry Volume (K Unit) Forecast, by Application 2019 & 2032
- Table 127: Japan Game Streaming Industry Revenue (Million) Forecast, by Application 2019 & 2032
- Table 128: Japan Game Streaming Industry Volume (K Unit) Forecast, by Application 2019 & 2032
- Table 129: India Game Streaming Industry Revenue (Million) Forecast, by Application 2019 & 2032
- Table 130: India Game Streaming Industry Volume (K Unit) Forecast, by Application 2019 & 2032
- Table 131: South Korea Game Streaming Industry Revenue (Million) Forecast, by Application 2019 & 2032
- Table 132: South Korea Game Streaming Industry Volume (K Unit) Forecast, by Application 2019 & 2032
- Table 133: Australia and New Zealand Game Streaming Industry Revenue (Million) Forecast, by Application 2019 & 2032
- Table 134: Australia and New Zealand Game Streaming Industry Volume (K Unit) Forecast, by Application 2019 & 2032
- Table 135: Global Game Streaming Industry Revenue Million Forecast, by Revenue Model 2019 & 2032
- Table 136: Global Game Streaming Industry Volume K Unit Forecast, by Revenue Model 2019 & 2032
- Table 137: Global Game Streaming Industry Revenue Million Forecast, by Solutions 2019 & 2032
- Table 138: Global Game Streaming Industry Volume K Unit Forecast, by Solutions 2019 & 2032
- Table 139: Global Game Streaming Industry Revenue Million Forecast, by Country 2019 & 2032
- Table 140: Global Game Streaming Industry Volume K Unit Forecast, by Country 2019 & 2032
- Table 141: Global Game Streaming Industry Revenue Million Forecast, by Revenue Model 2019 & 2032
- Table 142: Global Game Streaming Industry Volume K Unit Forecast, by Revenue Model 2019 & 2032
- Table 143: Global Game Streaming Industry Revenue Million Forecast, by Solutions 2019 & 2032
- Table 144: Global Game Streaming Industry Volume K Unit Forecast, by Solutions 2019 & 2032
- Table 145: Global Game Streaming Industry Revenue Million Forecast, by Country 2019 & 2032
- Table 146: Global Game Streaming Industry Volume K Unit Forecast, by Country 2019 & 2032
Frequently Asked Questions
1. What is the projected Compound Annual Growth Rate (CAGR) of the Game Streaming Industry?
The projected CAGR is approximately 10.52%.
2. Which companies are prominent players in the Game Streaming Industry?
Key companies in the market include Parsec (Unity Software Inc ), Youtube (Alphabet Inc ), Facebook Gaming (Meta Platforms Inc ), Wuhan Douyu Network Technology Co Ltd, Huya Inc, Amazon com Inc, Nvidia Corporation, Sony Group Corporatio, Apple Inc, Afreecatv Co Ltd.
3. What are the main segments of the Game Streaming Industry?
The market segments include Revenue Model, Solutions.
4. Can you provide details about the market size?
The market size is estimated to be USD 7.60 Million as of 2022.
5. What are some drivers contributing to market growth?
Growing Popularity of Esports and Broadcasting of Esports Events; Growth of Video Game Streaming Software for Mobile Devices.
6. What are the notable trends driving market growth?
YouTube to be the Largest Web-based Solution.
7. Are there any restraints impacting market growth?
High Cost of Content Creation.
8. Can you provide examples of recent developments in the market?
November 2023 - Sony partnered with NCSoft to have a notable role in developing and releasing these mobile games to expand beyond the console and broaden PlayStation's reach to a broader audience, which can support the company's growth in the future.
9. What pricing options are available for accessing the report?
Pricing options include single-user, multi-user, and enterprise licenses priced at USD 4750, USD 5250, and USD 8750 respectively.
10. Is the market size provided in terms of value or volume?
The market size is provided in terms of value, measured in Million and volume, measured in K Unit.
11. Are there any specific market keywords associated with the report?
Yes, the market keyword associated with the report is "Game Streaming Industry," which aids in identifying and referencing the specific market segment covered.
12. How do I determine which pricing option suits my needs best?
The pricing options vary based on user requirements and access needs. Individual users may opt for single-user licenses, while businesses requiring broader access may choose multi-user or enterprise licenses for cost-effective access to the report.
13. Are there any additional resources or data provided in the Game Streaming Industry report?
While the report offers comprehensive insights, it's advisable to review the specific contents or supplementary materials provided to ascertain if additional resources or data are available.
14. How can I stay updated on further developments or reports in the Game Streaming Industry?
To stay informed about further developments, trends, and reports in the Game Streaming Industry, consider subscribing to industry newsletters, following relevant companies and organizations, or regularly checking reputable industry news sources and publications.
Methodology
Step 1 - Identification of Relevant Samples Size from Population Database


Step 2 - Approaches for Defining Global Market Size (Value, Volume* & Price*)

Note*: In applicable scenarios
Step 3 - Data Sources
Primary Research
- Web Analytics
- Survey Reports
- Research Institute
- Latest Research Reports
- Opinion Leaders
Secondary Research
- Annual Reports
- White Paper
- Latest Press Release
- Industry Association
- Paid Database
- Investor Presentations

Step 4 - Data Triangulation
Involves using different sources of information in order to increase the validity of a study
These sources are likely to be stakeholders in a program - participants, other researchers, program staff, other community members, and so on.
Then we put all data in single framework & apply various statistical tools to find out the dynamic on the market.
During the analysis stage, feedback from the stakeholder groups would be compared to determine areas of agreement as well as areas of divergence


