
Key Insights
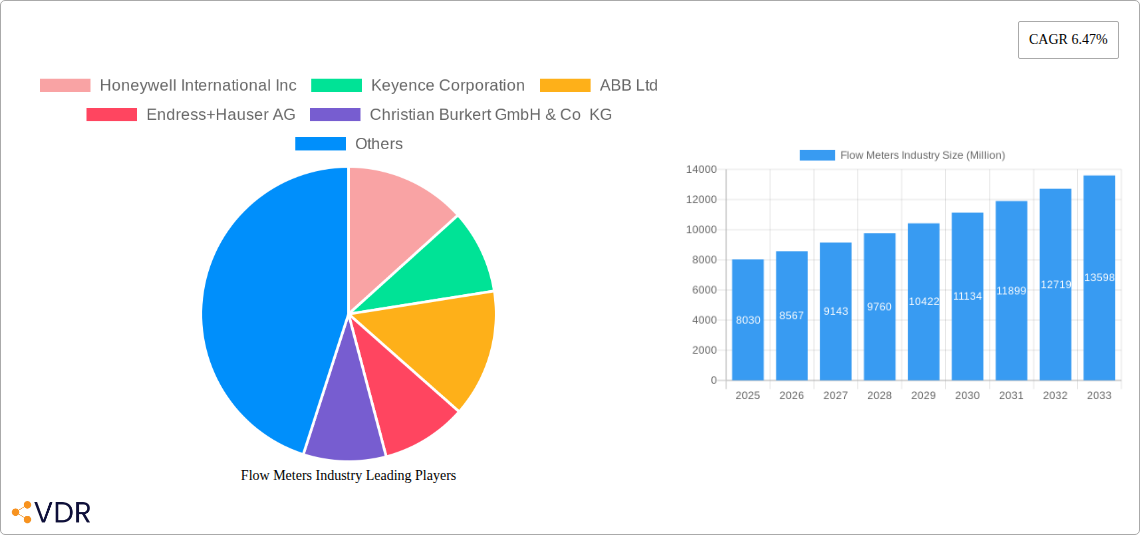
The global flow meters market, valued at $8.03 billion in 2025, is projected to experience robust growth, driven by a compound annual growth rate (CAGR) of 6.47% from 2025 to 2033. This expansion is fueled by several key factors. Increasing automation across various industries, particularly in oil and gas, water and wastewater treatment, and chemical processing, significantly boosts demand for precise and reliable flow measurement solutions. Furthermore, stringent environmental regulations and the growing need for efficient resource management are driving the adoption of advanced flow meters with improved accuracy and data analytics capabilities. The shift towards smart manufacturing and Industry 4.0 initiatives further contributes to market growth, as these technologies rely heavily on real-time flow data for optimized process control and predictive maintenance. Technological advancements, such as the development of more durable and cost-effective Coriolis and ultrasonic flow meters, are also expanding market applications.
Market segmentation reveals significant opportunities across various technologies and end-user industries. While differential pressure flow meters remain prevalent, the adoption of advanced technologies like Coriolis and ultrasonic flow meters is steadily increasing, driven by their superior accuracy and suitability for diverse applications. The oil and gas sector currently dominates the end-user landscape, but expanding applications in water and wastewater treatment, food and beverage processing, and chemical manufacturing are anticipated to contribute significantly to market growth in the coming years. Competition within the market is intense, with established players like Honeywell, Emerson, and Endress+Hauser competing alongside specialized manufacturers. However, the market is likely to witness increased consolidation and strategic partnerships as companies strive to expand their product portfolios and geographic reach to capitalize on the global growth potential.
Flow Meters Industry Market Report: 2019-2033
This comprehensive report provides a detailed analysis of the global flow meters market, encompassing market dynamics, growth trends, regional dominance, product landscape, key players, and future outlook. The study period spans 2019-2033, with 2025 as the base and estimated year. The report caters to industry professionals, investors, and strategic decision-makers seeking actionable insights into this dynamic sector. The market size is projected to reach xx Million units by 2033.
Flow Meters Industry Market Dynamics & Structure
The flow meters market is characterized by a moderately concentrated landscape, with key players such as Honeywell International Inc, Keyence Corporation, ABB Ltd, and Endress+Hauser AG holding significant market share. Technological innovation, particularly in areas like Coriolis and ultrasonic flow metering, is a primary growth driver. Stringent regulatory frameworks concerning environmental compliance and safety standards in various end-user industries influence market dynamics. The market also witnesses competitive pressures from product substitutes and continuous M&A activities.
- Market Concentration: The top 5 players account for approximately xx% of the global market share in 2025.
- Technological Innovation: Advancements in sensor technology, data analytics, and IoT integration are driving demand for sophisticated flow meters.
- Regulatory Landscape: Stringent emission regulations and safety standards across industries (e.g., Oil & Gas) are fostering adoption.
- M&A Activity: The past five years have witnessed xx M&A deals in the flow meters sector, primarily driven by expansion into new technologies and geographies.
- Competitive Substitutes: Alternative measurement techniques pose a moderate threat to traditional flow meter technologies.
- Innovation Barriers: High R&D costs and the need for specialized expertise can hinder innovation.
Flow Meters Industry Growth Trends & Insights
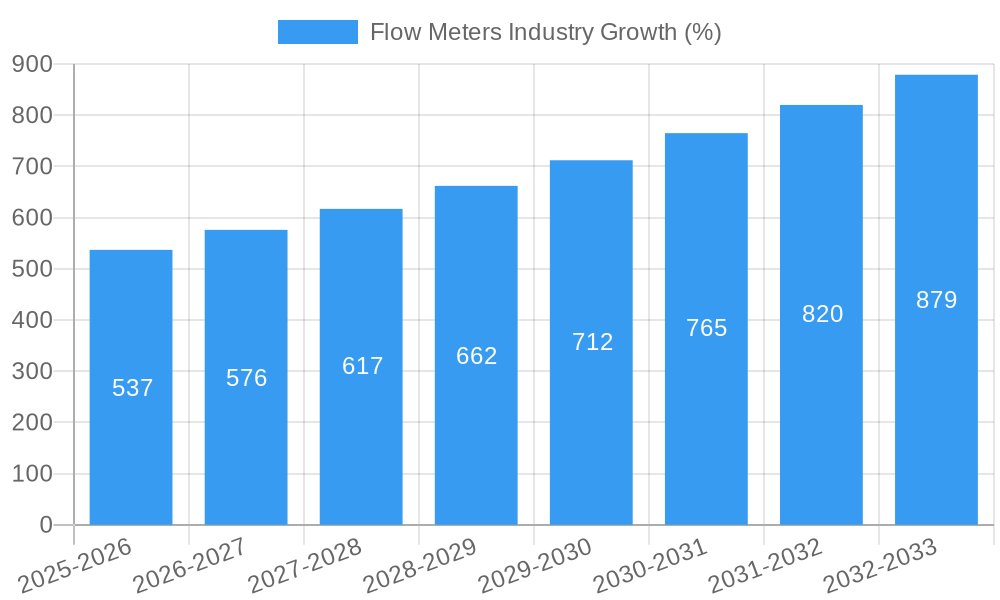
The global flow meters market experienced a CAGR of xx% during the historical period (2019-2024) and is projected to maintain a CAGR of xx% during the forecast period (2025-2033). This growth is fueled by rising industrial automation across diverse sectors, increasing demand for precise flow measurement in process control, and the expansion of infrastructure projects globally. Adoption rates are highest in mature markets like North America and Europe but are witnessing significant growth in developing economies. The market is seeing increasing adoption of smart flow meters with integrated data analytics and remote monitoring capabilities, thereby disrupting traditional measurement systems. Consumer behavior shifts toward sustainable technologies and the implementation of Industry 4.0 practices also influence the market.
Dominant Regions, Countries, or Segments in Flow Meters Industry
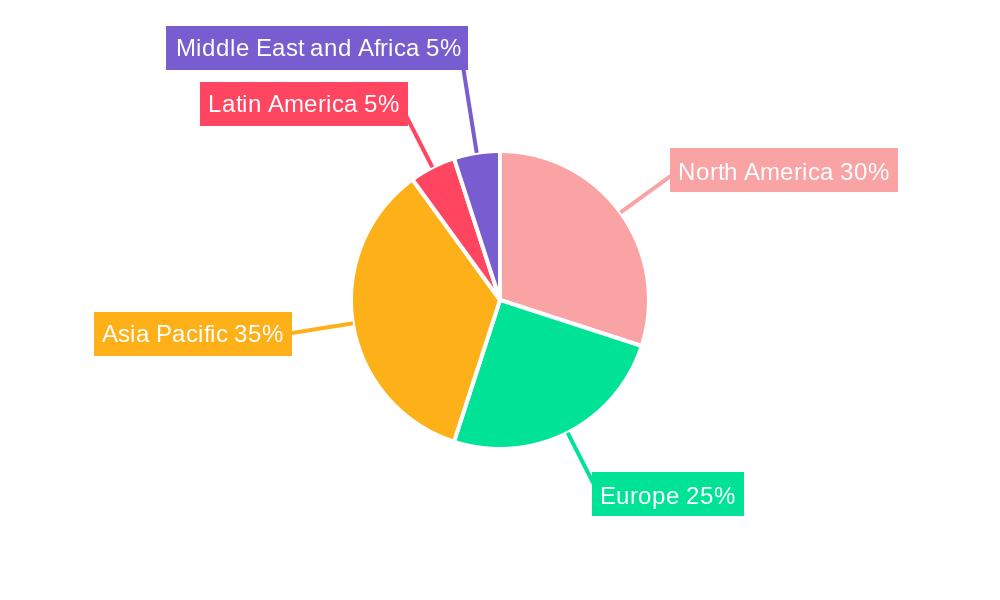
The North American region holds the largest market share, driven by robust industrial activities and high adoption rates of advanced flow meters. Within technology segments, electromagnetic and Coriolis flow meters dominate, exhibiting the highest growth potential due to their accuracy and versatility across various applications. In terms of end-user industries, the Oil and Gas sector leads the market in terms of volume, while the Chemical and Petrochemical sector shows the highest growth rates.
Key Drivers:
- Robust Industrial Activity: High manufacturing output in regions like North America and Europe.
- Infrastructure Development: Investments in water management, oil & gas pipelines, and chemical processing plants.
- Government Regulations: Strict environmental regulations are promoting the adoption of precise flow measurement.
Regional Dominance: North America commands the largest market share, followed by Europe and Asia-Pacific. Specific countries like the United States, Germany, and China are key growth drivers.
Flow Meters Industry Product Landscape
The flow meters market offers a diverse range of products categorized by technology (Coriolis, electromagnetic, ultrasonic, differential pressure, etc.) and application. Recent innovations focus on enhancing measurement accuracy, improving durability, and integrating smart features like remote monitoring and data analytics. Manufacturers are increasingly emphasizing ease of installation, maintenance, and seamless integration with existing process control systems as unique selling propositions. Advanced features like self-diagnostic capabilities and predictive maintenance are key technological advancements.
Key Drivers, Barriers & Challenges in Flow Meters Industry
Key Drivers:
- Growing industrial automation across various sectors.
- Increasing demand for precise flow measurement in process control.
- Expansion of infrastructure projects globally leading to increased demand for flow measurement devices.
Challenges and Restraints:
- High initial investment costs for advanced flow meter technologies.
- Technological complexity and expertise requirements for installation and maintenance.
- Potential supply chain disruptions impacting availability and pricing.
Emerging Opportunities in Flow Meters Industry
Untapped markets in developing economies, particularly in Asia and Africa, present significant growth opportunities. The increasing adoption of smart flow meters with IoT capabilities creates opportunities for data-driven services and predictive maintenance solutions. Furthermore, the demand for flow measurement solutions in emerging applications like renewable energy and wastewater treatment is creating new avenues for growth.
Growth Accelerators in the Flow Meters Industry
Technological breakthroughs in sensor technology, miniaturization, and wireless communication are key growth accelerators. Strategic partnerships between flow meter manufacturers and automation companies will further propel market expansion. Increased investments in R&D to address emerging application needs in areas such as biotechnology and environmental monitoring will drive further growth.
Key Players Shaping the Flow Meters Industry Market
- Honeywell International Inc
- Keyence Corporation
- ABB Ltd
- Endress+Hauser AG
- Christian Burkert GmbH & Co KG
- Emerson Electric Co
- SICK AG
- Siemens AG
- Sensirion AG
- TSI incorporated
- OMEGA Engineering
- Krohne Messtechnik GmbH
- Azbil Corporation
- Yokogawa Electric Corporation
- Bronkhorst High-Tech BV
Notable Milestones in Flow Meters Industry Sector
- October 2022: Watson-Marlow Fluid Technology Solutions (WMFTS) announced the availability of the KROHNE FLEXMAG 4050 C electromagnetic flowmeter to biopharmaceutical clients.
- May 2022: SONOTEC improved its SONOFLOW CO.55 non-contact flow meter, enhancing efficiency in biotechnology applications.
In-Depth Flow Meters Industry Market Outlook
The flow meters market is poised for sustained growth, driven by technological advancements, increasing industrial automation, and expanding infrastructure. Strategic partnerships, market expansion into developing economies, and the emergence of innovative applications within diverse sectors will unlock significant future potential. The integration of AI and machine learning into flow measurement technologies will open new avenues for predictive maintenance and enhanced process optimization.
Flow Meters Industry Segmentation
-
1. Technology
- 1.1. Coriolis
-
1.2. Electromagnetic
- 1.2.1. In-line Magnetic Flowmeters
- 1.2.2. Low Flow Magnetic Flowmeters
- 1.2.3. Insertion
- 1.3. Differential Pressure
-
1.4. Ultrasonic
- 1.4.1. Clamp-on
- 1.5. Other Technologies
-
2. End-user Industry
- 2.1. Oil and Gas
- 2.2. Water and Wastewater
- 2.3. Chemical and Petrochemical
- 2.4. Food & Beverage
- 2.5. Pulp and Paper
- 2.6. Other End-user Industries
Flow Meters Industry Segmentation By Geography
-
1. North America
- 1.1. United States
- 1.2. Canada
-
2. Europe
- 2.1. United Kingdom
- 2.2. Germany
- 2.3. France
- 2.4. Rest of Europe
-
3. Asia Pacific
- 3.1. China
- 3.2. Japan
- 3.3. India
- 3.4. Rest of Asia Pacific
- 4. Latin America
- 5. Middle East and Africa
Flow Meters Industry REPORT HIGHLIGHTS
| Aspects | Details |
|---|---|
| Study Period | 2019-2033 |
| Base Year | 2024 |
| Estimated Year | 2025 |
| Forecast Period | 2025-2033 |
| Historical Period | 2019-2024 |
| Growth Rate | CAGR of 6.47% from 2019-2033 |
| Segmentation |
|
Table of Contents
- 1. Introduction
- 1.1. Research Scope
- 1.2. Market Segmentation
- 1.3. Research Methodology
- 1.4. Definitions and Assumptions
- 2. Executive Summary
- 2.1. Introduction
- 3. Market Dynamics
- 3.1. Introduction
- 3.2. Market Drivers
- 3.2.1. Penetration of IoT and Automation in Flow Rate Measurement Applications; Growing Industrial Demand regarding Safety and Efficiency Concerns
- 3.3. Market Restrains
- 3.3.1. High Capital Investments; Fluctuating Commodity Prices and Volatile Economic Scenario
- 3.4. Market Trends
- 3.4.1. Electromagnetic Flow Meter Holds Significant Market Share
- 4. Market Factor Analysis
- 4.1. Porters Five Forces
- 4.2. Supply/Value Chain
- 4.3. PESTEL analysis
- 4.4. Market Entropy
- 4.5. Patent/Trademark Analysis
- 5. Global Flow Meters Industry Analysis, Insights and Forecast, 2019-2031
- 5.1. Market Analysis, Insights and Forecast - by Technology
- 5.1.1. Coriolis
- 5.1.2. Electromagnetic
- 5.1.2.1. In-line Magnetic Flowmeters
- 5.1.2.2. Low Flow Magnetic Flowmeters
- 5.1.2.3. Insertion
- 5.1.3. Differential Pressure
- 5.1.4. Ultrasonic
- 5.1.4.1. Clamp-on
- 5.1.5. Other Technologies
- 5.2. Market Analysis, Insights and Forecast - by End-user Industry
- 5.2.1. Oil and Gas
- 5.2.2. Water and Wastewater
- 5.2.3. Chemical and Petrochemical
- 5.2.4. Food & Beverage
- 5.2.5. Pulp and Paper
- 5.2.6. Other End-user Industries
- 5.3. Market Analysis, Insights and Forecast - by Region
- 5.3.1. North America
- 5.3.2. Europe
- 5.3.3. Asia Pacific
- 5.3.4. Latin America
- 5.3.5. Middle East and Africa
- 5.1. Market Analysis, Insights and Forecast - by Technology
- 6. North America Flow Meters Industry Analysis, Insights and Forecast, 2019-2031
- 6.1. Market Analysis, Insights and Forecast - by Technology
- 6.1.1. Coriolis
- 6.1.2. Electromagnetic
- 6.1.2.1. In-line Magnetic Flowmeters
- 6.1.2.2. Low Flow Magnetic Flowmeters
- 6.1.2.3. Insertion
- 6.1.3. Differential Pressure
- 6.1.4. Ultrasonic
- 6.1.4.1. Clamp-on
- 6.1.5. Other Technologies
- 6.2. Market Analysis, Insights and Forecast - by End-user Industry
- 6.2.1. Oil and Gas
- 6.2.2. Water and Wastewater
- 6.2.3. Chemical and Petrochemical
- 6.2.4. Food & Beverage
- 6.2.5. Pulp and Paper
- 6.2.6. Other End-user Industries
- 6.1. Market Analysis, Insights and Forecast - by Technology
- 7. Europe Flow Meters Industry Analysis, Insights and Forecast, 2019-2031
- 7.1. Market Analysis, Insights and Forecast - by Technology
- 7.1.1. Coriolis
- 7.1.2. Electromagnetic
- 7.1.2.1. In-line Magnetic Flowmeters
- 7.1.2.2. Low Flow Magnetic Flowmeters
- 7.1.2.3. Insertion
- 7.1.3. Differential Pressure
- 7.1.4. Ultrasonic
- 7.1.4.1. Clamp-on
- 7.1.5. Other Technologies
- 7.2. Market Analysis, Insights and Forecast - by End-user Industry
- 7.2.1. Oil and Gas
- 7.2.2. Water and Wastewater
- 7.2.3. Chemical and Petrochemical
- 7.2.4. Food & Beverage
- 7.2.5. Pulp and Paper
- 7.2.6. Other End-user Industries
- 7.1. Market Analysis, Insights and Forecast - by Technology
- 8. Asia Pacific Flow Meters Industry Analysis, Insights and Forecast, 2019-2031
- 8.1. Market Analysis, Insights and Forecast - by Technology
- 8.1.1. Coriolis
- 8.1.2. Electromagnetic
- 8.1.2.1. In-line Magnetic Flowmeters
- 8.1.2.2. Low Flow Magnetic Flowmeters
- 8.1.2.3. Insertion
- 8.1.3. Differential Pressure
- 8.1.4. Ultrasonic
- 8.1.4.1. Clamp-on
- 8.1.5. Other Technologies
- 8.2. Market Analysis, Insights and Forecast - by End-user Industry
- 8.2.1. Oil and Gas
- 8.2.2. Water and Wastewater
- 8.2.3. Chemical and Petrochemical
- 8.2.4. Food & Beverage
- 8.2.5. Pulp and Paper
- 8.2.6. Other End-user Industries
- 8.1. Market Analysis, Insights and Forecast - by Technology
- 9. Latin America Flow Meters Industry Analysis, Insights and Forecast, 2019-2031
- 9.1. Market Analysis, Insights and Forecast - by Technology
- 9.1.1. Coriolis
- 9.1.2. Electromagnetic
- 9.1.2.1. In-line Magnetic Flowmeters
- 9.1.2.2. Low Flow Magnetic Flowmeters
- 9.1.2.3. Insertion
- 9.1.3. Differential Pressure
- 9.1.4. Ultrasonic
- 9.1.4.1. Clamp-on
- 9.1.5. Other Technologies
- 9.2. Market Analysis, Insights and Forecast - by End-user Industry
- 9.2.1. Oil and Gas
- 9.2.2. Water and Wastewater
- 9.2.3. Chemical and Petrochemical
- 9.2.4. Food & Beverage
- 9.2.5. Pulp and Paper
- 9.2.6. Other End-user Industries
- 9.1. Market Analysis, Insights and Forecast - by Technology
- 10. Middle East and Africa Flow Meters Industry Analysis, Insights and Forecast, 2019-2031
- 10.1. Market Analysis, Insights and Forecast - by Technology
- 10.1.1. Coriolis
- 10.1.2. Electromagnetic
- 10.1.2.1. In-line Magnetic Flowmeters
- 10.1.2.2. Low Flow Magnetic Flowmeters
- 10.1.2.3. Insertion
- 10.1.3. Differential Pressure
- 10.1.4. Ultrasonic
- 10.1.4.1. Clamp-on
- 10.1.5. Other Technologies
- 10.2. Market Analysis, Insights and Forecast - by End-user Industry
- 10.2.1. Oil and Gas
- 10.2.2. Water and Wastewater
- 10.2.3. Chemical and Petrochemical
- 10.2.4. Food & Beverage
- 10.2.5. Pulp and Paper
- 10.2.6. Other End-user Industries
- 10.1. Market Analysis, Insights and Forecast - by Technology
- 11. North America Flow Meters Industry Analysis, Insights and Forecast, 2019-2031
- 11.1. Market Analysis, Insights and Forecast - By Country/Sub-region
- 11.1.1 United States
- 11.1.2 Canada
- 12. Europe Flow Meters Industry Analysis, Insights and Forecast, 2019-2031
- 12.1. Market Analysis, Insights and Forecast - By Country/Sub-region
- 12.1.1 United Kingdom
- 12.1.2 Germany
- 12.1.3 France
- 12.1.4 Rest of Europe
- 13. Asia Pacific Flow Meters Industry Analysis, Insights and Forecast, 2019-2031
- 13.1. Market Analysis, Insights and Forecast - By Country/Sub-region
- 13.1.1 China
- 13.1.2 Japan
- 13.1.3 India
- 13.1.4 Rest of Asia Pacific
- 14. Latin America Flow Meters Industry Analysis, Insights and Forecast, 2019-2031
- 14.1. Market Analysis, Insights and Forecast - By Country/Sub-region
- 14.1.1.
- 15. Middle East and Africa Flow Meters Industry Analysis, Insights and Forecast, 2019-2031
- 15.1. Market Analysis, Insights and Forecast - By Country/Sub-region
- 15.1.1.
- 16. Competitive Analysis
- 16.1. Global Market Share Analysis 2024
- 16.2. Company Profiles
- 16.2.1 Honeywell International Inc
- 16.2.1.1. Overview
- 16.2.1.2. Products
- 16.2.1.3. SWOT Analysis
- 16.2.1.4. Recent Developments
- 16.2.1.5. Financials (Based on Availability)
- 16.2.2 Keyence Corporation
- 16.2.2.1. Overview
- 16.2.2.2. Products
- 16.2.2.3. SWOT Analysis
- 16.2.2.4. Recent Developments
- 16.2.2.5. Financials (Based on Availability)
- 16.2.3 ABB Ltd
- 16.2.3.1. Overview
- 16.2.3.2. Products
- 16.2.3.3. SWOT Analysis
- 16.2.3.4. Recent Developments
- 16.2.3.5. Financials (Based on Availability)
- 16.2.4 Endress+Hauser AG
- 16.2.4.1. Overview
- 16.2.4.2. Products
- 16.2.4.3. SWOT Analysis
- 16.2.4.4. Recent Developments
- 16.2.4.5. Financials (Based on Availability)
- 16.2.5 Christian Burkert GmbH & Co KG
- 16.2.5.1. Overview
- 16.2.5.2. Products
- 16.2.5.3. SWOT Analysis
- 16.2.5.4. Recent Developments
- 16.2.5.5. Financials (Based on Availability)
- 16.2.6 Emerson Electric Co
- 16.2.6.1. Overview
- 16.2.6.2. Products
- 16.2.6.3. SWOT Analysis
- 16.2.6.4. Recent Developments
- 16.2.6.5. Financials (Based on Availability)
- 16.2.7 SICK AG
- 16.2.7.1. Overview
- 16.2.7.2. Products
- 16.2.7.3. SWOT Analysis
- 16.2.7.4. Recent Developments
- 16.2.7.5. Financials (Based on Availability)
- 16.2.8 Siemens AG
- 16.2.8.1. Overview
- 16.2.8.2. Products
- 16.2.8.3. SWOT Analysis
- 16.2.8.4. Recent Developments
- 16.2.8.5. Financials (Based on Availability)
- 16.2.9 Sensirion AG
- 16.2.9.1. Overview
- 16.2.9.2. Products
- 16.2.9.3. SWOT Analysis
- 16.2.9.4. Recent Developments
- 16.2.9.5. Financials (Based on Availability)
- 16.2.10 TSI incorporated
- 16.2.10.1. Overview
- 16.2.10.2. Products
- 16.2.10.3. SWOT Analysis
- 16.2.10.4. Recent Developments
- 16.2.10.5. Financials (Based on Availability)
- 16.2.11 OMEGA Engineering
- 16.2.11.1. Overview
- 16.2.11.2. Products
- 16.2.11.3. SWOT Analysis
- 16.2.11.4. Recent Developments
- 16.2.11.5. Financials (Based on Availability)
- 16.2.12 Krohne Messtechnik GmbH*List Not Exhaustive
- 16.2.12.1. Overview
- 16.2.12.2. Products
- 16.2.12.3. SWOT Analysis
- 16.2.12.4. Recent Developments
- 16.2.12.5. Financials (Based on Availability)
- 16.2.13 Azbil Corporation
- 16.2.13.1. Overview
- 16.2.13.2. Products
- 16.2.13.3. SWOT Analysis
- 16.2.13.4. Recent Developments
- 16.2.13.5. Financials (Based on Availability)
- 16.2.14 Yokogawa Electric Corporation
- 16.2.14.1. Overview
- 16.2.14.2. Products
- 16.2.14.3. SWOT Analysis
- 16.2.14.4. Recent Developments
- 16.2.14.5. Financials (Based on Availability)
- 16.2.15 Bronkhorst High-Tech BV
- 16.2.15.1. Overview
- 16.2.15.2. Products
- 16.2.15.3. SWOT Analysis
- 16.2.15.4. Recent Developments
- 16.2.15.5. Financials (Based on Availability)
- 16.2.1 Honeywell International Inc
List of Figures
- Figure 1: Global Flow Meters Industry Revenue Breakdown (Million, %) by Region 2024 & 2032
- Figure 2: North America Flow Meters Industry Revenue (Million), by Country 2024 & 2032
- Figure 3: North America Flow Meters Industry Revenue Share (%), by Country 2024 & 2032
- Figure 4: Europe Flow Meters Industry Revenue (Million), by Country 2024 & 2032
- Figure 5: Europe Flow Meters Industry Revenue Share (%), by Country 2024 & 2032
- Figure 6: Asia Pacific Flow Meters Industry Revenue (Million), by Country 2024 & 2032
- Figure 7: Asia Pacific Flow Meters Industry Revenue Share (%), by Country 2024 & 2032
- Figure 8: Latin America Flow Meters Industry Revenue (Million), by Country 2024 & 2032
- Figure 9: Latin America Flow Meters Industry Revenue Share (%), by Country 2024 & 2032
- Figure 10: Middle East and Africa Flow Meters Industry Revenue (Million), by Country 2024 & 2032
- Figure 11: Middle East and Africa Flow Meters Industry Revenue Share (%), by Country 2024 & 2032
- Figure 12: North America Flow Meters Industry Revenue (Million), by Technology 2024 & 2032
- Figure 13: North America Flow Meters Industry Revenue Share (%), by Technology 2024 & 2032
- Figure 14: North America Flow Meters Industry Revenue (Million), by End-user Industry 2024 & 2032
- Figure 15: North America Flow Meters Industry Revenue Share (%), by End-user Industry 2024 & 2032
- Figure 16: North America Flow Meters Industry Revenue (Million), by Country 2024 & 2032
- Figure 17: North America Flow Meters Industry Revenue Share (%), by Country 2024 & 2032
- Figure 18: Europe Flow Meters Industry Revenue (Million), by Technology 2024 & 2032
- Figure 19: Europe Flow Meters Industry Revenue Share (%), by Technology 2024 & 2032
- Figure 20: Europe Flow Meters Industry Revenue (Million), by End-user Industry 2024 & 2032
- Figure 21: Europe Flow Meters Industry Revenue Share (%), by End-user Industry 2024 & 2032
- Figure 22: Europe Flow Meters Industry Revenue (Million), by Country 2024 & 2032
- Figure 23: Europe Flow Meters Industry Revenue Share (%), by Country 2024 & 2032
- Figure 24: Asia Pacific Flow Meters Industry Revenue (Million), by Technology 2024 & 2032
- Figure 25: Asia Pacific Flow Meters Industry Revenue Share (%), by Technology 2024 & 2032
- Figure 26: Asia Pacific Flow Meters Industry Revenue (Million), by End-user Industry 2024 & 2032
- Figure 27: Asia Pacific Flow Meters Industry Revenue Share (%), by End-user Industry 2024 & 2032
- Figure 28: Asia Pacific Flow Meters Industry Revenue (Million), by Country 2024 & 2032
- Figure 29: Asia Pacific Flow Meters Industry Revenue Share (%), by Country 2024 & 2032
- Figure 30: Latin America Flow Meters Industry Revenue (Million), by Technology 2024 & 2032
- Figure 31: Latin America Flow Meters Industry Revenue Share (%), by Technology 2024 & 2032
- Figure 32: Latin America Flow Meters Industry Revenue (Million), by End-user Industry 2024 & 2032
- Figure 33: Latin America Flow Meters Industry Revenue Share (%), by End-user Industry 2024 & 2032
- Figure 34: Latin America Flow Meters Industry Revenue (Million), by Country 2024 & 2032
- Figure 35: Latin America Flow Meters Industry Revenue Share (%), by Country 2024 & 2032
- Figure 36: Middle East and Africa Flow Meters Industry Revenue (Million), by Technology 2024 & 2032
- Figure 37: Middle East and Africa Flow Meters Industry Revenue Share (%), by Technology 2024 & 2032
- Figure 38: Middle East and Africa Flow Meters Industry Revenue (Million), by End-user Industry 2024 & 2032
- Figure 39: Middle East and Africa Flow Meters Industry Revenue Share (%), by End-user Industry 2024 & 2032
- Figure 40: Middle East and Africa Flow Meters Industry Revenue (Million), by Country 2024 & 2032
- Figure 41: Middle East and Africa Flow Meters Industry Revenue Share (%), by Country 2024 & 2032
List of Tables
- Table 1: Global Flow Meters Industry Revenue Million Forecast, by Region 2019 & 2032
- Table 2: Global Flow Meters Industry Revenue Million Forecast, by Technology 2019 & 2032
- Table 3: Global Flow Meters Industry Revenue Million Forecast, by End-user Industry 2019 & 2032
- Table 4: Global Flow Meters Industry Revenue Million Forecast, by Region 2019 & 2032
- Table 5: Global Flow Meters Industry Revenue Million Forecast, by Country 2019 & 2032
- Table 6: United States Flow Meters Industry Revenue (Million) Forecast, by Application 2019 & 2032
- Table 7: Canada Flow Meters Industry Revenue (Million) Forecast, by Application 2019 & 2032
- Table 8: Global Flow Meters Industry Revenue Million Forecast, by Country 2019 & 2032
- Table 9: United Kingdom Flow Meters Industry Revenue (Million) Forecast, by Application 2019 & 2032
- Table 10: Germany Flow Meters Industry Revenue (Million) Forecast, by Application 2019 & 2032
- Table 11: France Flow Meters Industry Revenue (Million) Forecast, by Application 2019 & 2032
- Table 12: Rest of Europe Flow Meters Industry Revenue (Million) Forecast, by Application 2019 & 2032
- Table 13: Global Flow Meters Industry Revenue Million Forecast, by Country 2019 & 2032
- Table 14: China Flow Meters Industry Revenue (Million) Forecast, by Application 2019 & 2032
- Table 15: Japan Flow Meters Industry Revenue (Million) Forecast, by Application 2019 & 2032
- Table 16: India Flow Meters Industry Revenue (Million) Forecast, by Application 2019 & 2032
- Table 17: Rest of Asia Pacific Flow Meters Industry Revenue (Million) Forecast, by Application 2019 & 2032
- Table 18: Global Flow Meters Industry Revenue Million Forecast, by Country 2019 & 2032
- Table 19: Flow Meters Industry Revenue (Million) Forecast, by Application 2019 & 2032
- Table 20: Global Flow Meters Industry Revenue Million Forecast, by Country 2019 & 2032
- Table 21: Flow Meters Industry Revenue (Million) Forecast, by Application 2019 & 2032
- Table 22: Global Flow Meters Industry Revenue Million Forecast, by Technology 2019 & 2032
- Table 23: Global Flow Meters Industry Revenue Million Forecast, by End-user Industry 2019 & 2032
- Table 24: Global Flow Meters Industry Revenue Million Forecast, by Country 2019 & 2032
- Table 25: United States Flow Meters Industry Revenue (Million) Forecast, by Application 2019 & 2032
- Table 26: Canada Flow Meters Industry Revenue (Million) Forecast, by Application 2019 & 2032
- Table 27: Global Flow Meters Industry Revenue Million Forecast, by Technology 2019 & 2032
- Table 28: Global Flow Meters Industry Revenue Million Forecast, by End-user Industry 2019 & 2032
- Table 29: Global Flow Meters Industry Revenue Million Forecast, by Country 2019 & 2032
- Table 30: United Kingdom Flow Meters Industry Revenue (Million) Forecast, by Application 2019 & 2032
- Table 31: Germany Flow Meters Industry Revenue (Million) Forecast, by Application 2019 & 2032
- Table 32: France Flow Meters Industry Revenue (Million) Forecast, by Application 2019 & 2032
- Table 33: Rest of Europe Flow Meters Industry Revenue (Million) Forecast, by Application 2019 & 2032
- Table 34: Global Flow Meters Industry Revenue Million Forecast, by Technology 2019 & 2032
- Table 35: Global Flow Meters Industry Revenue Million Forecast, by End-user Industry 2019 & 2032
- Table 36: Global Flow Meters Industry Revenue Million Forecast, by Country 2019 & 2032
- Table 37: China Flow Meters Industry Revenue (Million) Forecast, by Application 2019 & 2032
- Table 38: Japan Flow Meters Industry Revenue (Million) Forecast, by Application 2019 & 2032
- Table 39: India Flow Meters Industry Revenue (Million) Forecast, by Application 2019 & 2032
- Table 40: Rest of Asia Pacific Flow Meters Industry Revenue (Million) Forecast, by Application 2019 & 2032
- Table 41: Global Flow Meters Industry Revenue Million Forecast, by Technology 2019 & 2032
- Table 42: Global Flow Meters Industry Revenue Million Forecast, by End-user Industry 2019 & 2032
- Table 43: Global Flow Meters Industry Revenue Million Forecast, by Country 2019 & 2032
- Table 44: Global Flow Meters Industry Revenue Million Forecast, by Technology 2019 & 2032
- Table 45: Global Flow Meters Industry Revenue Million Forecast, by End-user Industry 2019 & 2032
- Table 46: Global Flow Meters Industry Revenue Million Forecast, by Country 2019 & 2032
Frequently Asked Questions
1. What is the projected Compound Annual Growth Rate (CAGR) of the Flow Meters Industry?
The projected CAGR is approximately 6.47%.
2. Which companies are prominent players in the Flow Meters Industry?
Key companies in the market include Honeywell International Inc, Keyence Corporation, ABB Ltd, Endress+Hauser AG, Christian Burkert GmbH & Co KG, Emerson Electric Co, SICK AG, Siemens AG, Sensirion AG, TSI incorporated, OMEGA Engineering, Krohne Messtechnik GmbH*List Not Exhaustive, Azbil Corporation, Yokogawa Electric Corporation, Bronkhorst High-Tech BV.
3. What are the main segments of the Flow Meters Industry?
The market segments include Technology, End-user Industry.
4. Can you provide details about the market size?
The market size is estimated to be USD 8.03 Million as of 2022.
5. What are some drivers contributing to market growth?
Penetration of IoT and Automation in Flow Rate Measurement Applications; Growing Industrial Demand regarding Safety and Efficiency Concerns.
6. What are the notable trends driving market growth?
Electromagnetic Flow Meter Holds Significant Market Share.
7. Are there any restraints impacting market growth?
High Capital Investments; Fluctuating Commodity Prices and Volatile Economic Scenario.
8. Can you provide examples of recent developments in the market?
October 2022: Watson-Marlow Fluid Technology Solutions (WMFTS) announced that the KROHNE FLEXMAG 4050 C electromagnetic flowmeter is available to biopharmaceutical clients. It strengthens the company's position as a provider of total-solution packages for customers adopting fluid path processes by being an exact and dependable flow measurement device that smoothly connects with other WMFTS products.
9. What pricing options are available for accessing the report?
Pricing options include single-user, multi-user, and enterprise licenses priced at USD 4750, USD 5250, and USD 8750 respectively.
10. Is the market size provided in terms of value or volume?
The market size is provided in terms of value, measured in Million.
11. Are there any specific market keywords associated with the report?
Yes, the market keyword associated with the report is "Flow Meters Industry," which aids in identifying and referencing the specific market segment covered.
12. How do I determine which pricing option suits my needs best?
The pricing options vary based on user requirements and access needs. Individual users may opt for single-user licenses, while businesses requiring broader access may choose multi-user or enterprise licenses for cost-effective access to the report.
13. Are there any additional resources or data provided in the Flow Meters Industry report?
While the report offers comprehensive insights, it's advisable to review the specific contents or supplementary materials provided to ascertain if additional resources or data are available.
14. How can I stay updated on further developments or reports in the Flow Meters Industry?
To stay informed about further developments, trends, and reports in the Flow Meters Industry, consider subscribing to industry newsletters, following relevant companies and organizations, or regularly checking reputable industry news sources and publications.
Methodology
Step 1 - Identification of Relevant Samples Size from Population Database


Step 2 - Approaches for Defining Global Market Size (Value, Volume* & Price*)

Note*: In applicable scenarios
Step 3 - Data Sources
Primary Research
- Web Analytics
- Survey Reports
- Research Institute
- Latest Research Reports
- Opinion Leaders
Secondary Research
- Annual Reports
- White Paper
- Latest Press Release
- Industry Association
- Paid Database
- Investor Presentations

Step 4 - Data Triangulation
Involves using different sources of information in order to increase the validity of a study
These sources are likely to be stakeholders in a program - participants, other researchers, program staff, other community members, and so on.
Then we put all data in single framework & apply various statistical tools to find out the dynamic on the market.
During the analysis stage, feedback from the stakeholder groups would be compared to determine areas of agreement as well as areas of divergence


