
Key Insights
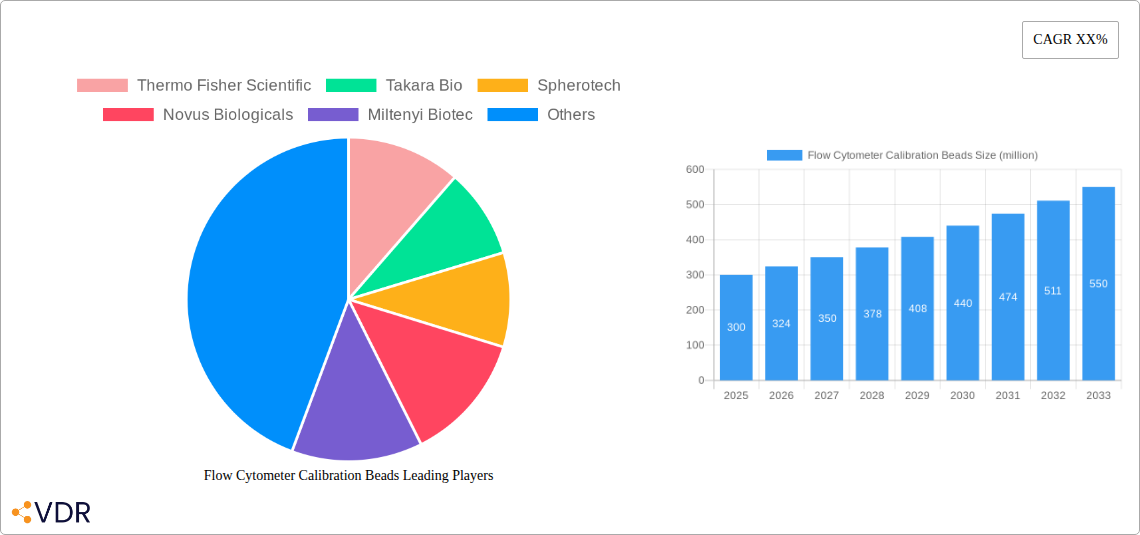
The global flow cytometer calibration beads market is experiencing robust growth, driven by the increasing adoption of flow cytometry in various research and clinical applications. The market's expansion is fueled by advancements in bead technology, offering improved accuracy, precision, and standardization in flow cytometry experiments. This translates to more reliable and reproducible results, which are crucial in diverse fields such as immunology, oncology, and infectious disease research. The rising prevalence of chronic diseases and the growing need for advanced diagnostic tools are further contributing to market expansion. Major players, including Thermo Fisher Scientific, Takara Bio, and Miltenyi Biotec, are investing significantly in R&D to enhance bead functionalities and expand product portfolios, driving competition and innovation within the market. The market is segmented based on bead type (e.g., fluorescent, magnetic), application (e.g., instrument calibration, cell counting), and end-user (e.g., research institutions, hospitals). While the market faces some restraints, such as the high cost of flow cytometers and specialized beads, these are largely outweighed by the significant advantages offered by accurate calibration and the overall growth of the flow cytometry market itself. We estimate the market size in 2025 to be around $300 million, based on current market trends and the substantial growth observed in related sectors. This figure is projected to experience a compound annual growth rate (CAGR) of approximately 8% over the forecast period (2025-2033).
The market's future growth trajectory is positive, underpinned by ongoing technological advancements leading to more sensitive and versatile calibration beads. Further market penetration in emerging economies, coupled with increasing collaborations between bead manufacturers and flow cytometry instrument providers, will further accelerate growth. However, regulatory hurdles and the need for robust quality control measures within the manufacturing process present ongoing challenges. The continued focus on developing beads with enhanced performance characteristics, including improved stability and reduced variability, will be crucial in maintaining market momentum and attracting new users to the technology. The competitive landscape is characterized by both large multinational corporations and specialized niche players, each vying for market share through product differentiation and strategic partnerships. This ensures a dynamic and evolving market environment ripe for innovation and expansion.
Flow Cytometer Calibration Beads Market Report: 2019-2033
This comprehensive report provides an in-depth analysis of the Flow Cytometer Calibration Beads market, offering invaluable insights for industry professionals, investors, and researchers. Covering the period from 2019 to 2033, with a focus on the base year 2025 and forecast period 2025-2033, this report meticulously examines market dynamics, growth trends, regional dominance, product landscapes, and key players. The market, valued at xx million units in 2025, is projected to experience significant growth driven by technological advancements and increasing demand from diverse end-use sectors.
Flow Cytometer Calibration Beads Market Dynamics & Structure
The flow cytometry calibration beads market is characterized by moderate concentration, with key players like Thermo Fisher Scientific, Takara Bio, Spherotech, Novus Biologicals, Miltenyi Biotec, and BD holding significant market share. Technological innovation, particularly in fluorescence technology and bead manufacturing, is a primary growth driver. Stringent regulatory frameworks governing medical devices impact market access, while the availability of substitute technologies (e.g., alternative calibration methods) presents competitive challenges. End-users span diverse sectors, including pharmaceutical research, clinical diagnostics, and academic institutions. M&A activity within the market has been moderate, with xx deals recorded between 2019 and 2024, primarily focused on expanding product portfolios and geographical reach.
- Market Concentration: Moderately concentrated, with top 6 players holding approximately xx% market share in 2025.
- Technological Innovation: Focus on improved fluorescence intensity, size uniformity, and stability.
- Regulatory Landscape: Compliance with stringent medical device regulations (e.g., FDA, CE marking) is crucial.
- Competitive Substitutes: Alternative calibration methods, such as using fluorescent protein standards, exist but have limitations.
- End-User Demographics: Pharmaceutical and biotechnology companies, hospitals, research institutions, and contract research organizations.
- M&A Trends: Moderate activity, primarily driven by expansion strategies.
Flow Cytometer Calibration Beads Growth Trends & Insights
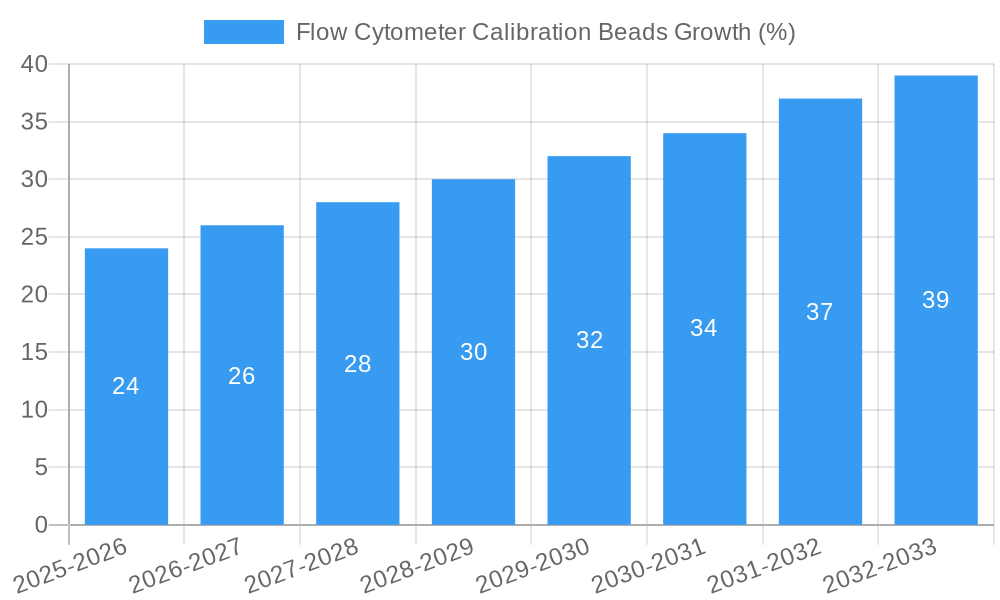
The flow cytometer calibration beads market has exhibited robust growth in recent years, driven by factors such as the increasing adoption of flow cytometry in various applications, coupled with technological advancements leading to improved performance and accuracy of these beads. The market size experienced a CAGR of xx% between 2019 and 2024, reaching xx million units in 2025. This growth is projected to continue with a CAGR of xx% from 2025 to 2033, driven by increasing research funding in life sciences, growing demand for high-throughput screening assays, and the development of innovative applications in personalized medicine. This growth is further fueled by increasing adoption in emerging economies and a rising need for accurate and reliable flow cytometry data. The market penetration is currently at xx% and is expected to increase to xx% by 2033, reflecting the growing acceptance of flow cytometry as a vital tool in various research and clinical settings.
Dominant Regions, Countries, or Segments in Flow Cytometer Calibration Beads
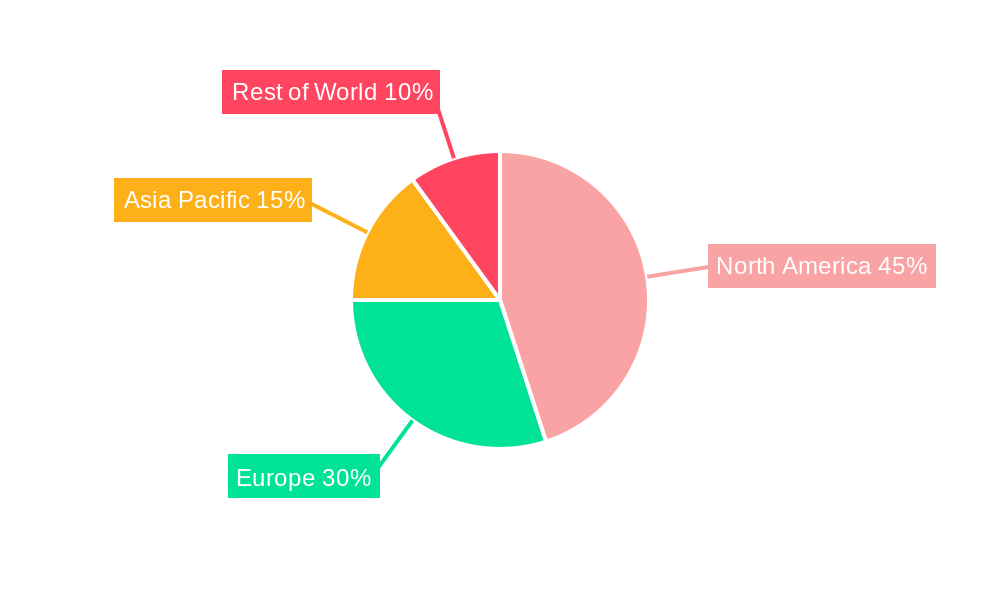
North America currently holds the largest market share in the flow cytometer calibration beads market, followed by Europe. This dominance is attributed to factors like the presence of a large number of research institutions, well-established pharmaceutical and biotechnology industries, and high adoption rates of advanced flow cytometric techniques. Strong regulatory frameworks and significant investments in life sciences research further contribute to the region's leading position. However, Asia Pacific is anticipated to exhibit the highest growth rate during the forecast period, driven by increasing healthcare spending, growing research activities in emerging economies like China and India, and expanding applications of flow cytometry in personalized medicine.
- North America: Strong research infrastructure, high adoption rates, favorable regulatory environment.
- Europe: Significant presence of pharmaceutical companies and research institutions.
- Asia Pacific: High growth potential driven by increasing healthcare spending and research activities.
- Key Drivers: Government funding for research, expansion of pharmaceutical/biotech industry.
Flow Cytometer Calibration Beads Product Landscape
Flow cytometer calibration beads are available in a wide variety of formats, including those designed for specific fluorescent dyes, cell types, and assay types. Recent innovations focus on improving bead uniformity, reducing fluorescence variability, and extending the shelf life. Unique selling propositions (USPs) often involve enhanced fluorescence brightness, improved stability, and specialized functionalities for specific applications (e.g., multicolor flow cytometry). Technological advancements include the development of beads with improved photostability and those incorporating novel fluorescent labels.
Key Drivers, Barriers & Challenges in Flow Cytometer Calibration Beads
Key Drivers: The increasing adoption of flow cytometry in various applications, technological advancements leading to improved bead performance, growing demand for high-throughput screening assays, and increasing research funding in life sciences are driving the market.
Key Challenges: High manufacturing costs, stringent regulatory requirements, and potential competition from alternative calibration methods represent significant market challenges. Supply chain disruptions can impact availability and pricing, potentially slowing market growth. Stringent quality control measures add to the manufacturing costs. Competitive pressure from established players can also impact profitability.
Emerging Opportunities in Flow Cytometer Calibration Beads
Untapped markets in developing countries, the increasing demand for personalized medicine applications, and the potential for integrating calibration beads with automated flow cytometry systems represent major growth opportunities. Further, the development of novel fluorescent dyes and bead materials could enhance performance and broaden applications. Expansion into point-of-care diagnostics could open new markets.
Growth Accelerators in the Flow Cytometer Calibration Beads Industry
Technological breakthroughs, such as the development of more robust and versatile bead materials, are accelerating market growth. Strategic partnerships between bead manufacturers and flow cytometry instrument providers are enhancing product integration and expanding market reach. The increasing emphasis on data standardization and quality control in flow cytometry further stimulates demand.
Key Players Shaping the Flow Cytometer Calibration Beads Market
Notable Milestones in Flow Cytometer Calibration Beads Sector
- 2020: Spherotech launches a new line of calibration beads with enhanced fluorescence stability.
- 2022: Thermo Fisher Scientific acquires a smaller bead manufacturer, expanding its product portfolio.
- 2023: New regulatory guidelines on calibration bead accuracy are introduced in the EU.
In-Depth Flow Cytometer Calibration Beads Market Outlook
The future of the flow cytometer calibration beads market looks bright, driven by ongoing technological advancements, increasing demand from diverse applications, and expansion into new geographical markets. The market's continued growth will be shaped by strategic partnerships, further technological innovations, and the ever-increasing need for accurate and reliable flow cytometric data in various research, clinical, and industrial settings. Strategic investments in R&D and expansion into emerging economies will be crucial for success in this dynamic market.
Flow Cytometer Calibration Beads Segmentation
-
1. Application
- 1.1. Flow Cytomete
- 1.2. Other
-
2. Types
- 2.1. 8.0 – 12.9 μm
- 2.2. Other
Flow Cytometer Calibration Beads Segmentation By Geography
-
1. North America
- 1.1. United States
- 1.2. Canada
- 1.3. Mexico
-
2. South America
- 2.1. Brazil
- 2.2. Argentina
- 2.3. Rest of South America
-
3. Europe
- 3.1. United Kingdom
- 3.2. Germany
- 3.3. France
- 3.4. Italy
- 3.5. Spain
- 3.6. Russia
- 3.7. Benelux
- 3.8. Nordics
- 3.9. Rest of Europe
-
4. Middle East & Africa
- 4.1. Turkey
- 4.2. Israel
- 4.3. GCC
- 4.4. North Africa
- 4.5. South Africa
- 4.6. Rest of Middle East & Africa
-
5. Asia Pacific
- 5.1. China
- 5.2. India
- 5.3. Japan
- 5.4. South Korea
- 5.5. ASEAN
- 5.6. Oceania
- 5.7. Rest of Asia Pacific
Flow Cytometer Calibration Beads REPORT HIGHLIGHTS
| Aspects | Details |
|---|---|
| Study Period | 2019-2033 |
| Base Year | 2024 |
| Estimated Year | 2025 |
| Forecast Period | 2025-2033 |
| Historical Period | 2019-2024 |
| Growth Rate | CAGR of XX% from 2019-2033 |
| Segmentation |
|
Table of Contents
- 1. Introduction
- 1.1. Research Scope
- 1.2. Market Segmentation
- 1.3. Research Methodology
- 1.4. Definitions and Assumptions
- 2. Executive Summary
- 2.1. Introduction
- 3. Market Dynamics
- 3.1. Introduction
- 3.2. Market Drivers
- 3.3. Market Restrains
- 3.4. Market Trends
- 4. Market Factor Analysis
- 4.1. Porters Five Forces
- 4.2. Supply/Value Chain
- 4.3. PESTEL analysis
- 4.4. Market Entropy
- 4.5. Patent/Trademark Analysis
- 5. Global Flow Cytometer Calibration Beads Analysis, Insights and Forecast, 2019-2031
- 5.1. Market Analysis, Insights and Forecast - by Application
- 5.1.1. Flow Cytomete
- 5.1.2. Other
- 5.2. Market Analysis, Insights and Forecast - by Types
- 5.2.1. 8.0 – 12.9 μm
- 5.2.2. Other
- 5.3. Market Analysis, Insights and Forecast - by Region
- 5.3.1. North America
- 5.3.2. South America
- 5.3.3. Europe
- 5.3.4. Middle East & Africa
- 5.3.5. Asia Pacific
- 5.1. Market Analysis, Insights and Forecast - by Application
- 6. North America Flow Cytometer Calibration Beads Analysis, Insights and Forecast, 2019-2031
- 6.1. Market Analysis, Insights and Forecast - by Application
- 6.1.1. Flow Cytomete
- 6.1.2. Other
- 6.2. Market Analysis, Insights and Forecast - by Types
- 6.2.1. 8.0 – 12.9 μm
- 6.2.2. Other
- 6.1. Market Analysis, Insights and Forecast - by Application
- 7. South America Flow Cytometer Calibration Beads Analysis, Insights and Forecast, 2019-2031
- 7.1. Market Analysis, Insights and Forecast - by Application
- 7.1.1. Flow Cytomete
- 7.1.2. Other
- 7.2. Market Analysis, Insights and Forecast - by Types
- 7.2.1. 8.0 – 12.9 μm
- 7.2.2. Other
- 7.1. Market Analysis, Insights and Forecast - by Application
- 8. Europe Flow Cytometer Calibration Beads Analysis, Insights and Forecast, 2019-2031
- 8.1. Market Analysis, Insights and Forecast - by Application
- 8.1.1. Flow Cytomete
- 8.1.2. Other
- 8.2. Market Analysis, Insights and Forecast - by Types
- 8.2.1. 8.0 – 12.9 μm
- 8.2.2. Other
- 8.1. Market Analysis, Insights and Forecast - by Application
- 9. Middle East & Africa Flow Cytometer Calibration Beads Analysis, Insights and Forecast, 2019-2031
- 9.1. Market Analysis, Insights and Forecast - by Application
- 9.1.1. Flow Cytomete
- 9.1.2. Other
- 9.2. Market Analysis, Insights and Forecast - by Types
- 9.2.1. 8.0 – 12.9 μm
- 9.2.2. Other
- 9.1. Market Analysis, Insights and Forecast - by Application
- 10. Asia Pacific Flow Cytometer Calibration Beads Analysis, Insights and Forecast, 2019-2031
- 10.1. Market Analysis, Insights and Forecast - by Application
- 10.1.1. Flow Cytomete
- 10.1.2. Other
- 10.2. Market Analysis, Insights and Forecast - by Types
- 10.2.1. 8.0 – 12.9 μm
- 10.2.2. Other
- 10.1. Market Analysis, Insights and Forecast - by Application
- 11. Competitive Analysis
- 11.1. Global Market Share Analysis 2024
- 11.2. Company Profiles
- 11.2.1 Thermo Fisher Scientific
- 11.2.1.1. Overview
- 11.2.1.2. Products
- 11.2.1.3. SWOT Analysis
- 11.2.1.4. Recent Developments
- 11.2.1.5. Financials (Based on Availability)
- 11.2.2 Takara Bio
- 11.2.2.1. Overview
- 11.2.2.2. Products
- 11.2.2.3. SWOT Analysis
- 11.2.2.4. Recent Developments
- 11.2.2.5. Financials (Based on Availability)
- 11.2.3 Spherotech
- 11.2.3.1. Overview
- 11.2.3.2. Products
- 11.2.3.3. SWOT Analysis
- 11.2.3.4. Recent Developments
- 11.2.3.5. Financials (Based on Availability)
- 11.2.4 Novus Biologicals
- 11.2.4.1. Overview
- 11.2.4.2. Products
- 11.2.4.3. SWOT Analysis
- 11.2.4.4. Recent Developments
- 11.2.4.5. Financials (Based on Availability)
- 11.2.5 Miltenyi Biotec
- 11.2.5.1. Overview
- 11.2.5.2. Products
- 11.2.5.3. SWOT Analysis
- 11.2.5.4. Recent Developments
- 11.2.5.5. Financials (Based on Availability)
- 11.2.6 BD
- 11.2.6.1. Overview
- 11.2.6.2. Products
- 11.2.6.3. SWOT Analysis
- 11.2.6.4. Recent Developments
- 11.2.6.5. Financials (Based on Availability)
- 11.2.1 Thermo Fisher Scientific
List of Figures
- Figure 1: Global Flow Cytometer Calibration Beads Revenue Breakdown (million, %) by Region 2024 & 2032
- Figure 2: North America Flow Cytometer Calibration Beads Revenue (million), by Application 2024 & 2032
- Figure 3: North America Flow Cytometer Calibration Beads Revenue Share (%), by Application 2024 & 2032
- Figure 4: North America Flow Cytometer Calibration Beads Revenue (million), by Types 2024 & 2032
- Figure 5: North America Flow Cytometer Calibration Beads Revenue Share (%), by Types 2024 & 2032
- Figure 6: North America Flow Cytometer Calibration Beads Revenue (million), by Country 2024 & 2032
- Figure 7: North America Flow Cytometer Calibration Beads Revenue Share (%), by Country 2024 & 2032
- Figure 8: South America Flow Cytometer Calibration Beads Revenue (million), by Application 2024 & 2032
- Figure 9: South America Flow Cytometer Calibration Beads Revenue Share (%), by Application 2024 & 2032
- Figure 10: South America Flow Cytometer Calibration Beads Revenue (million), by Types 2024 & 2032
- Figure 11: South America Flow Cytometer Calibration Beads Revenue Share (%), by Types 2024 & 2032
- Figure 12: South America Flow Cytometer Calibration Beads Revenue (million), by Country 2024 & 2032
- Figure 13: South America Flow Cytometer Calibration Beads Revenue Share (%), by Country 2024 & 2032
- Figure 14: Europe Flow Cytometer Calibration Beads Revenue (million), by Application 2024 & 2032
- Figure 15: Europe Flow Cytometer Calibration Beads Revenue Share (%), by Application 2024 & 2032
- Figure 16: Europe Flow Cytometer Calibration Beads Revenue (million), by Types 2024 & 2032
- Figure 17: Europe Flow Cytometer Calibration Beads Revenue Share (%), by Types 2024 & 2032
- Figure 18: Europe Flow Cytometer Calibration Beads Revenue (million), by Country 2024 & 2032
- Figure 19: Europe Flow Cytometer Calibration Beads Revenue Share (%), by Country 2024 & 2032
- Figure 20: Middle East & Africa Flow Cytometer Calibration Beads Revenue (million), by Application 2024 & 2032
- Figure 21: Middle East & Africa Flow Cytometer Calibration Beads Revenue Share (%), by Application 2024 & 2032
- Figure 22: Middle East & Africa Flow Cytometer Calibration Beads Revenue (million), by Types 2024 & 2032
- Figure 23: Middle East & Africa Flow Cytometer Calibration Beads Revenue Share (%), by Types 2024 & 2032
- Figure 24: Middle East & Africa Flow Cytometer Calibration Beads Revenue (million), by Country 2024 & 2032
- Figure 25: Middle East & Africa Flow Cytometer Calibration Beads Revenue Share (%), by Country 2024 & 2032
- Figure 26: Asia Pacific Flow Cytometer Calibration Beads Revenue (million), by Application 2024 & 2032
- Figure 27: Asia Pacific Flow Cytometer Calibration Beads Revenue Share (%), by Application 2024 & 2032
- Figure 28: Asia Pacific Flow Cytometer Calibration Beads Revenue (million), by Types 2024 & 2032
- Figure 29: Asia Pacific Flow Cytometer Calibration Beads Revenue Share (%), by Types 2024 & 2032
- Figure 30: Asia Pacific Flow Cytometer Calibration Beads Revenue (million), by Country 2024 & 2032
- Figure 31: Asia Pacific Flow Cytometer Calibration Beads Revenue Share (%), by Country 2024 & 2032
List of Tables
- Table 1: Global Flow Cytometer Calibration Beads Revenue million Forecast, by Region 2019 & 2032
- Table 2: Global Flow Cytometer Calibration Beads Revenue million Forecast, by Application 2019 & 2032
- Table 3: Global Flow Cytometer Calibration Beads Revenue million Forecast, by Types 2019 & 2032
- Table 4: Global Flow Cytometer Calibration Beads Revenue million Forecast, by Region 2019 & 2032
- Table 5: Global Flow Cytometer Calibration Beads Revenue million Forecast, by Application 2019 & 2032
- Table 6: Global Flow Cytometer Calibration Beads Revenue million Forecast, by Types 2019 & 2032
- Table 7: Global Flow Cytometer Calibration Beads Revenue million Forecast, by Country 2019 & 2032
- Table 8: United States Flow Cytometer Calibration Beads Revenue (million) Forecast, by Application 2019 & 2032
- Table 9: Canada Flow Cytometer Calibration Beads Revenue (million) Forecast, by Application 2019 & 2032
- Table 10: Mexico Flow Cytometer Calibration Beads Revenue (million) Forecast, by Application 2019 & 2032
- Table 11: Global Flow Cytometer Calibration Beads Revenue million Forecast, by Application 2019 & 2032
- Table 12: Global Flow Cytometer Calibration Beads Revenue million Forecast, by Types 2019 & 2032
- Table 13: Global Flow Cytometer Calibration Beads Revenue million Forecast, by Country 2019 & 2032
- Table 14: Brazil Flow Cytometer Calibration Beads Revenue (million) Forecast, by Application 2019 & 2032
- Table 15: Argentina Flow Cytometer Calibration Beads Revenue (million) Forecast, by Application 2019 & 2032
- Table 16: Rest of South America Flow Cytometer Calibration Beads Revenue (million) Forecast, by Application 2019 & 2032
- Table 17: Global Flow Cytometer Calibration Beads Revenue million Forecast, by Application 2019 & 2032
- Table 18: Global Flow Cytometer Calibration Beads Revenue million Forecast, by Types 2019 & 2032
- Table 19: Global Flow Cytometer Calibration Beads Revenue million Forecast, by Country 2019 & 2032
- Table 20: United Kingdom Flow Cytometer Calibration Beads Revenue (million) Forecast, by Application 2019 & 2032
- Table 21: Germany Flow Cytometer Calibration Beads Revenue (million) Forecast, by Application 2019 & 2032
- Table 22: France Flow Cytometer Calibration Beads Revenue (million) Forecast, by Application 2019 & 2032
- Table 23: Italy Flow Cytometer Calibration Beads Revenue (million) Forecast, by Application 2019 & 2032
- Table 24: Spain Flow Cytometer Calibration Beads Revenue (million) Forecast, by Application 2019 & 2032
- Table 25: Russia Flow Cytometer Calibration Beads Revenue (million) Forecast, by Application 2019 & 2032
- Table 26: Benelux Flow Cytometer Calibration Beads Revenue (million) Forecast, by Application 2019 & 2032
- Table 27: Nordics Flow Cytometer Calibration Beads Revenue (million) Forecast, by Application 2019 & 2032
- Table 28: Rest of Europe Flow Cytometer Calibration Beads Revenue (million) Forecast, by Application 2019 & 2032
- Table 29: Global Flow Cytometer Calibration Beads Revenue million Forecast, by Application 2019 & 2032
- Table 30: Global Flow Cytometer Calibration Beads Revenue million Forecast, by Types 2019 & 2032
- Table 31: Global Flow Cytometer Calibration Beads Revenue million Forecast, by Country 2019 & 2032
- Table 32: Turkey Flow Cytometer Calibration Beads Revenue (million) Forecast, by Application 2019 & 2032
- Table 33: Israel Flow Cytometer Calibration Beads Revenue (million) Forecast, by Application 2019 & 2032
- Table 34: GCC Flow Cytometer Calibration Beads Revenue (million) Forecast, by Application 2019 & 2032
- Table 35: North Africa Flow Cytometer Calibration Beads Revenue (million) Forecast, by Application 2019 & 2032
- Table 36: South Africa Flow Cytometer Calibration Beads Revenue (million) Forecast, by Application 2019 & 2032
- Table 37: Rest of Middle East & Africa Flow Cytometer Calibration Beads Revenue (million) Forecast, by Application 2019 & 2032
- Table 38: Global Flow Cytometer Calibration Beads Revenue million Forecast, by Application 2019 & 2032
- Table 39: Global Flow Cytometer Calibration Beads Revenue million Forecast, by Types 2019 & 2032
- Table 40: Global Flow Cytometer Calibration Beads Revenue million Forecast, by Country 2019 & 2032
- Table 41: China Flow Cytometer Calibration Beads Revenue (million) Forecast, by Application 2019 & 2032
- Table 42: India Flow Cytometer Calibration Beads Revenue (million) Forecast, by Application 2019 & 2032
- Table 43: Japan Flow Cytometer Calibration Beads Revenue (million) Forecast, by Application 2019 & 2032
- Table 44: South Korea Flow Cytometer Calibration Beads Revenue (million) Forecast, by Application 2019 & 2032
- Table 45: ASEAN Flow Cytometer Calibration Beads Revenue (million) Forecast, by Application 2019 & 2032
- Table 46: Oceania Flow Cytometer Calibration Beads Revenue (million) Forecast, by Application 2019 & 2032
- Table 47: Rest of Asia Pacific Flow Cytometer Calibration Beads Revenue (million) Forecast, by Application 2019 & 2032
Frequently Asked Questions
1. What is the projected Compound Annual Growth Rate (CAGR) of the Flow Cytometer Calibration Beads?
The projected CAGR is approximately XX%.
2. Which companies are prominent players in the Flow Cytometer Calibration Beads?
Key companies in the market include Thermo Fisher Scientific, Takara Bio, Spherotech, Novus Biologicals, Miltenyi Biotec, BD.
3. What are the main segments of the Flow Cytometer Calibration Beads?
The market segments include Application, Types.
4. Can you provide details about the market size?
The market size is estimated to be USD XXX million as of 2022.
5. What are some drivers contributing to market growth?
N/A
6. What are the notable trends driving market growth?
N/A
7. Are there any restraints impacting market growth?
N/A
8. Can you provide examples of recent developments in the market?
N/A
9. What pricing options are available for accessing the report?
Pricing options include single-user, multi-user, and enterprise licenses priced at USD 4900.00, USD 7350.00, and USD 9800.00 respectively.
10. Is the market size provided in terms of value or volume?
The market size is provided in terms of value, measured in million.
11. Are there any specific market keywords associated with the report?
Yes, the market keyword associated with the report is "Flow Cytometer Calibration Beads," which aids in identifying and referencing the specific market segment covered.
12. How do I determine which pricing option suits my needs best?
The pricing options vary based on user requirements and access needs. Individual users may opt for single-user licenses, while businesses requiring broader access may choose multi-user or enterprise licenses for cost-effective access to the report.
13. Are there any additional resources or data provided in the Flow Cytometer Calibration Beads report?
While the report offers comprehensive insights, it's advisable to review the specific contents or supplementary materials provided to ascertain if additional resources or data are available.
14. How can I stay updated on further developments or reports in the Flow Cytometer Calibration Beads?
To stay informed about further developments, trends, and reports in the Flow Cytometer Calibration Beads, consider subscribing to industry newsletters, following relevant companies and organizations, or regularly checking reputable industry news sources and publications.
Methodology
Step 1 - Identification of Relevant Samples Size from Population Database


Step 2 - Approaches for Defining Global Market Size (Value, Volume* & Price*)

Note*: In applicable scenarios
Step 3 - Data Sources
Primary Research
- Web Analytics
- Survey Reports
- Research Institute
- Latest Research Reports
- Opinion Leaders
Secondary Research
- Annual Reports
- White Paper
- Latest Press Release
- Industry Association
- Paid Database
- Investor Presentations

Step 4 - Data Triangulation
Involves using different sources of information in order to increase the validity of a study
These sources are likely to be stakeholders in a program - participants, other researchers, program staff, other community members, and so on.
Then we put all data in single framework & apply various statistical tools to find out the dynamic on the market.
During the analysis stage, feedback from the stakeholder groups would be compared to determine areas of agreement as well as areas of divergence


