

Key Insights
The Single-Use Bioreactor (SUB) market is experiencing robust expansion, driven by a confluence of technological advancements and increasing demand for biopharmaceutical products. Valued at approximately USD 1.47 billion in 2025, the market is projected to grow at a significant Compound Annual Growth Rate (CAGR) of 9.70% over the forecast period of 2025-2033. This sustained growth is primarily fueled by the inherent advantages of single-use systems, including reduced contamination risks, faster turnaround times, lower capital investment, and enhanced flexibility, all of which are critical for optimizing biopharmaceutical manufacturing processes. The pharmaceutical and biopharmaceutical industries are the dominant end-users, leveraging SUBs for the production of a wide array of therapeutics such as vaccines, monoclonal antibodies, and recombinant proteins. The burgeoning demand for biologics, coupled with the increasing prevalence of chronic diseases, further propels the adoption of these advanced manufacturing solutions.
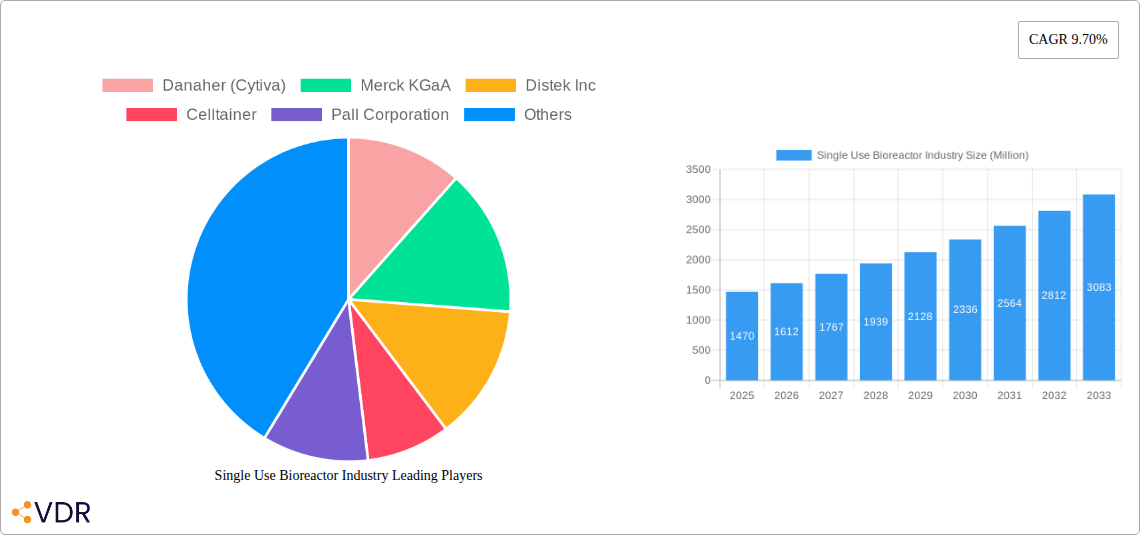
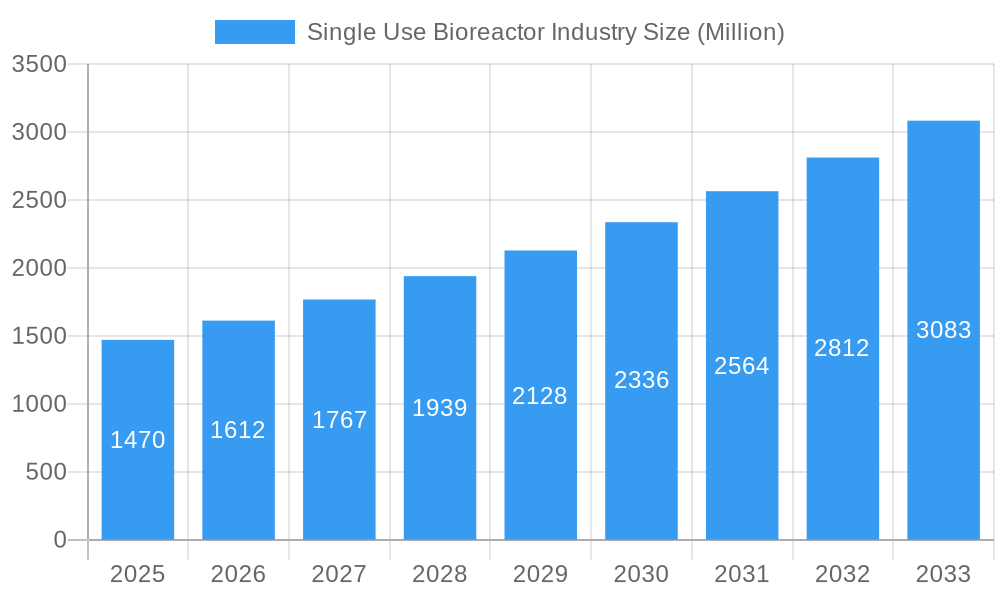
Single Use Bioreactor Industry Market Size (In Billion)
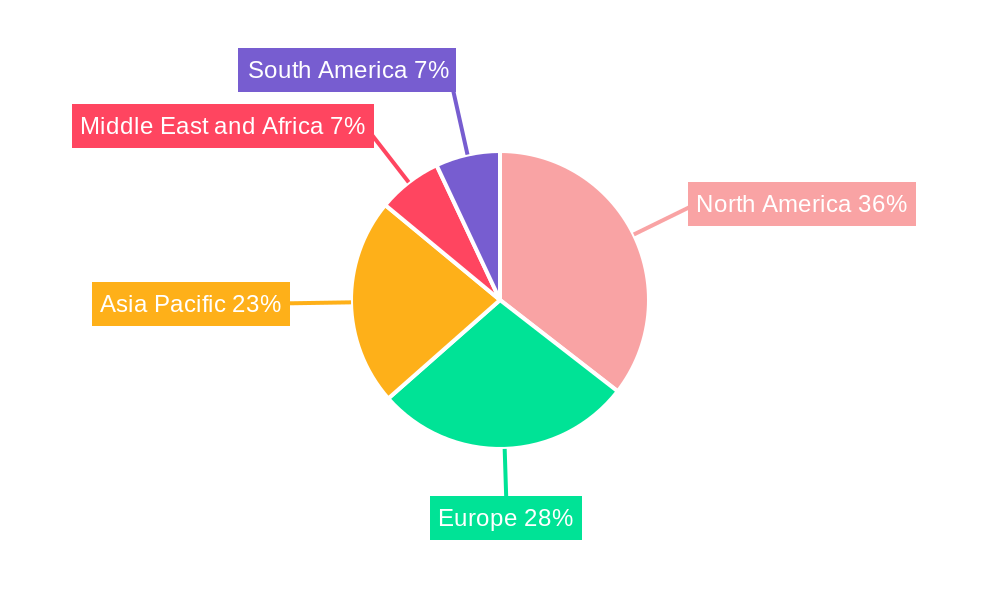
Geographically, North America is expected to maintain a leading position in the SUB market, owing to a well-established biopharmaceutical ecosystem, significant R&D investments, and the presence of major market players. However, the Asia Pacific region is poised for the fastest growth, driven by increasing healthcare expenditure, a growing biomanufacturing capacity, and favorable government initiatives promoting domestic drug production. Key market segments contributing to this growth include single-use bioreactor systems and media bags, with mammalian cell cultures being the predominant cell type utilized. Emerging trends such as the development of advanced sensor technologies for real-time process monitoring, the integration of automation and artificial intelligence, and the increasing focus on sustainability in bioprocessing are further shaping the market landscape. While the market presents substantial opportunities, challenges such as the need for robust validation of single-use components and the management of waste generated from disposable products require continuous innovation and strategic consideration.
Single Use Bioreactor Industry Company Market Share
Comprehensive Report: Single Use Bioreactor Industry Market Dynamics, Growth, and Future Outlook (2019-2033)
This in-depth report provides a thorough analysis of the Single Use Bioreactor (SUB) industry, covering market dynamics, growth trends, regional dominance, product landscape, key drivers, challenges, emerging opportunities, and a detailed player analysis. With an estimated market size of over USD 3,500 Million units in 2025, the SUB market is poised for significant expansion, driven by increasing demand for biopharmaceuticals, advancements in bioprocessing technology, and the inherent advantages of single-use systems over traditional stainless-steel bioreactors. The study period spans from 2019 to 2033, with a base and estimated year of 2025 and a forecast period from 2025 to 2033, encompassing historical data from 2019 to 2024. This report is essential for stakeholders, investors, manufacturers, and researchers seeking to understand the current state and future trajectory of the global Single Use Bioreactor market.
Single Use Bioreactor Industry Market Dynamics & Structure
The global Single Use Bioreactor (SUB) industry is characterized by a moderately consolidated market, with key players like Danaher (Cytiva), Merck KGaA, Sartorius AG, and Thermo Fisher Scientific holding significant market shares. Technological innovation remains a primary driver, with continuous advancements in bioreactor design, sensor technology, and integrated automation enhancing process efficiency and scalability. The stringent regulatory frameworks governing pharmaceutical and biopharmaceutical manufacturing, including FDA and EMA guidelines, mandate high standards for sterility, validation, and lot-to-lot consistency, which SUBs are increasingly designed to meet. While direct competitive product substitutes are limited, traditional stainless-steel bioreactors represent a historical benchmark, with SUBs offering distinct advantages in terms of flexibility, reduced validation times, and lower capital investment. End-user demographics are dominated by the pharmaceutical and biopharmaceutical industries, followed by contract research organizations (CROs) and academic institutions, all seeking to accelerate drug development and reduce manufacturing costs. Mergers and acquisitions (M&A) trends are moderately active, indicating strategic consolidation and expansion by larger players to enhance their product portfolios and market reach. For instance, recent acquisitions focus on integrating upstream and downstream processing solutions, further streamlining biomanufacturing workflows. Innovation barriers include the cost of advanced materials, the need for extensive validation for GMP compliance, and the initial resistance to widespread adoption due to long-standing reliance on traditional systems.
- Market Concentration: Moderately consolidated, with top players holding substantial market share.
- Technological Innovation: Driven by advancements in sensor integration, automation, and advanced materials.
- Regulatory Framework: Stringent GMP compliance and validation requirements influence product development and market entry.
- Competitive Landscape: SUBs compete with traditional stainless-steel bioreactors, offering distinct advantages in flexibility and cost.
- End-User Demographics: Dominated by Pharmaceutical & Biopharmaceutical industries, followed by CROs.
- M&A Trends: Strategic acquisitions aimed at portfolio expansion and integrated solutions.
- Innovation Barriers: High cost of materials, validation complexities, and initial adoption inertia.
Single Use Bioreactor Industry Growth Trends & Insights
The Single Use Bioreactor (SUB) market is experiencing robust growth, projected to expand at a Compound Annual Growth Rate (CAGR) of over 15% from 2025 to 2033, reaching an estimated market size exceeding USD 8,500 Million units by the end of the forecast period. This impressive trajectory is fueled by several key trends. Firstly, the escalating demand for biologics, including vaccines, monoclonal antibodies, and novel cell and gene therapies, necessitates flexible and scalable manufacturing solutions. SUBs inherently offer this flexibility, allowing manufacturers to quickly switch between different products and scales without the extensive cleaning and validation required for stainless-steel systems. Secondly, the increasing focus on process intensification and continuous manufacturing within the biopharmaceutical sector further supports the adoption of SUBs, which are well-suited for these advanced manufacturing paradigms. Technological disruptions, such as the development of higher-density cell culture media, advanced single-use sensors for real-time monitoring, and fully integrated single-use upstream and downstream processing trains, are significantly enhancing the efficiency and reliability of SUBs. Consumer behavior shifts, particularly among biopharmaceutical companies, are marked by a growing preference for disposable solutions to reduce capital expenditure, minimize cross-contamination risks, and shorten manufacturing lead times. The market penetration of SUBs in early-stage development and clinical trial manufacturing is already high and is steadily increasing in commercial-scale production. This accelerated adoption rate is a testament to the proven performance and economic advantages of SUB technology. Furthermore, the development of larger volume single-use bioreactors, exceeding 2,000L, is expanding the application range of SUBs into areas traditionally dominated by stainless-steel systems, further fueling market growth. The global market size for single-use bioreactors is estimated to be over USD 3,500 Million units in the base year of 2025.
Dominant Regions, Countries, or Segments in Single Use Bioreactor Industry
North America currently holds a dominant position in the global Single Use Bioreactor (SUB) market, driven by a confluence of factors including a well-established pharmaceutical and biopharmaceutical industry, significant investment in research and development, and favorable government initiatives supporting biomanufacturing. The United States, in particular, is a key market due to the presence of major biopharmaceutical companies, numerous contract development and manufacturing organizations (CDMOs), and a robust pipeline of novel biologics and advanced therapies. Economic policies supporting biotechnology innovation and the availability of skilled labor further bolster North America's leadership.
Among the product segments, Single-use Bioreactor Systems represent the largest and fastest-growing category. This dominance is directly linked to the core function of bioprocessing and the increasing need for scalable and flexible cell culture solutions. The development of advanced bioreactor designs, with improved mixing, mass transfer, and integrated control systems, continues to drive demand.
In terms of Cell Type, Mammalian Cells are the primary drivers of growth for the SUB market. The vast majority of therapeutic proteins, monoclonal antibodies, and vaccines are produced using mammalian cell lines. Advances in mammalian cell culture technology, enabling higher cell densities and yields, directly translate to increased demand for large-scale SUBs designed for these applications.
For Molecule Type, Monoclonal Antibodies (mAbs) are a leading segment fueling the SUB market. The blockbuster status of many mAb-based therapies and the continuous development of new antibody-based drugs for various indications necessitate efficient and scalable production methods, which SUBs readily provide. Vaccines also represent a significant and growing segment, particularly in light of recent global health events.
The End User segment is overwhelmingly dominated by the Pharmaceutical and Biopharmaceutical Industries. These sectors are the primary consumers of biologics and are at the forefront of adopting new bioprocessing technologies to accelerate drug development, reduce manufacturing costs, and enhance production flexibility. The increasing outsourcing of manufacturing to CDMOs further amplifies the demand for SUBs within this end-user category.
- Dominant Region: North America, with a strong emphasis on the United States.
- Key Drivers: Robust biopharmaceutical sector, R&D investment, government support, skilled workforce.
- Dominant Product Segment: Single-use Bioreactor Systems.
- Key Drivers: Core bioprocessing need, demand for scalability and flexibility, technological advancements.
- Dominant Cell Type: Mammalian Cells.
- Key Drivers: Production of biologics, advanced cell culture technologies.
- Dominant Molecule Type: Monoclonal Antibodies.
- Key Drivers: Blockbuster drug status, continuous development of antibody therapies.
- Dominant End User: Pharmaceutical and Biopharmaceutical Industries.
- Key Drivers: Need for biologics production, cost reduction, faster development cycles.
Single Use Bioreactor Industry Product Landscape
The product landscape of the Single Use Bioreactor (SUB) industry is characterized by rapid innovation and diversification. Leading manufacturers are continuously introducing advanced single-use bioreactor systems with enhanced performance features, including improved mixing efficiency, superior gas transfer capabilities, and integrated real-time monitoring and control functionalities. These systems are designed to accommodate a wide range of cell types and cell densities, from bench-scale research to pilot and commercial-scale production. Beyond the bioreactor vessels themselves, the product portfolio includes sophisticated single-use media bags, filtration assemblies, and sampling devices, all designed to maintain sterility and minimize contamination risks throughout the bioprocessing workflow. Applications span from the development and manufacturing of vaccines, monoclonal antibodies, recombinant proteins, and stem cells to gene therapy vectors. Unique selling propositions often lie in the scalability, flexibility, and reduced validation burden offered by these disposable solutions, enabling biopharmaceutical companies to accelerate time-to-market and optimize production costs. Technological advancements are also focused on improving the mechanical integrity and material science of disposable components to ensure reliable performance at larger scales.
Key Drivers, Barriers & Challenges in Single Use Bioreactor Industry
Key Drivers:
The Single Use Bioreactor (SUB) market is propelled by several critical drivers. The escalating demand for biologics, including vaccines and monoclonal antibodies, necessitates flexible and scalable manufacturing solutions. Technological advancements in SUB design, sensor technology, and automation are enhancing process efficiency and reliability. The inherent advantages of SUBs, such as reduced capital investment, faster setup times, and minimized risk of cross-contamination, are increasingly attractive to biopharmaceutical companies. Favorable regulatory pathways and growing government support for biomanufacturing also contribute to market expansion.
Barriers & Challenges:
Despite the strong growth, the SUB industry faces certain barriers and challenges. The higher per-unit cost of disposable components compared to reusable systems can be a significant factor, especially for large-scale commercial manufacturing. Concerns regarding leachables and extractables from plastic materials, and the environmental impact of disposing of single-use components, remain areas of ongoing research and development. Supply chain disruptions for critical raw materials and the need for extensive validation for GMP compliance can also pose challenges. Furthermore, established processes and infrastructure for traditional stainless-steel bioreactors present a degree of inertia that needs to be overcome for wider adoption. The competitive pressure from continuous improvements in stainless-steel bioreactor technology also exists.
Emerging Opportunities in Single Use Bioreactor Industry
Emerging opportunities in the Single Use Bioreactor (SUB) industry are centered around several key areas. The burgeoning field of cell and gene therapies presents a significant growth avenue, requiring highly specialized and flexible manufacturing solutions that SUBs are well-suited to provide. Expansion into emerging markets with growing biopharmaceutical sectors offers untapped potential. Furthermore, advancements in materials science are leading to the development of more sustainable and cost-effective disposable components, addressing environmental concerns and reducing operational costs. Integration of advanced analytics and AI for process optimization within single-use systems represents another significant opportunity. The development of modular and scalable single-use manufacturing platforms for decentralized bioproduction is also gaining traction.
Growth Accelerators in the Single Use Bioreactor Industry Industry
Several catalysts are accelerating long-term growth within the Single Use Bioreactor (SUB) industry. Technological breakthroughs, such as the development of higher-density cell culture media and more robust sensor integration, are enhancing the performance and capabilities of SUBs. Strategic partnerships between bioreactor manufacturers, media suppliers, and downstream processing companies are fostering integrated single-use workflow solutions, simplifying bioprocessing for end-users. Market expansion strategies, including the development of larger-scale SUBs and tailored solutions for specific therapeutic modalities, are broadening the addressable market. The increasing focus on personalized medicine and the growing need for rapid response manufacturing for emerging infectious diseases further underscore the critical role and accelerated adoption of SUB technology.
Key Players Shaping the Single Use Bioreactor Industry Market
- Danaher (Cytiva)
- Merck KGaA
- Distek Inc
- Celltainer
- Pall Corporation
- Eppendorf SE
- Sartorius AG
- Thermo Fisher Scientific
- OmniBRx Biotechnologies
- ABEC
Notable Milestones in Single Use Bioreactor Industry Sector
- June 2022: mAbxience equipped their cGMP facility in León, Spain with an additional ABEC 4,000L CSR bioreactor, following the successful delivery of the first 4,000L CSR bioreactor in 2021. mAbxience selected ABEC's single-use technology to increase its CDMO business and capacity.
- May 2022: RD-Biotech partnered with Pall Corporation to supply single-use solutions and purification technology to support the manufacture of industrially relevant volumes of GMP-grade plasmid DNA (pDNA) for early-phase clinical trials.
In-Depth Single Use Bioreactor Industry Market Outlook
The future outlook for the Single Use Bioreactor (SUB) industry is exceptionally bright, driven by sustained demand for biologics and continuous technological advancements. Growth accelerators like the expansion of cell and gene therapy manufacturing, strategic collaborations for integrated single-use solutions, and the development of larger-scale bioreactors will significantly broaden market reach. The industry is poised for substantial growth, with ongoing innovation focusing on sustainability, cost-effectiveness, and enhanced process control. Strategic opportunities lie in catering to the evolving needs of the biopharmaceutical sector, including decentralized manufacturing and rapid response capabilities, ensuring SUBs remain at the forefront of bioprocessing innovation and a critical component in delivering life-saving therapies.
Single Use Bioreactor Industry Segmentation
-
1. Type of Product
- 1.1. Single-use Bioreactor Systems
- 1.2. Media Bags
- 1.3. Filtration Assemblies
- 1.4. Other Products
-
2. Cell Type
- 2.1. Mammalian Cell
- 2.2. Bacteria
- 2.3. Yeast
- 2.4. Other Cell Types
-
3. Molecule Type
- 3.1. Vaccines
- 3.2. Monoclonal Antibodies
- 3.3. Stem Cells
- 3.4. Recombinant Proteins
- 3.5. Other Molecule Types
-
4. End User
- 4.1. Pharmaceutical and Biopharmaceutical Industries
- 4.2. Contract Research Organizations (CRO)
- 4.3. Other End Users
Single Use Bioreactor Industry Segmentation By Geography
-
1. North America
- 1.1. United States
- 1.2. Canada
- 1.3. Mexico
-
2. Europe
- 2.1. Germany
- 2.2. United Kingdom
- 2.3. France
- 2.4. Italy
- 2.5. Spain
- 2.6. Rest of Europe
-
3. Asia Pacific
- 3.1. China
- 3.2. Japan
- 3.3. India
- 3.4. Australia
- 3.5. South Korea
- 3.6. Rest of Asia Pacific
-
4. Middle East and Africa
- 4.1. GCC
- 4.2. South Africa
- 4.3. Rest of Middle East and Africa
-
5. South America
- 5.1. Brazil
- 5.2. Argentina
- 5.3. Rest of South America
Single Use Bioreactor Industry Regional Market Share
Geographic Coverage of Single Use Bioreactor Industry
Single Use Bioreactor Industry REPORT HIGHLIGHTS
| Aspects | Details |
|---|---|
| Study Period | 2020-2034 |
| Base Year | 2025 |
| Estimated Year | 2026 |
| Forecast Period | 2026-2034 |
| Historical Period | 2020-2025 |
| Growth Rate | CAGR of 9.70% from 2020-2034 |
| Segmentation |
|
Table of Contents
- 1. Introduction
- 1.1. Research Scope
- 1.2. Market Segmentation
- 1.3. Research Objective
- 1.4. Definitions and Assumptions
- 2. Executive Summary
- 2.1. Market Snapshot
- 3. Market Dynamics
- 3.1. Market Drivers
- 3.2. Market Restrains
- 3.3. Market Trends
- 3.4. Market Opportunities
- 4. Market Factor Analysis
- 4.1. Porters Five Forces
- 4.1.1. Bargaining Power of Suppliers
- 4.1.2. Bargaining Power of Buyers
- 4.1.3. Threat of New Entrants
- 4.1.4. Threat of Substitutes
- 4.1.5. Competitive Rivalry
- 4.2. PESTEL analysis
- 4.3. BCG Analysis
- 4.3.1. Stars (High Growth, High Market Share)
- 4.3.2. Cash Cows (Low Growth, High Market Share)
- 4.3.3. Question Mark (High Growth, Low Market Share)
- 4.3.4. Dogs (Low Growth, Low Market Share)
- 4.4. Ansoff Matrix Analysis
- 4.5. Supply Chain Analysis
- 4.6. Regulatory Landscape
- 4.7. Current Market Potential and Opportunity Assessment (TAM–SAM–SOM Framework)
- 4.8. VDR Analyst Note
- 4.1. Porters Five Forces
- 5. Market Analysis, Insights and Forecast 2021-2033
- 5.1. Market Analysis, Insights and Forecast - by Type of Product
- 5.1.1. Single-use Bioreactor Systems
- 5.1.2. Media Bags
- 5.1.3. Filtration Assemblies
- 5.1.4. Other Products
- 5.2. Market Analysis, Insights and Forecast - by Cell Type
- 5.2.1. Mammalian Cell
- 5.2.2. Bacteria
- 5.2.3. Yeast
- 5.2.4. Other Cell Types
- 5.3. Market Analysis, Insights and Forecast - by Molecule Type
- 5.3.1. Vaccines
- 5.3.2. Monoclonal Antibodies
- 5.3.3. Stem Cells
- 5.3.4. Recombinant Proteins
- 5.3.5. Other Molecule Types
- 5.4. Market Analysis, Insights and Forecast - by End User
- 5.4.1. Pharmaceutical and Biopharmaceutical Industries
- 5.4.2. Contract Research Organizations (CRO)
- 5.4.3. Other End Users
- 5.5. Market Analysis, Insights and Forecast - by Region
- 5.5.1. North America
- 5.5.2. Europe
- 5.5.3. Asia Pacific
- 5.5.4. Middle East and Africa
- 5.5.5. South America
- 5.1. Market Analysis, Insights and Forecast - by Type of Product
- 6. Global Single Use Bioreactor Industry Analysis, Insights and Forecast, 2021-2033
- 6.1. Market Analysis, Insights and Forecast - by Type of Product
- 6.1.1. Single-use Bioreactor Systems
- 6.1.2. Media Bags
- 6.1.3. Filtration Assemblies
- 6.1.4. Other Products
- 6.2. Market Analysis, Insights and Forecast - by Cell Type
- 6.2.1. Mammalian Cell
- 6.2.2. Bacteria
- 6.2.3. Yeast
- 6.2.4. Other Cell Types
- 6.3. Market Analysis, Insights and Forecast - by Molecule Type
- 6.3.1. Vaccines
- 6.3.2. Monoclonal Antibodies
- 6.3.3. Stem Cells
- 6.3.4. Recombinant Proteins
- 6.3.5. Other Molecule Types
- 6.4. Market Analysis, Insights and Forecast - by End User
- 6.4.1. Pharmaceutical and Biopharmaceutical Industries
- 6.4.2. Contract Research Organizations (CRO)
- 6.4.3. Other End Users
- 6.1. Market Analysis, Insights and Forecast - by Type of Product
- 7. North America Single Use Bioreactor Industry Analysis, Insights and Forecast, 2021-2033
- 7.1. Market Analysis, Insights and Forecast - by Type of Product
- 7.1.1. Single-use Bioreactor Systems
- 7.1.2. Media Bags
- 7.1.3. Filtration Assemblies
- 7.1.4. Other Products
- 7.2. Market Analysis, Insights and Forecast - by Cell Type
- 7.2.1. Mammalian Cell
- 7.2.2. Bacteria
- 7.2.3. Yeast
- 7.2.4. Other Cell Types
- 7.3. Market Analysis, Insights and Forecast - by Molecule Type
- 7.3.1. Vaccines
- 7.3.2. Monoclonal Antibodies
- 7.3.3. Stem Cells
- 7.3.4. Recombinant Proteins
- 7.3.5. Other Molecule Types
- 7.4. Market Analysis, Insights and Forecast - by End User
- 7.4.1. Pharmaceutical and Biopharmaceutical Industries
- 7.4.2. Contract Research Organizations (CRO)
- 7.4.3. Other End Users
- 7.1. Market Analysis, Insights and Forecast - by Type of Product
- 8. Europe Single Use Bioreactor Industry Analysis, Insights and Forecast, 2021-2033
- 8.1. Market Analysis, Insights and Forecast - by Type of Product
- 8.1.1. Single-use Bioreactor Systems
- 8.1.2. Media Bags
- 8.1.3. Filtration Assemblies
- 8.1.4. Other Products
- 8.2. Market Analysis, Insights and Forecast - by Cell Type
- 8.2.1. Mammalian Cell
- 8.2.2. Bacteria
- 8.2.3. Yeast
- 8.2.4. Other Cell Types
- 8.3. Market Analysis, Insights and Forecast - by Molecule Type
- 8.3.1. Vaccines
- 8.3.2. Monoclonal Antibodies
- 8.3.3. Stem Cells
- 8.3.4. Recombinant Proteins
- 8.3.5. Other Molecule Types
- 8.4. Market Analysis, Insights and Forecast - by End User
- 8.4.1. Pharmaceutical and Biopharmaceutical Industries
- 8.4.2. Contract Research Organizations (CRO)
- 8.4.3. Other End Users
- 8.1. Market Analysis, Insights and Forecast - by Type of Product
- 9. Asia Pacific Single Use Bioreactor Industry Analysis, Insights and Forecast, 2021-2033
- 9.1. Market Analysis, Insights and Forecast - by Type of Product
- 9.1.1. Single-use Bioreactor Systems
- 9.1.2. Media Bags
- 9.1.3. Filtration Assemblies
- 9.1.4. Other Products
- 9.2. Market Analysis, Insights and Forecast - by Cell Type
- 9.2.1. Mammalian Cell
- 9.2.2. Bacteria
- 9.2.3. Yeast
- 9.2.4. Other Cell Types
- 9.3. Market Analysis, Insights and Forecast - by Molecule Type
- 9.3.1. Vaccines
- 9.3.2. Monoclonal Antibodies
- 9.3.3. Stem Cells
- 9.3.4. Recombinant Proteins
- 9.3.5. Other Molecule Types
- 9.4. Market Analysis, Insights and Forecast - by End User
- 9.4.1. Pharmaceutical and Biopharmaceutical Industries
- 9.4.2. Contract Research Organizations (CRO)
- 9.4.3. Other End Users
- 9.1. Market Analysis, Insights and Forecast - by Type of Product
- 10. Middle East and Africa Single Use Bioreactor Industry Analysis, Insights and Forecast, 2021-2033
- 10.1. Market Analysis, Insights and Forecast - by Type of Product
- 10.1.1. Single-use Bioreactor Systems
- 10.1.2. Media Bags
- 10.1.3. Filtration Assemblies
- 10.1.4. Other Products
- 10.2. Market Analysis, Insights and Forecast - by Cell Type
- 10.2.1. Mammalian Cell
- 10.2.2. Bacteria
- 10.2.3. Yeast
- 10.2.4. Other Cell Types
- 10.3. Market Analysis, Insights and Forecast - by Molecule Type
- 10.3.1. Vaccines
- 10.3.2. Monoclonal Antibodies
- 10.3.3. Stem Cells
- 10.3.4. Recombinant Proteins
- 10.3.5. Other Molecule Types
- 10.4. Market Analysis, Insights and Forecast - by End User
- 10.4.1. Pharmaceutical and Biopharmaceutical Industries
- 10.4.2. Contract Research Organizations (CRO)
- 10.4.3. Other End Users
- 10.1. Market Analysis, Insights and Forecast - by Type of Product
- 11. South America Single Use Bioreactor Industry Analysis, Insights and Forecast, 2021-2033
- 11.1. Market Analysis, Insights and Forecast - by Type of Product
- 11.1.1. Single-use Bioreactor Systems
- 11.1.2. Media Bags
- 11.1.3. Filtration Assemblies
- 11.1.4. Other Products
- 11.2. Market Analysis, Insights and Forecast - by Cell Type
- 11.2.1. Mammalian Cell
- 11.2.2. Bacteria
- 11.2.3. Yeast
- 11.2.4. Other Cell Types
- 11.3. Market Analysis, Insights and Forecast - by Molecule Type
- 11.3.1. Vaccines
- 11.3.2. Monoclonal Antibodies
- 11.3.3. Stem Cells
- 11.3.4. Recombinant Proteins
- 11.3.5. Other Molecule Types
- 11.4. Market Analysis, Insights and Forecast - by End User
- 11.4.1. Pharmaceutical and Biopharmaceutical Industries
- 11.4.2. Contract Research Organizations (CRO)
- 11.4.3. Other End Users
- 11.1. Market Analysis, Insights and Forecast - by Type of Product
- 12. Competitive Analysis
- 12.1. Company Profiles
- 12.1.1 Danaher (Cytiva)
- 12.1.1.1. Company Overview
- 12.1.1.2. Products
- 12.1.1.3. Company Financials
- 12.1.1.4. SWOT Analysis
- 12.1.2 Merck KGaA
- 12.1.2.1. Company Overview
- 12.1.2.2. Products
- 12.1.2.3. Company Financials
- 12.1.2.4. SWOT Analysis
- 12.1.3 Distek Inc
- 12.1.3.1. Company Overview
- 12.1.3.2. Products
- 12.1.3.3. Company Financials
- 12.1.3.4. SWOT Analysis
- 12.1.4 Celltainer
- 12.1.4.1. Company Overview
- 12.1.4.2. Products
- 12.1.4.3. Company Financials
- 12.1.4.4. SWOT Analysis
- 12.1.5 Pall Corporation
- 12.1.5.1. Company Overview
- 12.1.5.2. Products
- 12.1.5.3. Company Financials
- 12.1.5.4. SWOT Analysis
- 12.1.6 Eppendorf SE
- 12.1.6.1. Company Overview
- 12.1.6.2. Products
- 12.1.6.3. Company Financials
- 12.1.6.4. SWOT Analysis
- 12.1.7 Sartorius AG
- 12.1.7.1. Company Overview
- 12.1.7.2. Products
- 12.1.7.3. Company Financials
- 12.1.7.4. SWOT Analysis
- 12.1.8 Thermo Fisher Scientific
- 12.1.8.1. Company Overview
- 12.1.8.2. Products
- 12.1.8.3. Company Financials
- 12.1.8.4. SWOT Analysis
- 12.1.9 OmniBRx Biotechnologies
- 12.1.9.1. Company Overview
- 12.1.9.2. Products
- 12.1.9.3. Company Financials
- 12.1.9.4. SWOT Analysis
- 12.1.10 ABEC
- 12.1.10.1. Company Overview
- 12.1.10.2. Products
- 12.1.10.3. Company Financials
- 12.1.10.4. SWOT Analysis
- 12.1.1 Danaher (Cytiva)
- 12.2. Market Entropy
- 12.2.1 Company's Key Areas Served
- 12.2.2 Recent Developments
- 12.3. Company Market Share Analysis 2025
- 12.3.1 Top 5 Companies Market Share Analysis
- 12.3.2 Top 3 Companies Market Share Analysis
- 12.4. List of Potential Customers
- 13. Research Methodology
List of Figures
- Figure 1: Global Single Use Bioreactor Industry Revenue Breakdown (Million, %) by Region 2025 & 2033
- Figure 2: Global Single Use Bioreactor Industry Volume Breakdown (K Units, %) by Region 2025 & 2033
- Figure 3: North America Single Use Bioreactor Industry Revenue (Million), by Type of Product 2025 & 2033
- Figure 4: North America Single Use Bioreactor Industry Volume (K Units), by Type of Product 2025 & 2033
- Figure 5: North America Single Use Bioreactor Industry Revenue Share (%), by Type of Product 2025 & 2033
- Figure 6: North America Single Use Bioreactor Industry Volume Share (%), by Type of Product 2025 & 2033
- Figure 7: North America Single Use Bioreactor Industry Revenue (Million), by Cell Type 2025 & 2033
- Figure 8: North America Single Use Bioreactor Industry Volume (K Units), by Cell Type 2025 & 2033
- Figure 9: North America Single Use Bioreactor Industry Revenue Share (%), by Cell Type 2025 & 2033
- Figure 10: North America Single Use Bioreactor Industry Volume Share (%), by Cell Type 2025 & 2033
- Figure 11: North America Single Use Bioreactor Industry Revenue (Million), by Molecule Type 2025 & 2033
- Figure 12: North America Single Use Bioreactor Industry Volume (K Units), by Molecule Type 2025 & 2033
- Figure 13: North America Single Use Bioreactor Industry Revenue Share (%), by Molecule Type 2025 & 2033
- Figure 14: North America Single Use Bioreactor Industry Volume Share (%), by Molecule Type 2025 & 2033
- Figure 15: North America Single Use Bioreactor Industry Revenue (Million), by End User 2025 & 2033
- Figure 16: North America Single Use Bioreactor Industry Volume (K Units), by End User 2025 & 2033
- Figure 17: North America Single Use Bioreactor Industry Revenue Share (%), by End User 2025 & 2033
- Figure 18: North America Single Use Bioreactor Industry Volume Share (%), by End User 2025 & 2033
- Figure 19: North America Single Use Bioreactor Industry Revenue (Million), by Country 2025 & 2033
- Figure 20: North America Single Use Bioreactor Industry Volume (K Units), by Country 2025 & 2033
- Figure 21: North America Single Use Bioreactor Industry Revenue Share (%), by Country 2025 & 2033
- Figure 22: North America Single Use Bioreactor Industry Volume Share (%), by Country 2025 & 2033
- Figure 23: Europe Single Use Bioreactor Industry Revenue (Million), by Type of Product 2025 & 2033
- Figure 24: Europe Single Use Bioreactor Industry Volume (K Units), by Type of Product 2025 & 2033
- Figure 25: Europe Single Use Bioreactor Industry Revenue Share (%), by Type of Product 2025 & 2033
- Figure 26: Europe Single Use Bioreactor Industry Volume Share (%), by Type of Product 2025 & 2033
- Figure 27: Europe Single Use Bioreactor Industry Revenue (Million), by Cell Type 2025 & 2033
- Figure 28: Europe Single Use Bioreactor Industry Volume (K Units), by Cell Type 2025 & 2033
- Figure 29: Europe Single Use Bioreactor Industry Revenue Share (%), by Cell Type 2025 & 2033
- Figure 30: Europe Single Use Bioreactor Industry Volume Share (%), by Cell Type 2025 & 2033
- Figure 31: Europe Single Use Bioreactor Industry Revenue (Million), by Molecule Type 2025 & 2033
- Figure 32: Europe Single Use Bioreactor Industry Volume (K Units), by Molecule Type 2025 & 2033
- Figure 33: Europe Single Use Bioreactor Industry Revenue Share (%), by Molecule Type 2025 & 2033
- Figure 34: Europe Single Use Bioreactor Industry Volume Share (%), by Molecule Type 2025 & 2033
- Figure 35: Europe Single Use Bioreactor Industry Revenue (Million), by End User 2025 & 2033
- Figure 36: Europe Single Use Bioreactor Industry Volume (K Units), by End User 2025 & 2033
- Figure 37: Europe Single Use Bioreactor Industry Revenue Share (%), by End User 2025 & 2033
- Figure 38: Europe Single Use Bioreactor Industry Volume Share (%), by End User 2025 & 2033
- Figure 39: Europe Single Use Bioreactor Industry Revenue (Million), by Country 2025 & 2033
- Figure 40: Europe Single Use Bioreactor Industry Volume (K Units), by Country 2025 & 2033
- Figure 41: Europe Single Use Bioreactor Industry Revenue Share (%), by Country 2025 & 2033
- Figure 42: Europe Single Use Bioreactor Industry Volume Share (%), by Country 2025 & 2033
- Figure 43: Asia Pacific Single Use Bioreactor Industry Revenue (Million), by Type of Product 2025 & 2033
- Figure 44: Asia Pacific Single Use Bioreactor Industry Volume (K Units), by Type of Product 2025 & 2033
- Figure 45: Asia Pacific Single Use Bioreactor Industry Revenue Share (%), by Type of Product 2025 & 2033
- Figure 46: Asia Pacific Single Use Bioreactor Industry Volume Share (%), by Type of Product 2025 & 2033
- Figure 47: Asia Pacific Single Use Bioreactor Industry Revenue (Million), by Cell Type 2025 & 2033
- Figure 48: Asia Pacific Single Use Bioreactor Industry Volume (K Units), by Cell Type 2025 & 2033
- Figure 49: Asia Pacific Single Use Bioreactor Industry Revenue Share (%), by Cell Type 2025 & 2033
- Figure 50: Asia Pacific Single Use Bioreactor Industry Volume Share (%), by Cell Type 2025 & 2033
- Figure 51: Asia Pacific Single Use Bioreactor Industry Revenue (Million), by Molecule Type 2025 & 2033
- Figure 52: Asia Pacific Single Use Bioreactor Industry Volume (K Units), by Molecule Type 2025 & 2033
- Figure 53: Asia Pacific Single Use Bioreactor Industry Revenue Share (%), by Molecule Type 2025 & 2033
- Figure 54: Asia Pacific Single Use Bioreactor Industry Volume Share (%), by Molecule Type 2025 & 2033
- Figure 55: Asia Pacific Single Use Bioreactor Industry Revenue (Million), by End User 2025 & 2033
- Figure 56: Asia Pacific Single Use Bioreactor Industry Volume (K Units), by End User 2025 & 2033
- Figure 57: Asia Pacific Single Use Bioreactor Industry Revenue Share (%), by End User 2025 & 2033
- Figure 58: Asia Pacific Single Use Bioreactor Industry Volume Share (%), by End User 2025 & 2033
- Figure 59: Asia Pacific Single Use Bioreactor Industry Revenue (Million), by Country 2025 & 2033
- Figure 60: Asia Pacific Single Use Bioreactor Industry Volume (K Units), by Country 2025 & 2033
- Figure 61: Asia Pacific Single Use Bioreactor Industry Revenue Share (%), by Country 2025 & 2033
- Figure 62: Asia Pacific Single Use Bioreactor Industry Volume Share (%), by Country 2025 & 2033
- Figure 63: Middle East and Africa Single Use Bioreactor Industry Revenue (Million), by Type of Product 2025 & 2033
- Figure 64: Middle East and Africa Single Use Bioreactor Industry Volume (K Units), by Type of Product 2025 & 2033
- Figure 65: Middle East and Africa Single Use Bioreactor Industry Revenue Share (%), by Type of Product 2025 & 2033
- Figure 66: Middle East and Africa Single Use Bioreactor Industry Volume Share (%), by Type of Product 2025 & 2033
- Figure 67: Middle East and Africa Single Use Bioreactor Industry Revenue (Million), by Cell Type 2025 & 2033
- Figure 68: Middle East and Africa Single Use Bioreactor Industry Volume (K Units), by Cell Type 2025 & 2033
- Figure 69: Middle East and Africa Single Use Bioreactor Industry Revenue Share (%), by Cell Type 2025 & 2033
- Figure 70: Middle East and Africa Single Use Bioreactor Industry Volume Share (%), by Cell Type 2025 & 2033
- Figure 71: Middle East and Africa Single Use Bioreactor Industry Revenue (Million), by Molecule Type 2025 & 2033
- Figure 72: Middle East and Africa Single Use Bioreactor Industry Volume (K Units), by Molecule Type 2025 & 2033
- Figure 73: Middle East and Africa Single Use Bioreactor Industry Revenue Share (%), by Molecule Type 2025 & 2033
- Figure 74: Middle East and Africa Single Use Bioreactor Industry Volume Share (%), by Molecule Type 2025 & 2033
- Figure 75: Middle East and Africa Single Use Bioreactor Industry Revenue (Million), by End User 2025 & 2033
- Figure 76: Middle East and Africa Single Use Bioreactor Industry Volume (K Units), by End User 2025 & 2033
- Figure 77: Middle East and Africa Single Use Bioreactor Industry Revenue Share (%), by End User 2025 & 2033
- Figure 78: Middle East and Africa Single Use Bioreactor Industry Volume Share (%), by End User 2025 & 2033
- Figure 79: Middle East and Africa Single Use Bioreactor Industry Revenue (Million), by Country 2025 & 2033
- Figure 80: Middle East and Africa Single Use Bioreactor Industry Volume (K Units), by Country 2025 & 2033
- Figure 81: Middle East and Africa Single Use Bioreactor Industry Revenue Share (%), by Country 2025 & 2033
- Figure 82: Middle East and Africa Single Use Bioreactor Industry Volume Share (%), by Country 2025 & 2033
- Figure 83: South America Single Use Bioreactor Industry Revenue (Million), by Type of Product 2025 & 2033
- Figure 84: South America Single Use Bioreactor Industry Volume (K Units), by Type of Product 2025 & 2033
- Figure 85: South America Single Use Bioreactor Industry Revenue Share (%), by Type of Product 2025 & 2033
- Figure 86: South America Single Use Bioreactor Industry Volume Share (%), by Type of Product 2025 & 2033
- Figure 87: South America Single Use Bioreactor Industry Revenue (Million), by Cell Type 2025 & 2033
- Figure 88: South America Single Use Bioreactor Industry Volume (K Units), by Cell Type 2025 & 2033
- Figure 89: South America Single Use Bioreactor Industry Revenue Share (%), by Cell Type 2025 & 2033
- Figure 90: South America Single Use Bioreactor Industry Volume Share (%), by Cell Type 2025 & 2033
- Figure 91: South America Single Use Bioreactor Industry Revenue (Million), by Molecule Type 2025 & 2033
- Figure 92: South America Single Use Bioreactor Industry Volume (K Units), by Molecule Type 2025 & 2033
- Figure 93: South America Single Use Bioreactor Industry Revenue Share (%), by Molecule Type 2025 & 2033
- Figure 94: South America Single Use Bioreactor Industry Volume Share (%), by Molecule Type 2025 & 2033
- Figure 95: South America Single Use Bioreactor Industry Revenue (Million), by End User 2025 & 2033
- Figure 96: South America Single Use Bioreactor Industry Volume (K Units), by End User 2025 & 2033
- Figure 97: South America Single Use Bioreactor Industry Revenue Share (%), by End User 2025 & 2033
- Figure 98: South America Single Use Bioreactor Industry Volume Share (%), by End User 2025 & 2033
- Figure 99: South America Single Use Bioreactor Industry Revenue (Million), by Country 2025 & 2033
- Figure 100: South America Single Use Bioreactor Industry Volume (K Units), by Country 2025 & 2033
- Figure 101: South America Single Use Bioreactor Industry Revenue Share (%), by Country 2025 & 2033
- Figure 102: South America Single Use Bioreactor Industry Volume Share (%), by Country 2025 & 2033
List of Tables
- Table 1: Global Single Use Bioreactor Industry Revenue Million Forecast, by Type of Product 2020 & 2033
- Table 2: Global Single Use Bioreactor Industry Volume K Units Forecast, by Type of Product 2020 & 2033
- Table 3: Global Single Use Bioreactor Industry Revenue Million Forecast, by Cell Type 2020 & 2033
- Table 4: Global Single Use Bioreactor Industry Volume K Units Forecast, by Cell Type 2020 & 2033
- Table 5: Global Single Use Bioreactor Industry Revenue Million Forecast, by Molecule Type 2020 & 2033
- Table 6: Global Single Use Bioreactor Industry Volume K Units Forecast, by Molecule Type 2020 & 2033
- Table 7: Global Single Use Bioreactor Industry Revenue Million Forecast, by End User 2020 & 2033
- Table 8: Global Single Use Bioreactor Industry Volume K Units Forecast, by End User 2020 & 2033
- Table 9: Global Single Use Bioreactor Industry Revenue Million Forecast, by Region 2020 & 2033
- Table 10: Global Single Use Bioreactor Industry Volume K Units Forecast, by Region 2020 & 2033
- Table 11: Global Single Use Bioreactor Industry Revenue Million Forecast, by Type of Product 2020 & 2033
- Table 12: Global Single Use Bioreactor Industry Volume K Units Forecast, by Type of Product 2020 & 2033
- Table 13: Global Single Use Bioreactor Industry Revenue Million Forecast, by Cell Type 2020 & 2033
- Table 14: Global Single Use Bioreactor Industry Volume K Units Forecast, by Cell Type 2020 & 2033
- Table 15: Global Single Use Bioreactor Industry Revenue Million Forecast, by Molecule Type 2020 & 2033
- Table 16: Global Single Use Bioreactor Industry Volume K Units Forecast, by Molecule Type 2020 & 2033
- Table 17: Global Single Use Bioreactor Industry Revenue Million Forecast, by End User 2020 & 2033
- Table 18: Global Single Use Bioreactor Industry Volume K Units Forecast, by End User 2020 & 2033
- Table 19: Global Single Use Bioreactor Industry Revenue Million Forecast, by Country 2020 & 2033
- Table 20: Global Single Use Bioreactor Industry Volume K Units Forecast, by Country 2020 & 2033
- Table 21: United States Single Use Bioreactor Industry Revenue (Million) Forecast, by Application 2020 & 2033
- Table 22: United States Single Use Bioreactor Industry Volume (K Units) Forecast, by Application 2020 & 2033
- Table 23: Canada Single Use Bioreactor Industry Revenue (Million) Forecast, by Application 2020 & 2033
- Table 24: Canada Single Use Bioreactor Industry Volume (K Units) Forecast, by Application 2020 & 2033
- Table 25: Mexico Single Use Bioreactor Industry Revenue (Million) Forecast, by Application 2020 & 2033
- Table 26: Mexico Single Use Bioreactor Industry Volume (K Units) Forecast, by Application 2020 & 2033
- Table 27: Global Single Use Bioreactor Industry Revenue Million Forecast, by Type of Product 2020 & 2033
- Table 28: Global Single Use Bioreactor Industry Volume K Units Forecast, by Type of Product 2020 & 2033
- Table 29: Global Single Use Bioreactor Industry Revenue Million Forecast, by Cell Type 2020 & 2033
- Table 30: Global Single Use Bioreactor Industry Volume K Units Forecast, by Cell Type 2020 & 2033
- Table 31: Global Single Use Bioreactor Industry Revenue Million Forecast, by Molecule Type 2020 & 2033
- Table 32: Global Single Use Bioreactor Industry Volume K Units Forecast, by Molecule Type 2020 & 2033
- Table 33: Global Single Use Bioreactor Industry Revenue Million Forecast, by End User 2020 & 2033
- Table 34: Global Single Use Bioreactor Industry Volume K Units Forecast, by End User 2020 & 2033
- Table 35: Global Single Use Bioreactor Industry Revenue Million Forecast, by Country 2020 & 2033
- Table 36: Global Single Use Bioreactor Industry Volume K Units Forecast, by Country 2020 & 2033
- Table 37: Germany Single Use Bioreactor Industry Revenue (Million) Forecast, by Application 2020 & 2033
- Table 38: Germany Single Use Bioreactor Industry Volume (K Units) Forecast, by Application 2020 & 2033
- Table 39: United Kingdom Single Use Bioreactor Industry Revenue (Million) Forecast, by Application 2020 & 2033
- Table 40: United Kingdom Single Use Bioreactor Industry Volume (K Units) Forecast, by Application 2020 & 2033
- Table 41: France Single Use Bioreactor Industry Revenue (Million) Forecast, by Application 2020 & 2033
- Table 42: France Single Use Bioreactor Industry Volume (K Units) Forecast, by Application 2020 & 2033
- Table 43: Italy Single Use Bioreactor Industry Revenue (Million) Forecast, by Application 2020 & 2033
- Table 44: Italy Single Use Bioreactor Industry Volume (K Units) Forecast, by Application 2020 & 2033
- Table 45: Spain Single Use Bioreactor Industry Revenue (Million) Forecast, by Application 2020 & 2033
- Table 46: Spain Single Use Bioreactor Industry Volume (K Units) Forecast, by Application 2020 & 2033
- Table 47: Rest of Europe Single Use Bioreactor Industry Revenue (Million) Forecast, by Application 2020 & 2033
- Table 48: Rest of Europe Single Use Bioreactor Industry Volume (K Units) Forecast, by Application 2020 & 2033
- Table 49: Global Single Use Bioreactor Industry Revenue Million Forecast, by Type of Product 2020 & 2033
- Table 50: Global Single Use Bioreactor Industry Volume K Units Forecast, by Type of Product 2020 & 2033
- Table 51: Global Single Use Bioreactor Industry Revenue Million Forecast, by Cell Type 2020 & 2033
- Table 52: Global Single Use Bioreactor Industry Volume K Units Forecast, by Cell Type 2020 & 2033
- Table 53: Global Single Use Bioreactor Industry Revenue Million Forecast, by Molecule Type 2020 & 2033
- Table 54: Global Single Use Bioreactor Industry Volume K Units Forecast, by Molecule Type 2020 & 2033
- Table 55: Global Single Use Bioreactor Industry Revenue Million Forecast, by End User 2020 & 2033
- Table 56: Global Single Use Bioreactor Industry Volume K Units Forecast, by End User 2020 & 2033
- Table 57: Global Single Use Bioreactor Industry Revenue Million Forecast, by Country 2020 & 2033
- Table 58: Global Single Use Bioreactor Industry Volume K Units Forecast, by Country 2020 & 2033
- Table 59: China Single Use Bioreactor Industry Revenue (Million) Forecast, by Application 2020 & 2033
- Table 60: China Single Use Bioreactor Industry Volume (K Units) Forecast, by Application 2020 & 2033
- Table 61: Japan Single Use Bioreactor Industry Revenue (Million) Forecast, by Application 2020 & 2033
- Table 62: Japan Single Use Bioreactor Industry Volume (K Units) Forecast, by Application 2020 & 2033
- Table 63: India Single Use Bioreactor Industry Revenue (Million) Forecast, by Application 2020 & 2033
- Table 64: India Single Use Bioreactor Industry Volume (K Units) Forecast, by Application 2020 & 2033
- Table 65: Australia Single Use Bioreactor Industry Revenue (Million) Forecast, by Application 2020 & 2033
- Table 66: Australia Single Use Bioreactor Industry Volume (K Units) Forecast, by Application 2020 & 2033
- Table 67: South Korea Single Use Bioreactor Industry Revenue (Million) Forecast, by Application 2020 & 2033
- Table 68: South Korea Single Use Bioreactor Industry Volume (K Units) Forecast, by Application 2020 & 2033
- Table 69: Rest of Asia Pacific Single Use Bioreactor Industry Revenue (Million) Forecast, by Application 2020 & 2033
- Table 70: Rest of Asia Pacific Single Use Bioreactor Industry Volume (K Units) Forecast, by Application 2020 & 2033
- Table 71: Global Single Use Bioreactor Industry Revenue Million Forecast, by Type of Product 2020 & 2033
- Table 72: Global Single Use Bioreactor Industry Volume K Units Forecast, by Type of Product 2020 & 2033
- Table 73: Global Single Use Bioreactor Industry Revenue Million Forecast, by Cell Type 2020 & 2033
- Table 74: Global Single Use Bioreactor Industry Volume K Units Forecast, by Cell Type 2020 & 2033
- Table 75: Global Single Use Bioreactor Industry Revenue Million Forecast, by Molecule Type 2020 & 2033
- Table 76: Global Single Use Bioreactor Industry Volume K Units Forecast, by Molecule Type 2020 & 2033
- Table 77: Global Single Use Bioreactor Industry Revenue Million Forecast, by End User 2020 & 2033
- Table 78: Global Single Use Bioreactor Industry Volume K Units Forecast, by End User 2020 & 2033
- Table 79: Global Single Use Bioreactor Industry Revenue Million Forecast, by Country 2020 & 2033
- Table 80: Global Single Use Bioreactor Industry Volume K Units Forecast, by Country 2020 & 2033
- Table 81: GCC Single Use Bioreactor Industry Revenue (Million) Forecast, by Application 2020 & 2033
- Table 82: GCC Single Use Bioreactor Industry Volume (K Units) Forecast, by Application 2020 & 2033
- Table 83: South Africa Single Use Bioreactor Industry Revenue (Million) Forecast, by Application 2020 & 2033
- Table 84: South Africa Single Use Bioreactor Industry Volume (K Units) Forecast, by Application 2020 & 2033
- Table 85: Rest of Middle East and Africa Single Use Bioreactor Industry Revenue (Million) Forecast, by Application 2020 & 2033
- Table 86: Rest of Middle East and Africa Single Use Bioreactor Industry Volume (K Units) Forecast, by Application 2020 & 2033
- Table 87: Global Single Use Bioreactor Industry Revenue Million Forecast, by Type of Product 2020 & 2033
- Table 88: Global Single Use Bioreactor Industry Volume K Units Forecast, by Type of Product 2020 & 2033
- Table 89: Global Single Use Bioreactor Industry Revenue Million Forecast, by Cell Type 2020 & 2033
- Table 90: Global Single Use Bioreactor Industry Volume K Units Forecast, by Cell Type 2020 & 2033
- Table 91: Global Single Use Bioreactor Industry Revenue Million Forecast, by Molecule Type 2020 & 2033
- Table 92: Global Single Use Bioreactor Industry Volume K Units Forecast, by Molecule Type 2020 & 2033
- Table 93: Global Single Use Bioreactor Industry Revenue Million Forecast, by End User 2020 & 2033
- Table 94: Global Single Use Bioreactor Industry Volume K Units Forecast, by End User 2020 & 2033
- Table 95: Global Single Use Bioreactor Industry Revenue Million Forecast, by Country 2020 & 2033
- Table 96: Global Single Use Bioreactor Industry Volume K Units Forecast, by Country 2020 & 2033
- Table 97: Brazil Single Use Bioreactor Industry Revenue (Million) Forecast, by Application 2020 & 2033
- Table 98: Brazil Single Use Bioreactor Industry Volume (K Units) Forecast, by Application 2020 & 2033
- Table 99: Argentina Single Use Bioreactor Industry Revenue (Million) Forecast, by Application 2020 & 2033
- Table 100: Argentina Single Use Bioreactor Industry Volume (K Units) Forecast, by Application 2020 & 2033
- Table 101: Rest of South America Single Use Bioreactor Industry Revenue (Million) Forecast, by Application 2020 & 2033
- Table 102: Rest of South America Single Use Bioreactor Industry Volume (K Units) Forecast, by Application 2020 & 2033
Frequently Asked Questions
1. What is the projected Compound Annual Growth Rate (CAGR) of the Single Use Bioreactor Industry?
The projected CAGR is approximately 9.70%.
2. Which companies are prominent players in the Single Use Bioreactor Industry?
Key companies in the market include Danaher (Cytiva), Merck KGaA, Distek Inc, Celltainer, Pall Corporation, Eppendorf SE, Sartorius AG, Thermo Fisher Scientific, OmniBRx Biotechnologies, ABEC.
3. What are the main segments of the Single Use Bioreactor Industry?
The market segments include Type of Product, Cell Type, Molecule Type, End User.
4. Can you provide details about the market size?
The market size is estimated to be USD 1.47 Million as of 2022.
5. What are some drivers contributing to market growth?
Rapid Adoption of Single-use Technologies (SUTs) by the Industry; Cost Effectiveness and Lower Downtime; New Product Launches.
6. What are the notable trends driving market growth?
Monoclonal Antibodies Segment is Anticipated to Witness Growth.
7. Are there any restraints impacting market growth?
High Regular Recurring Expenses; Issues with Meeting the Standards of Good Manufacturing Practices.
8. Can you provide examples of recent developments in the market?
In June 2022, mAbxience equipped their cGMP (Current Good Manufacturing Practice) facility in León, Spain with an additional ABEC 4,000L CSR bioreactor, following the successful delivery of the first 4,000L CSR bioreactor in 2021. mAbxience selected ABEC's single-use technology to increase its CDMO (contract development and manufacturing organization) business and capacity.
9. What pricing options are available for accessing the report?
Pricing options include single-user, multi-user, and enterprise licenses priced at USD 4750, USD 5250, and USD 8750 respectively.
10. Is the market size provided in terms of value or volume?
The market size is provided in terms of value, measured in Million and volume, measured in K Units.
11. Are there any specific market keywords associated with the report?
Yes, the market keyword associated with the report is "Single Use Bioreactor Industry," which aids in identifying and referencing the specific market segment covered.
12. How do I determine which pricing option suits my needs best?
The pricing options vary based on user requirements and access needs. Individual users may opt for single-user licenses, while businesses requiring broader access may choose multi-user or enterprise licenses for cost-effective access to the report.
13. Are there any additional resources or data provided in the Single Use Bioreactor Industry report?
While the report offers comprehensive insights, it's advisable to review the specific contents or supplementary materials provided to ascertain if additional resources or data are available.
14. How can I stay updated on further developments or reports in the Single Use Bioreactor Industry?
To stay informed about further developments, trends, and reports in the Single Use Bioreactor Industry, consider subscribing to industry newsletters, following relevant companies and organizations, or regularly checking reputable industry news sources and publications.
Methodology
Step 1 - Identification of Relevant Samples Size from Population Database


Step 2 - Approaches for Defining Global Market Size (Value, Volume* & Price*)

Note*: In applicable scenarios
Step 3 - Data Sources
Primary Research
- Web Analytics
- Survey Reports
- Research Institute
- Latest Research Reports
- Opinion Leaders
Secondary Research
- Annual Reports
- White Paper
- Latest Press Release
- Industry Association
- Paid Database
- Investor Presentations

Step 4 - Data Triangulation
Involves using different sources of information in order to increase the validity of a study
These sources are likely to be stakeholders in a program - participants, other researchers, program staff, other community members, and so on.
Then we put all data in single framework & apply various statistical tools to find out the dynamic on the market.
During the analysis stage, feedback from the stakeholder groups would be compared to determine areas of agreement as well as areas of divergence