Key Insights
The global handheld ultrasound devices market is poised for robust expansion, projected to reach an estimated USD 2.86 million by 2025 and maintain a Compound Annual Growth Rate (CAGR) of 6.23% through 2033. This significant growth is fueled by the increasing demand for portable, cost-effective diagnostic tools across various medical specialties. The inherent advantages of handheld ultrasound, such as ease of use, point-of-care accessibility, and reduced patient discomfort compared to traditional systems, are driving its adoption in emergency medicine, primary care settings, and remote locations. Furthermore, technological advancements in miniaturization, enhanced image quality, and wireless connectivity are making these devices more sophisticated and appealing to healthcare professionals. Key applications such as gynecology, cardiovascular diagnostics, urology, and anesthesiology are experiencing a surge in handheld ultrasound utilization, enabling faster and more accurate diagnoses at the patient's bedside.
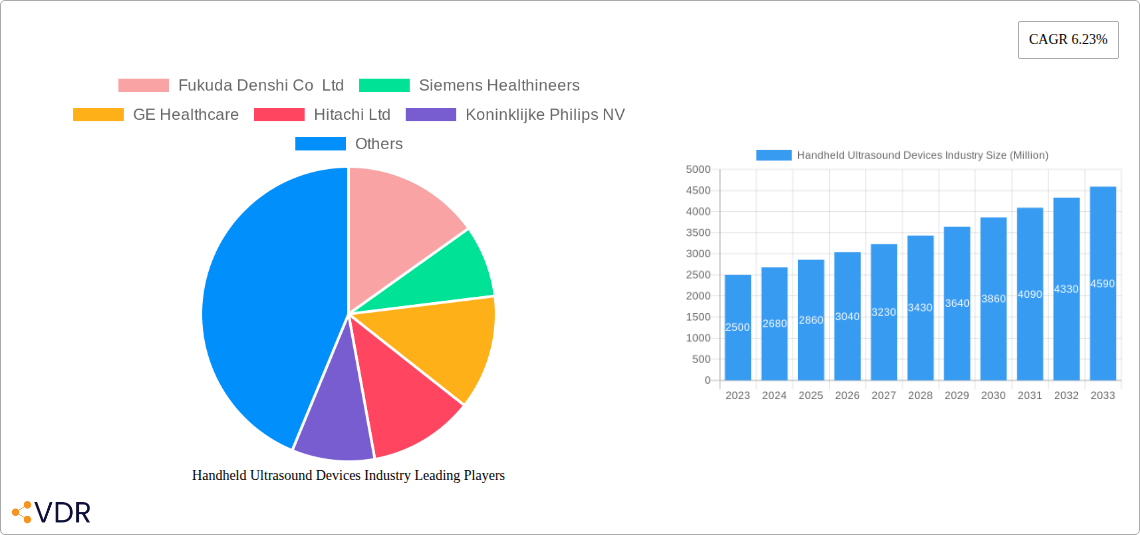
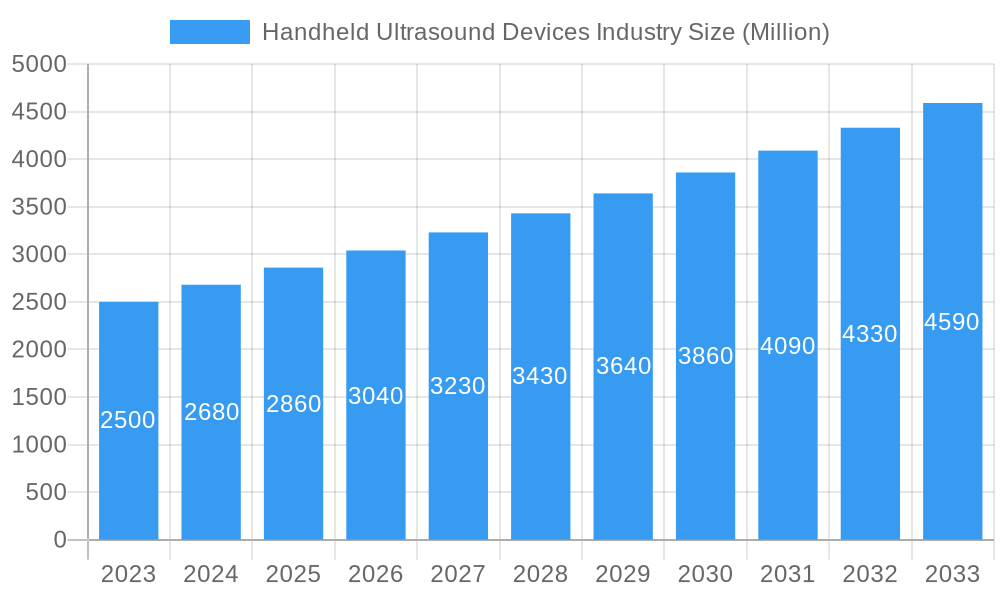
Handheld Ultrasound Devices Industry Market Size (In Billion)
The market's trajectory is also being shaped by the growing need for efficient healthcare delivery and the rising prevalence of chronic diseases requiring continuous monitoring. While the market is characterized by intense competition among established players and emerging innovators, strategic collaborations, product innovation, and an increasing focus on developing user-friendly interfaces are expected to be critical for market players. Potential restraints, such as the initial cost of advanced devices and the need for specialized training for optimal utilization, are being addressed through various market strategies. The Asia Pacific region, with its burgeoning healthcare infrastructure and a large patient pool, is anticipated to be a significant growth engine, alongside the established markets of North America and Europe. The continuous evolution of handheld ultrasound technology promises to democratize advanced diagnostic capabilities, making healthcare more accessible and efficient globally.
Handheld Ultrasound Devices Industry Company Market Share
Handheld Ultrasound Devices Industry Report: Market Insights, Trends, and Forecasts (2019-2033)
This comprehensive report provides an in-depth analysis of the global Handheld Ultrasound Devices market, covering market dynamics, growth trends, regional dominance, product landscape, key players, and future outlook. With a study period spanning from 2019 to 2033, this report offers critical insights for stakeholders seeking to understand and capitalize on this rapidly evolving sector. The analysis includes detailed segmentation by Device Type (Mobile Ultrasound Device, Handheld Ultrasound Device) and Application (Gynecology, Cardiovascular, Urology, Musculoskeletal, Anesthesiology, Others). All values are presented in Million units.
Handheld Ultrasound Devices Industry Market Dynamics & Structure
The Handheld Ultrasound Devices market is characterized by a dynamic interplay of technological innovation, evolving healthcare needs, and an increasingly competitive landscape. Market concentration is moderately fragmented, with key players like Siemens Healthineers, GE Healthcare, and Koninklijke Philips NV holding significant shares, while emerging companies contribute to innovation and market expansion. Technological innovation is primarily driven by advancements in miniaturization, artificial intelligence (AI) integration for image enhancement and diagnostic assistance, and improved battery life. Regulatory frameworks, such as FDA approvals and CE marking, play a crucial role in market access and product differentiation. Competitive product substitutes, including traditional ultrasound systems and other diagnostic imaging modalities, exert pressure on the market, necessitating continuous innovation and cost-effectiveness. End-user demographics are expanding beyond traditional hospital settings to include primary care physicians, emergency medical technicians, and even home healthcare providers, fueled by the demand for accessible and point-of-care diagnostics. Mergers and acquisitions (M&A) are becoming more prevalent as larger companies seek to consolidate their market position and acquire innovative technologies. For instance, the historical period saw an estimated 3 M&A deals aimed at bolstering portfolios in specialized ultrasound applications. Barriers to innovation include high research and development costs, the need for extensive clinical validation, and the challenges of interoperability with existing healthcare IT systems.
- Market Concentration: Moderately fragmented with established players and emerging innovators.
- Technological Innovation Drivers: Miniaturization, AI integration, improved battery efficiency, enhanced imaging resolution.
- Regulatory Frameworks: FDA, CE marking, and other regional health authority approvals are critical.
- Competitive Product Substitutes: Traditional ultrasound systems, other imaging modalities.
- End-User Demographics: Expanding to primary care, emergency services, and home healthcare.
- M&A Trends: Increasing consolidation to gain market share and technological advantage.
Handheld Ultrasound Devices Industry Growth Trends & Insights
The Handheld Ultrasound Devices market is poised for robust growth, driven by an increasing demand for point-of-care diagnostics, the growing prevalence of chronic diseases, and advancements in medical imaging technology. The market size is projected to witness a significant upward trajectory throughout the forecast period. Adoption rates are accelerating as healthcare professionals recognize the portability, affordability, and efficiency of handheld ultrasound devices, especially in resource-limited settings and emergency situations. Technological disruptions, such as the integration of AI for automated measurements and diagnostic aids, are further enhancing the utility and accuracy of these devices. Consumer behavior is shifting towards proactive healthcare and the demand for immediate diagnostic information, making handheld ultrasound an attractive solution. The market penetration is expected to increase substantially as awareness grows and more training programs incorporate these devices. For instance, the market is anticipated to experience a Compound Annual Growth Rate (CAGR) of approximately 12.5% from 2025 to 2033. The estimated market size in the base year of 2025 is predicted to be around 1,800 Million units, with a projected growth to exceed 4,500 Million units by 2033. This growth is underpinned by the increasing number of ultrasound procedures performed globally, with handheld devices capturing a growing share due to their accessibility. The ongoing development of wireless connectivity and cloud-based data storage solutions further facilitates seamless integration into clinical workflows, enhancing data management and accessibility. The growing emphasis on preventative healthcare and early disease detection is also a significant contributor, enabling physicians to perform preliminary assessments at the patient's bedside or in remote locations, thereby reducing the need for immediate referrals to specialized imaging centers. Furthermore, the decreasing cost of advanced sensor technology and processing power is making these sophisticated diagnostic tools more accessible to a wider range of healthcare providers, including those in developing economies.
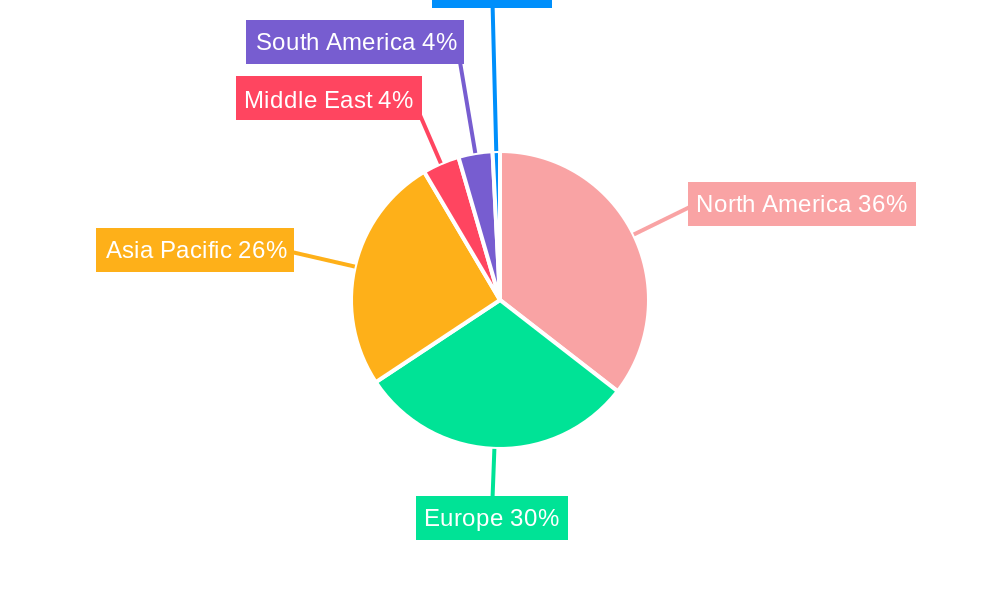
Dominant Regions, Countries, or Segments in Handheld Ultrasound Devices Industry
North America is anticipated to maintain its dominance in the Handheld Ultrasound Devices market, driven by a combination of factors including high healthcare expenditure, advanced technological infrastructure, and a strong emphasis on clinical research and development. The United States, in particular, represents a significant market share due to the early adoption of new medical technologies and the presence of major healthcare providers and research institutions. The demand for Handheld Ultrasound Devices in the Mobile Ultrasound Device segment is particularly strong in this region, owing to its widespread use in emergency medicine, critical care, and point-of-care diagnostics across various specialties.
Key drivers of dominance in North America include:
- Economic Policies: Favorable reimbursement policies for diagnostic imaging and government initiatives promoting healthcare innovation.
- Infrastructure: A well-established healthcare infrastructure with widespread access to advanced medical facilities and a tech-savvy medical professional base.
- Technological Adoption: High receptivity to adopting cutting-edge medical technologies, including AI-powered diagnostic tools.
Within the applications segment, Cardiovascular and Anesthesiology are experiencing significant growth in demand for handheld ultrasound devices. The portability and ease of use of these devices make them invaluable for rapid cardiac assessments in emergency settings and for guiding regional anesthesia procedures at the point of care. The Musculoskeletal application is also gaining traction as more sports medicine professionals and physiotherapists utilize these devices for real-time imaging and diagnosis.
The market share in North America for handheld ultrasound devices is estimated to be around 35% of the global market in 2025, with a projected growth rate that aligns with the overall market CAGR. The increasing prevalence of cardiovascular diseases and the aging population are significant factors contributing to the sustained demand in this segment. Furthermore, the growing trend of telemedicine and remote patient monitoring further amplifies the need for portable diagnostic solutions like handheld ultrasound. The ongoing development of specialized probes and software algorithms tailored for specific cardiovascular conditions is enhancing the diagnostic capabilities and expanding the application range of these devices within the region. The focus on preventative care and early intervention strategies in cardiovascular health also plays a crucial role in driving the adoption of these accessible imaging tools.
Handheld Ultrasound Devices Industry Product Landscape
The product landscape of the Handheld Ultrasound Devices industry is characterized by continuous innovation focused on enhanced portability, improved image quality, and expanded functionalities. Leading companies are investing heavily in developing devices with advanced AI capabilities for automated image analysis, needle tracking, and diagnostic support, significantly improving diagnostic accuracy and efficiency. Innovations include miniaturized, high-resolution probes, longer battery life, and seamless integration with smartphone and tablet platforms, transforming these devices into powerful, on-the-go diagnostic tools. Unique selling propositions often revolve around specific application-focused software, user-friendly interfaces, and robust data management systems. Technological advancements are pushing the boundaries of what is achievable with portable ultrasound, making it an indispensable tool across a wide spectrum of medical specialties.
Key Drivers, Barriers & Challenges in Handheld Ultrasound Devices Industry
The Handheld Ultrasound Devices industry is propelled by several key drivers, including the growing demand for point-of-care diagnostics, the increasing prevalence of chronic diseases requiring frequent monitoring, and the expanding use in emerging markets. Technological advancements, such as AI integration and miniaturization, are making these devices more powerful and accessible. Furthermore, favorable reimbursement policies in some regions and the growing acceptance by a wider range of healthcare professionals are significant growth accelerators. The low cost of entry and the portability offer immense advantages, especially in remote or underserved areas.
However, the industry faces several barriers and challenges. Regulatory hurdles, including the rigorous approval processes in different countries, can slow down market entry. The high cost of initial research and development, coupled with the need for continuous innovation, poses a financial challenge. Competitive pressures from established players and the introduction of substitute technologies can impact pricing and market share. Supply chain disruptions, particularly for specialized components, can affect production and availability. The lack of standardized training and certification for handheld ultrasound can also limit adoption in certain settings. The integration with existing hospital IT systems and ensuring data security are ongoing challenges.
Emerging Opportunities in Handheld Ultrasound Devices Industry
Emerging opportunities in the Handheld Ultrasound Devices industry lie in the untapped potential of AI-driven diagnostics for a broader range of conditions, the expansion into veterinary medicine, and the growing demand for home-use ultrasound devices for chronic disease management and prenatal monitoring. The development of specialized handheld devices for remote patient monitoring and telehealth applications presents a significant growth avenue. Furthermore, the increasing focus on point-of-care diagnostics in primary care settings and emergency medical services is creating a substantial market for intuitive and affordable handheld ultrasound solutions. The integration of advanced sensor technologies and cloud-based platforms offers opportunities for personalized medicine and data analytics.
Growth Accelerators in the Handheld Ultrasound Devices Industry Industry
Technological breakthroughs in transducer technology, leading to higher resolution and penetration, are crucial growth accelerators. The integration of advanced AI algorithms for automated image interpretation and disease detection is revolutionizing the diagnostic capabilities of handheld devices. Strategic partnerships between ultrasound manufacturers and software developers are fostering innovation and expanding the range of applications. Market expansion strategies, including targeting emerging economies and developing user-friendly interfaces for less experienced users, are also key to sustained growth. The increasing adoption of telehealth and remote patient monitoring platforms further amplifies the demand for portable diagnostic tools like handheld ultrasound.
Key Players Shaping the Handheld Ultrasound Devices Industry Market
- Fukuda Denshi Co Ltd
- Siemens Healthineers
- GE Healthcare
- Hitachi Ltd
- Koninklijke Philips NV
- Fujifilm SonoSite Inc
- Canon Medical Systems Corporation
- Shenzhen Mindray
- Samsung Healthcare
Notable Milestones in Handheld Ultrasound Devices Industry Sector
- 2020 May: Fujifilm SonoSite launches a new generation of portable ultrasound devices with enhanced AI features.
- 2021 January: Siemens Healthineers announces strategic partnerships to accelerate AI integration in its ultrasound portfolio.
- 2022 April: GE Healthcare introduces advanced wireless connectivity for its handheld ultrasound systems, improving workflow efficiency.
- 2023 July: Koninklijke Philips NV expands its handheld ultrasound offerings with a focus on critical care applications.
- 2024 February: Samsung Healthcare showcases innovative ultrasound technology with integrated cloud-based data management solutions.
In-Depth Handheld Ultrasound Devices Industry Market Outlook
The future outlook for the Handheld Ultrasound Devices market is exceptionally promising, driven by ongoing technological advancements and an expanding global demand for accessible diagnostic solutions. The continuous integration of AI and machine learning is set to enhance diagnostic accuracy and efficiency, making these devices even more indispensable. Strategic collaborations and market expansion into underserved regions will be pivotal in capturing untapped potential. The growing emphasis on preventative healthcare and the increasing adoption of telehealth further solidify the market's growth trajectory, positioning handheld ultrasound devices as a cornerstone of modern, patient-centric healthcare delivery. The market is expected to see significant growth in specialized applications and innovative use cases, driving continued investment and development.
Handheld Ultrasound Devices Industry Segmentation
-
1. Type of Device
- 1.1. Mobile Ultrasound Device
- 1.2. Handheld Ultrasound Device
-
2. Application
- 2.1. Gynecology
- 2.2. Cardiovascular
- 2.3. Urology
- 2.4. Musculoskeletal
- 2.5. Anesthesiology
- 2.6. Others
Handheld Ultrasound Devices Industry Segmentation By Geography
-
1. North America
- 1.1. United States
- 1.2. Canada
- 1.3. Mexico
-
2. Europe
- 2.1. Germany
- 2.2. United Kingdom
- 2.3. France
- 2.4. Italy
- 2.5. Spain
- 2.6. Rest of Europe
-
3. Asia Pacific
- 3.1. China
- 3.2. Japan
- 3.3. India
- 3.4. Australia
- 3.5. South Korea
- 3.6. Rest of Asia Pacific
- 4. Middle East
-
5. GCC
- 5.1. South Africa
- 5.2. Rest of Middle East
-
6. South America
- 6.1. Brazil
- 6.2. Argentina
- 6.3. Rest of South America
Handheld Ultrasound Devices Industry Regional Market Share
Geographic Coverage of Handheld Ultrasound Devices Industry
Handheld Ultrasound Devices Industry REPORT HIGHLIGHTS
| Aspects | Details |
|---|---|
| Study Period | 2020-2034 |
| Base Year | 2025 |
| Estimated Year | 2026 |
| Forecast Period | 2026-2034 |
| Historical Period | 2020-2025 |
| Growth Rate | CAGR of 6.23% from 2020-2034 |
| Segmentation |
|
Table of Contents
- 1. Introduction
- 1.1. Research Scope
- 1.2. Market Segmentation
- 1.3. Research Objective
- 1.4. Definitions and Assumptions
- 2. Executive Summary
- 2.1. Market Snapshot
- 3. Market Dynamics
- 3.1. Market Drivers
- 3.2. Market Restrains
- 3.3. Market Trends
- 3.4. Market Opportunities
- 4. Market Factor Analysis
- 4.1. Porters Five Forces
- 4.1.1. Bargaining Power of Suppliers
- 4.1.2. Bargaining Power of Buyers
- 4.1.3. Threat of New Entrants
- 4.1.4. Threat of Substitutes
- 4.1.5. Competitive Rivalry
- 4.2. PESTEL analysis
- 4.3. BCG Analysis
- 4.3.1. Stars (High Growth, High Market Share)
- 4.3.2. Cash Cows (Low Growth, High Market Share)
- 4.3.3. Question Mark (High Growth, Low Market Share)
- 4.3.4. Dogs (Low Growth, Low Market Share)
- 4.4. Ansoff Matrix Analysis
- 4.5. Supply Chain Analysis
- 4.6. Regulatory Landscape
- 4.7. Current Market Potential and Opportunity Assessment (TAM–SAM–SOM Framework)
- 4.8. VDR Analyst Note
- 4.1. Porters Five Forces
- 5. Market Analysis, Insights and Forecast 2021-2033
- 5.1. Market Analysis, Insights and Forecast - by Type of Device
- 5.1.1. Mobile Ultrasound Device
- 5.1.2. Handheld Ultrasound Device
- 5.2. Market Analysis, Insights and Forecast - by Application
- 5.2.1. Gynecology
- 5.2.2. Cardiovascular
- 5.2.3. Urology
- 5.2.4. Musculoskeletal
- 5.2.5. Anesthesiology
- 5.2.6. Others
- 5.3. Market Analysis, Insights and Forecast - by Region
- 5.3.1. North America
- 5.3.2. Europe
- 5.3.3. Asia Pacific
- 5.3.4. Middle East
- 5.3.5. GCC
- 5.3.6. South America
- 5.1. Market Analysis, Insights and Forecast - by Type of Device
- 6. Global Handheld Ultrasound Devices Industry Analysis, Insights and Forecast, 2021-2033
- 6.1. Market Analysis, Insights and Forecast - by Type of Device
- 6.1.1. Mobile Ultrasound Device
- 6.1.2. Handheld Ultrasound Device
- 6.2. Market Analysis, Insights and Forecast - by Application
- 6.2.1. Gynecology
- 6.2.2. Cardiovascular
- 6.2.3. Urology
- 6.2.4. Musculoskeletal
- 6.2.5. Anesthesiology
- 6.2.6. Others
- 6.1. Market Analysis, Insights and Forecast - by Type of Device
- 7. North America Handheld Ultrasound Devices Industry Analysis, Insights and Forecast, 2021-2033
- 7.1. Market Analysis, Insights and Forecast - by Type of Device
- 7.1.1. Mobile Ultrasound Device
- 7.1.2. Handheld Ultrasound Device
- 7.2. Market Analysis, Insights and Forecast - by Application
- 7.2.1. Gynecology
- 7.2.2. Cardiovascular
- 7.2.3. Urology
- 7.2.4. Musculoskeletal
- 7.2.5. Anesthesiology
- 7.2.6. Others
- 7.1. Market Analysis, Insights and Forecast - by Type of Device
- 8. Europe Handheld Ultrasound Devices Industry Analysis, Insights and Forecast, 2021-2033
- 8.1. Market Analysis, Insights and Forecast - by Type of Device
- 8.1.1. Mobile Ultrasound Device
- 8.1.2. Handheld Ultrasound Device
- 8.2. Market Analysis, Insights and Forecast - by Application
- 8.2.1. Gynecology
- 8.2.2. Cardiovascular
- 8.2.3. Urology
- 8.2.4. Musculoskeletal
- 8.2.5. Anesthesiology
- 8.2.6. Others
- 8.1. Market Analysis, Insights and Forecast - by Type of Device
- 9. Asia Pacific Handheld Ultrasound Devices Industry Analysis, Insights and Forecast, 2021-2033
- 9.1. Market Analysis, Insights and Forecast - by Type of Device
- 9.1.1. Mobile Ultrasound Device
- 9.1.2. Handheld Ultrasound Device
- 9.2. Market Analysis, Insights and Forecast - by Application
- 9.2.1. Gynecology
- 9.2.2. Cardiovascular
- 9.2.3. Urology
- 9.2.4. Musculoskeletal
- 9.2.5. Anesthesiology
- 9.2.6. Others
- 9.1. Market Analysis, Insights and Forecast - by Type of Device
- 10. Middle East Handheld Ultrasound Devices Industry Analysis, Insights and Forecast, 2021-2033
- 10.1. Market Analysis, Insights and Forecast - by Type of Device
- 10.1.1. Mobile Ultrasound Device
- 10.1.2. Handheld Ultrasound Device
- 10.2. Market Analysis, Insights and Forecast - by Application
- 10.2.1. Gynecology
- 10.2.2. Cardiovascular
- 10.2.3. Urology
- 10.2.4. Musculoskeletal
- 10.2.5. Anesthesiology
- 10.2.6. Others
- 10.1. Market Analysis, Insights and Forecast - by Type of Device
- 11. GCC Handheld Ultrasound Devices Industry Analysis, Insights and Forecast, 2021-2033
- 11.1. Market Analysis, Insights and Forecast - by Type of Device
- 11.1.1. Mobile Ultrasound Device
- 11.1.2. Handheld Ultrasound Device
- 11.2. Market Analysis, Insights and Forecast - by Application
- 11.2.1. Gynecology
- 11.2.2. Cardiovascular
- 11.2.3. Urology
- 11.2.4. Musculoskeletal
- 11.2.5. Anesthesiology
- 11.2.6. Others
- 11.1. Market Analysis, Insights and Forecast - by Type of Device
- 12. South America Handheld Ultrasound Devices Industry Analysis, Insights and Forecast, 2021-2033
- 12.1. Market Analysis, Insights and Forecast - by Type of Device
- 12.1.1. Mobile Ultrasound Device
- 12.1.2. Handheld Ultrasound Device
- 12.2. Market Analysis, Insights and Forecast - by Application
- 12.2.1. Gynecology
- 12.2.2. Cardiovascular
- 12.2.3. Urology
- 12.2.4. Musculoskeletal
- 12.2.5. Anesthesiology
- 12.2.6. Others
- 12.1. Market Analysis, Insights and Forecast - by Type of Device
- 13. Competitive Analysis
- 13.1. Company Profiles
- 13.1.1 Fukuda Denshi Co Ltd
- 13.1.1.1. Company Overview
- 13.1.1.2. Products
- 13.1.1.3. Company Financials
- 13.1.1.4. SWOT Analysis
- 13.1.2 Siemens Healthineers
- 13.1.2.1. Company Overview
- 13.1.2.2. Products
- 13.1.2.3. Company Financials
- 13.1.2.4. SWOT Analysis
- 13.1.3 GE Healthcare
- 13.1.3.1. Company Overview
- 13.1.3.2. Products
- 13.1.3.3. Company Financials
- 13.1.3.4. SWOT Analysis
- 13.1.4 Hitachi Ltd
- 13.1.4.1. Company Overview
- 13.1.4.2. Products
- 13.1.4.3. Company Financials
- 13.1.4.4. SWOT Analysis
- 13.1.5 Koninklijke Philips NV
- 13.1.5.1. Company Overview
- 13.1.5.2. Products
- 13.1.5.3. Company Financials
- 13.1.5.4. SWOT Analysis
- 13.1.6 Fujifilm SonoSite Inc
- 13.1.6.1. Company Overview
- 13.1.6.2. Products
- 13.1.6.3. Company Financials
- 13.1.6.4. SWOT Analysis
- 13.1.7 Canon Medical Systems Corporation
- 13.1.7.1. Company Overview
- 13.1.7.2. Products
- 13.1.7.3. Company Financials
- 13.1.7.4. SWOT Analysis
- 13.1.8 Shenzhen Mindray
- 13.1.8.1. Company Overview
- 13.1.8.2. Products
- 13.1.8.3. Company Financials
- 13.1.8.4. SWOT Analysis
- 13.1.9 Samsung Healthcare
- 13.1.9.1. Company Overview
- 13.1.9.2. Products
- 13.1.9.3. Company Financials
- 13.1.9.4. SWOT Analysis
- 13.1.1 Fukuda Denshi Co Ltd
- 13.2. Market Entropy
- 13.2.1 Company's Key Areas Served
- 13.2.2 Recent Developments
- 13.3. Company Market Share Analysis 2025
- 13.3.1 Top 5 Companies Market Share Analysis
- 13.3.2 Top 3 Companies Market Share Analysis
- 13.4. List of Potential Customers
- 14. Research Methodology
List of Figures
- Figure 1: Global Handheld Ultrasound Devices Industry Revenue Breakdown (Million, %) by Region 2025 & 2033
- Figure 2: Global Handheld Ultrasound Devices Industry Volume Breakdown (K Unit, %) by Region 2025 & 2033
- Figure 3: North America Handheld Ultrasound Devices Industry Revenue (Million), by Type of Device 2025 & 2033
- Figure 4: North America Handheld Ultrasound Devices Industry Volume (K Unit), by Type of Device 2025 & 2033
- Figure 5: North America Handheld Ultrasound Devices Industry Revenue Share (%), by Type of Device 2025 & 2033
- Figure 6: North America Handheld Ultrasound Devices Industry Volume Share (%), by Type of Device 2025 & 2033
- Figure 7: North America Handheld Ultrasound Devices Industry Revenue (Million), by Application 2025 & 2033
- Figure 8: North America Handheld Ultrasound Devices Industry Volume (K Unit), by Application 2025 & 2033
- Figure 9: North America Handheld Ultrasound Devices Industry Revenue Share (%), by Application 2025 & 2033
- Figure 10: North America Handheld Ultrasound Devices Industry Volume Share (%), by Application 2025 & 2033
- Figure 11: North America Handheld Ultrasound Devices Industry Revenue (Million), by Country 2025 & 2033
- Figure 12: North America Handheld Ultrasound Devices Industry Volume (K Unit), by Country 2025 & 2033
- Figure 13: North America Handheld Ultrasound Devices Industry Revenue Share (%), by Country 2025 & 2033
- Figure 14: North America Handheld Ultrasound Devices Industry Volume Share (%), by Country 2025 & 2033
- Figure 15: Europe Handheld Ultrasound Devices Industry Revenue (Million), by Type of Device 2025 & 2033
- Figure 16: Europe Handheld Ultrasound Devices Industry Volume (K Unit), by Type of Device 2025 & 2033
- Figure 17: Europe Handheld Ultrasound Devices Industry Revenue Share (%), by Type of Device 2025 & 2033
- Figure 18: Europe Handheld Ultrasound Devices Industry Volume Share (%), by Type of Device 2025 & 2033
- Figure 19: Europe Handheld Ultrasound Devices Industry Revenue (Million), by Application 2025 & 2033
- Figure 20: Europe Handheld Ultrasound Devices Industry Volume (K Unit), by Application 2025 & 2033
- Figure 21: Europe Handheld Ultrasound Devices Industry Revenue Share (%), by Application 2025 & 2033
- Figure 22: Europe Handheld Ultrasound Devices Industry Volume Share (%), by Application 2025 & 2033
- Figure 23: Europe Handheld Ultrasound Devices Industry Revenue (Million), by Country 2025 & 2033
- Figure 24: Europe Handheld Ultrasound Devices Industry Volume (K Unit), by Country 2025 & 2033
- Figure 25: Europe Handheld Ultrasound Devices Industry Revenue Share (%), by Country 2025 & 2033
- Figure 26: Europe Handheld Ultrasound Devices Industry Volume Share (%), by Country 2025 & 2033
- Figure 27: Asia Pacific Handheld Ultrasound Devices Industry Revenue (Million), by Type of Device 2025 & 2033
- Figure 28: Asia Pacific Handheld Ultrasound Devices Industry Volume (K Unit), by Type of Device 2025 & 2033
- Figure 29: Asia Pacific Handheld Ultrasound Devices Industry Revenue Share (%), by Type of Device 2025 & 2033
- Figure 30: Asia Pacific Handheld Ultrasound Devices Industry Volume Share (%), by Type of Device 2025 & 2033
- Figure 31: Asia Pacific Handheld Ultrasound Devices Industry Revenue (Million), by Application 2025 & 2033
- Figure 32: Asia Pacific Handheld Ultrasound Devices Industry Volume (K Unit), by Application 2025 & 2033
- Figure 33: Asia Pacific Handheld Ultrasound Devices Industry Revenue Share (%), by Application 2025 & 2033
- Figure 34: Asia Pacific Handheld Ultrasound Devices Industry Volume Share (%), by Application 2025 & 2033
- Figure 35: Asia Pacific Handheld Ultrasound Devices Industry Revenue (Million), by Country 2025 & 2033
- Figure 36: Asia Pacific Handheld Ultrasound Devices Industry Volume (K Unit), by Country 2025 & 2033
- Figure 37: Asia Pacific Handheld Ultrasound Devices Industry Revenue Share (%), by Country 2025 & 2033
- Figure 38: Asia Pacific Handheld Ultrasound Devices Industry Volume Share (%), by Country 2025 & 2033
- Figure 39: Middle East Handheld Ultrasound Devices Industry Revenue (Million), by Type of Device 2025 & 2033
- Figure 40: Middle East Handheld Ultrasound Devices Industry Volume (K Unit), by Type of Device 2025 & 2033
- Figure 41: Middle East Handheld Ultrasound Devices Industry Revenue Share (%), by Type of Device 2025 & 2033
- Figure 42: Middle East Handheld Ultrasound Devices Industry Volume Share (%), by Type of Device 2025 & 2033
- Figure 43: Middle East Handheld Ultrasound Devices Industry Revenue (Million), by Application 2025 & 2033
- Figure 44: Middle East Handheld Ultrasound Devices Industry Volume (K Unit), by Application 2025 & 2033
- Figure 45: Middle East Handheld Ultrasound Devices Industry Revenue Share (%), by Application 2025 & 2033
- Figure 46: Middle East Handheld Ultrasound Devices Industry Volume Share (%), by Application 2025 & 2033
- Figure 47: Middle East Handheld Ultrasound Devices Industry Revenue (Million), by Country 2025 & 2033
- Figure 48: Middle East Handheld Ultrasound Devices Industry Volume (K Unit), by Country 2025 & 2033
- Figure 49: Middle East Handheld Ultrasound Devices Industry Revenue Share (%), by Country 2025 & 2033
- Figure 50: Middle East Handheld Ultrasound Devices Industry Volume Share (%), by Country 2025 & 2033
- Figure 51: GCC Handheld Ultrasound Devices Industry Revenue (Million), by Type of Device 2025 & 2033
- Figure 52: GCC Handheld Ultrasound Devices Industry Volume (K Unit), by Type of Device 2025 & 2033
- Figure 53: GCC Handheld Ultrasound Devices Industry Revenue Share (%), by Type of Device 2025 & 2033
- Figure 54: GCC Handheld Ultrasound Devices Industry Volume Share (%), by Type of Device 2025 & 2033
- Figure 55: GCC Handheld Ultrasound Devices Industry Revenue (Million), by Application 2025 & 2033
- Figure 56: GCC Handheld Ultrasound Devices Industry Volume (K Unit), by Application 2025 & 2033
- Figure 57: GCC Handheld Ultrasound Devices Industry Revenue Share (%), by Application 2025 & 2033
- Figure 58: GCC Handheld Ultrasound Devices Industry Volume Share (%), by Application 2025 & 2033
- Figure 59: GCC Handheld Ultrasound Devices Industry Revenue (Million), by Country 2025 & 2033
- Figure 60: GCC Handheld Ultrasound Devices Industry Volume (K Unit), by Country 2025 & 2033
- Figure 61: GCC Handheld Ultrasound Devices Industry Revenue Share (%), by Country 2025 & 2033
- Figure 62: GCC Handheld Ultrasound Devices Industry Volume Share (%), by Country 2025 & 2033
- Figure 63: South America Handheld Ultrasound Devices Industry Revenue (Million), by Type of Device 2025 & 2033
- Figure 64: South America Handheld Ultrasound Devices Industry Volume (K Unit), by Type of Device 2025 & 2033
- Figure 65: South America Handheld Ultrasound Devices Industry Revenue Share (%), by Type of Device 2025 & 2033
- Figure 66: South America Handheld Ultrasound Devices Industry Volume Share (%), by Type of Device 2025 & 2033
- Figure 67: South America Handheld Ultrasound Devices Industry Revenue (Million), by Application 2025 & 2033
- Figure 68: South America Handheld Ultrasound Devices Industry Volume (K Unit), by Application 2025 & 2033
- Figure 69: South America Handheld Ultrasound Devices Industry Revenue Share (%), by Application 2025 & 2033
- Figure 70: South America Handheld Ultrasound Devices Industry Volume Share (%), by Application 2025 & 2033
- Figure 71: South America Handheld Ultrasound Devices Industry Revenue (Million), by Country 2025 & 2033
- Figure 72: South America Handheld Ultrasound Devices Industry Volume (K Unit), by Country 2025 & 2033
- Figure 73: South America Handheld Ultrasound Devices Industry Revenue Share (%), by Country 2025 & 2033
- Figure 74: South America Handheld Ultrasound Devices Industry Volume Share (%), by Country 2025 & 2033
List of Tables
- Table 1: Global Handheld Ultrasound Devices Industry Revenue Million Forecast, by Type of Device 2020 & 2033
- Table 2: Global Handheld Ultrasound Devices Industry Volume K Unit Forecast, by Type of Device 2020 & 2033
- Table 3: Global Handheld Ultrasound Devices Industry Revenue Million Forecast, by Application 2020 & 2033
- Table 4: Global Handheld Ultrasound Devices Industry Volume K Unit Forecast, by Application 2020 & 2033
- Table 5: Global Handheld Ultrasound Devices Industry Revenue Million Forecast, by Region 2020 & 2033
- Table 6: Global Handheld Ultrasound Devices Industry Volume K Unit Forecast, by Region 2020 & 2033
- Table 7: Global Handheld Ultrasound Devices Industry Revenue Million Forecast, by Type of Device 2020 & 2033
- Table 8: Global Handheld Ultrasound Devices Industry Volume K Unit Forecast, by Type of Device 2020 & 2033
- Table 9: Global Handheld Ultrasound Devices Industry Revenue Million Forecast, by Application 2020 & 2033
- Table 10: Global Handheld Ultrasound Devices Industry Volume K Unit Forecast, by Application 2020 & 2033
- Table 11: Global Handheld Ultrasound Devices Industry Revenue Million Forecast, by Country 2020 & 2033
- Table 12: Global Handheld Ultrasound Devices Industry Volume K Unit Forecast, by Country 2020 & 2033
- Table 13: United States Handheld Ultrasound Devices Industry Revenue (Million) Forecast, by Application 2020 & 2033
- Table 14: United States Handheld Ultrasound Devices Industry Volume (K Unit) Forecast, by Application 2020 & 2033
- Table 15: Canada Handheld Ultrasound Devices Industry Revenue (Million) Forecast, by Application 2020 & 2033
- Table 16: Canada Handheld Ultrasound Devices Industry Volume (K Unit) Forecast, by Application 2020 & 2033
- Table 17: Mexico Handheld Ultrasound Devices Industry Revenue (Million) Forecast, by Application 2020 & 2033
- Table 18: Mexico Handheld Ultrasound Devices Industry Volume (K Unit) Forecast, by Application 2020 & 2033
- Table 19: Global Handheld Ultrasound Devices Industry Revenue Million Forecast, by Type of Device 2020 & 2033
- Table 20: Global Handheld Ultrasound Devices Industry Volume K Unit Forecast, by Type of Device 2020 & 2033
- Table 21: Global Handheld Ultrasound Devices Industry Revenue Million Forecast, by Application 2020 & 2033
- Table 22: Global Handheld Ultrasound Devices Industry Volume K Unit Forecast, by Application 2020 & 2033
- Table 23: Global Handheld Ultrasound Devices Industry Revenue Million Forecast, by Country 2020 & 2033
- Table 24: Global Handheld Ultrasound Devices Industry Volume K Unit Forecast, by Country 2020 & 2033
- Table 25: Germany Handheld Ultrasound Devices Industry Revenue (Million) Forecast, by Application 2020 & 2033
- Table 26: Germany Handheld Ultrasound Devices Industry Volume (K Unit) Forecast, by Application 2020 & 2033
- Table 27: United Kingdom Handheld Ultrasound Devices Industry Revenue (Million) Forecast, by Application 2020 & 2033
- Table 28: United Kingdom Handheld Ultrasound Devices Industry Volume (K Unit) Forecast, by Application 2020 & 2033
- Table 29: France Handheld Ultrasound Devices Industry Revenue (Million) Forecast, by Application 2020 & 2033
- Table 30: France Handheld Ultrasound Devices Industry Volume (K Unit) Forecast, by Application 2020 & 2033
- Table 31: Italy Handheld Ultrasound Devices Industry Revenue (Million) Forecast, by Application 2020 & 2033
- Table 32: Italy Handheld Ultrasound Devices Industry Volume (K Unit) Forecast, by Application 2020 & 2033
- Table 33: Spain Handheld Ultrasound Devices Industry Revenue (Million) Forecast, by Application 2020 & 2033
- Table 34: Spain Handheld Ultrasound Devices Industry Volume (K Unit) Forecast, by Application 2020 & 2033
- Table 35: Rest of Europe Handheld Ultrasound Devices Industry Revenue (Million) Forecast, by Application 2020 & 2033
- Table 36: Rest of Europe Handheld Ultrasound Devices Industry Volume (K Unit) Forecast, by Application 2020 & 2033
- Table 37: Global Handheld Ultrasound Devices Industry Revenue Million Forecast, by Type of Device 2020 & 2033
- Table 38: Global Handheld Ultrasound Devices Industry Volume K Unit Forecast, by Type of Device 2020 & 2033
- Table 39: Global Handheld Ultrasound Devices Industry Revenue Million Forecast, by Application 2020 & 2033
- Table 40: Global Handheld Ultrasound Devices Industry Volume K Unit Forecast, by Application 2020 & 2033
- Table 41: Global Handheld Ultrasound Devices Industry Revenue Million Forecast, by Country 2020 & 2033
- Table 42: Global Handheld Ultrasound Devices Industry Volume K Unit Forecast, by Country 2020 & 2033
- Table 43: China Handheld Ultrasound Devices Industry Revenue (Million) Forecast, by Application 2020 & 2033
- Table 44: China Handheld Ultrasound Devices Industry Volume (K Unit) Forecast, by Application 2020 & 2033
- Table 45: Japan Handheld Ultrasound Devices Industry Revenue (Million) Forecast, by Application 2020 & 2033
- Table 46: Japan Handheld Ultrasound Devices Industry Volume (K Unit) Forecast, by Application 2020 & 2033
- Table 47: India Handheld Ultrasound Devices Industry Revenue (Million) Forecast, by Application 2020 & 2033
- Table 48: India Handheld Ultrasound Devices Industry Volume (K Unit) Forecast, by Application 2020 & 2033
- Table 49: Australia Handheld Ultrasound Devices Industry Revenue (Million) Forecast, by Application 2020 & 2033
- Table 50: Australia Handheld Ultrasound Devices Industry Volume (K Unit) Forecast, by Application 2020 & 2033
- Table 51: South Korea Handheld Ultrasound Devices Industry Revenue (Million) Forecast, by Application 2020 & 2033
- Table 52: South Korea Handheld Ultrasound Devices Industry Volume (K Unit) Forecast, by Application 2020 & 2033
- Table 53: Rest of Asia Pacific Handheld Ultrasound Devices Industry Revenue (Million) Forecast, by Application 2020 & 2033
- Table 54: Rest of Asia Pacific Handheld Ultrasound Devices Industry Volume (K Unit) Forecast, by Application 2020 & 2033
- Table 55: Global Handheld Ultrasound Devices Industry Revenue Million Forecast, by Type of Device 2020 & 2033
- Table 56: Global Handheld Ultrasound Devices Industry Volume K Unit Forecast, by Type of Device 2020 & 2033
- Table 57: Global Handheld Ultrasound Devices Industry Revenue Million Forecast, by Application 2020 & 2033
- Table 58: Global Handheld Ultrasound Devices Industry Volume K Unit Forecast, by Application 2020 & 2033
- Table 59: Global Handheld Ultrasound Devices Industry Revenue Million Forecast, by Country 2020 & 2033
- Table 60: Global Handheld Ultrasound Devices Industry Volume K Unit Forecast, by Country 2020 & 2033
- Table 61: Global Handheld Ultrasound Devices Industry Revenue Million Forecast, by Type of Device 2020 & 2033
- Table 62: Global Handheld Ultrasound Devices Industry Volume K Unit Forecast, by Type of Device 2020 & 2033
- Table 63: Global Handheld Ultrasound Devices Industry Revenue Million Forecast, by Application 2020 & 2033
- Table 64: Global Handheld Ultrasound Devices Industry Volume K Unit Forecast, by Application 2020 & 2033
- Table 65: Global Handheld Ultrasound Devices Industry Revenue Million Forecast, by Country 2020 & 2033
- Table 66: Global Handheld Ultrasound Devices Industry Volume K Unit Forecast, by Country 2020 & 2033
- Table 67: South Africa Handheld Ultrasound Devices Industry Revenue (Million) Forecast, by Application 2020 & 2033
- Table 68: South Africa Handheld Ultrasound Devices Industry Volume (K Unit) Forecast, by Application 2020 & 2033
- Table 69: Rest of Middle East Handheld Ultrasound Devices Industry Revenue (Million) Forecast, by Application 2020 & 2033
- Table 70: Rest of Middle East Handheld Ultrasound Devices Industry Volume (K Unit) Forecast, by Application 2020 & 2033
- Table 71: Global Handheld Ultrasound Devices Industry Revenue Million Forecast, by Type of Device 2020 & 2033
- Table 72: Global Handheld Ultrasound Devices Industry Volume K Unit Forecast, by Type of Device 2020 & 2033
- Table 73: Global Handheld Ultrasound Devices Industry Revenue Million Forecast, by Application 2020 & 2033
- Table 74: Global Handheld Ultrasound Devices Industry Volume K Unit Forecast, by Application 2020 & 2033
- Table 75: Global Handheld Ultrasound Devices Industry Revenue Million Forecast, by Country 2020 & 2033
- Table 76: Global Handheld Ultrasound Devices Industry Volume K Unit Forecast, by Country 2020 & 2033
- Table 77: Brazil Handheld Ultrasound Devices Industry Revenue (Million) Forecast, by Application 2020 & 2033
- Table 78: Brazil Handheld Ultrasound Devices Industry Volume (K Unit) Forecast, by Application 2020 & 2033
- Table 79: Argentina Handheld Ultrasound Devices Industry Revenue (Million) Forecast, by Application 2020 & 2033
- Table 80: Argentina Handheld Ultrasound Devices Industry Volume (K Unit) Forecast, by Application 2020 & 2033
- Table 81: Rest of South America Handheld Ultrasound Devices Industry Revenue (Million) Forecast, by Application 2020 & 2033
- Table 82: Rest of South America Handheld Ultrasound Devices Industry Volume (K Unit) Forecast, by Application 2020 & 2033
Frequently Asked Questions
1. What is the projected Compound Annual Growth Rate (CAGR) of the Handheld Ultrasound Devices Industry?
The projected CAGR is approximately 6.23%.
2. Which companies are prominent players in the Handheld Ultrasound Devices Industry?
Key companies in the market include Fukuda Denshi Co Ltd, Siemens Healthineers, GE Healthcare, Hitachi Ltd, Koninklijke Philips NV, Fujifilm SonoSite Inc, Canon Medical Systems Corporation, Shenzhen Mindray, Samsung Healthcare.
3. What are the main segments of the Handheld Ultrasound Devices Industry?
The market segments include Type of Device, Application.
4. Can you provide details about the market size?
The market size is estimated to be USD 2.86 Million as of 2022.
5. What are some drivers contributing to market growth?
; Increasing Spectrum of Applications of Portable Ultrasound; Rising Advancements in Technology; Increasing Prevalence of Chronic Diseases.
6. What are the notable trends driving market growth?
Mobile Ultrasound Devices is Expected to Grow with High CAGR Over the Forecast Period.
7. Are there any restraints impacting market growth?
; High Cost of Portable Ultrasound Systems; Lack of Dedicated Training Programs by Companies.
8. Can you provide examples of recent developments in the market?
N/A
9. What pricing options are available for accessing the report?
Pricing options include single-user, multi-user, and enterprise licenses priced at USD 4750, USD 5250, and USD 8750 respectively.
10. Is the market size provided in terms of value or volume?
The market size is provided in terms of value, measured in Million and volume, measured in K Unit.
11. Are there any specific market keywords associated with the report?
Yes, the market keyword associated with the report is "Handheld Ultrasound Devices Industry," which aids in identifying and referencing the specific market segment covered.
12. How do I determine which pricing option suits my needs best?
The pricing options vary based on user requirements and access needs. Individual users may opt for single-user licenses, while businesses requiring broader access may choose multi-user or enterprise licenses for cost-effective access to the report.
13. Are there any additional resources or data provided in the Handheld Ultrasound Devices Industry report?
While the report offers comprehensive insights, it's advisable to review the specific contents or supplementary materials provided to ascertain if additional resources or data are available.
14. How can I stay updated on further developments or reports in the Handheld Ultrasound Devices Industry?
To stay informed about further developments, trends, and reports in the Handheld Ultrasound Devices Industry, consider subscribing to industry newsletters, following relevant companies and organizations, or regularly checking reputable industry news sources and publications.
Methodology
Step 1 - Identification of Relevant Samples Size from Population Database


Step 2 - Approaches for Defining Global Market Size (Value, Volume* & Price*)

Note*: In applicable scenarios
Step 3 - Data Sources
Primary Research
- Web Analytics
- Survey Reports
- Research Institute
- Latest Research Reports
- Opinion Leaders
Secondary Research
- Annual Reports
- White Paper
- Latest Press Release
- Industry Association
- Paid Database
- Investor Presentations

Step 4 - Data Triangulation
Involves using different sources of information in order to increase the validity of a study
These sources are likely to be stakeholders in a program - participants, other researchers, program staff, other community members, and so on.
Then we put all data in single framework & apply various statistical tools to find out the dynamic on the market.
During the analysis stage, feedback from the stakeholder groups would be compared to determine areas of agreement as well as areas of divergence

