

Key Insights
The global Dental CAD (Computer-Aided Design) market is poised for significant expansion, driven by technological innovation, increasing demand for personalized dental solutions, and a growing need for advanced dental treatments. Advancements in CAD/CAM software and hardware, including enhanced processing capabilities and precision, are revolutionizing the creation of dental prosthetics and implants. The rising preference for aesthetically superior and customized restorations further fuels market growth. Concurrently, the increasing incidence of dental conditions and an aging global population are augmenting the demand for dental care, thereby elevating the need for CAD/CAM systems. The market is segmented by components such as scanners, milling machines, and software, and by applications including dental prosthetics and implants. While scanners and milling machines currently lead, the software segment is projected for rapid advancement due to ongoing innovation and the integration of artificial intelligence. Geographically, North America and Europe are key markets owing to established dental infrastructure and high adoption of advanced technologies. However, the Asia-Pacific region is expected to experience substantial growth, driven by rising disposable incomes and increased awareness of oral health, supported by expanding dental tourism and the availability of affordable CAD/CAM solutions in emerging economies. The competitive landscape features established leaders like Planmeca, Dentsply Sirona, and 3Shape, alongside emerging players focusing on specialized applications and novel technologies. Key growth drivers include R&D in materials science, leading to advanced biocompatible and esthetic materials, and the integration of sophisticated imaging techniques for improved treatment planning. The increasing adoption of digital dentistry and seamless CAD/CAM integration into workflows will accelerate market penetration. Challenges such as high initial investment costs and the requirement for skilled professionals persist, but the overall market outlook remains highly positive, presenting lucrative opportunities.
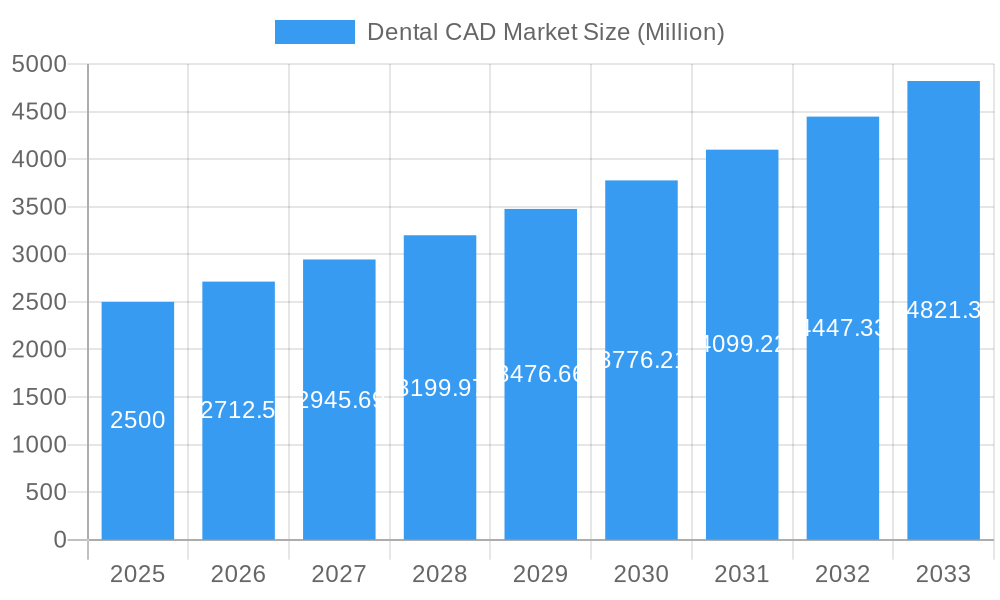
Dental CAD Market Market Size (In Billion)
The forecast period of 2025-2033 is expected to witness a sustained growth trajectory for the Dental CAD market, with a Compound Annual Growth Rate (CAGR) of 8.50%, indicating substantial expansion. Market size is projected to reach $2.94 billion by 2025. This growth is underpinned by ongoing research and development in materials science, fostering the creation of biocompatible and aesthetically superior materials for dental restorations. Furthermore, the integration of advanced imaging techniques with CAD/CAM systems is poised to enhance treatment planning and execution accuracy and efficiency. The escalating focus on digital dentistry and the seamless integration of CAD/CAM technology into dental practice workflows will continue to drive market penetration. Despite challenges such as regulatory complexities and the necessity for continuous professional education, the outlook for the Dental CAD market is optimistic, promising significant opportunities for manufacturers, distributors, and service providers within this technological domain.
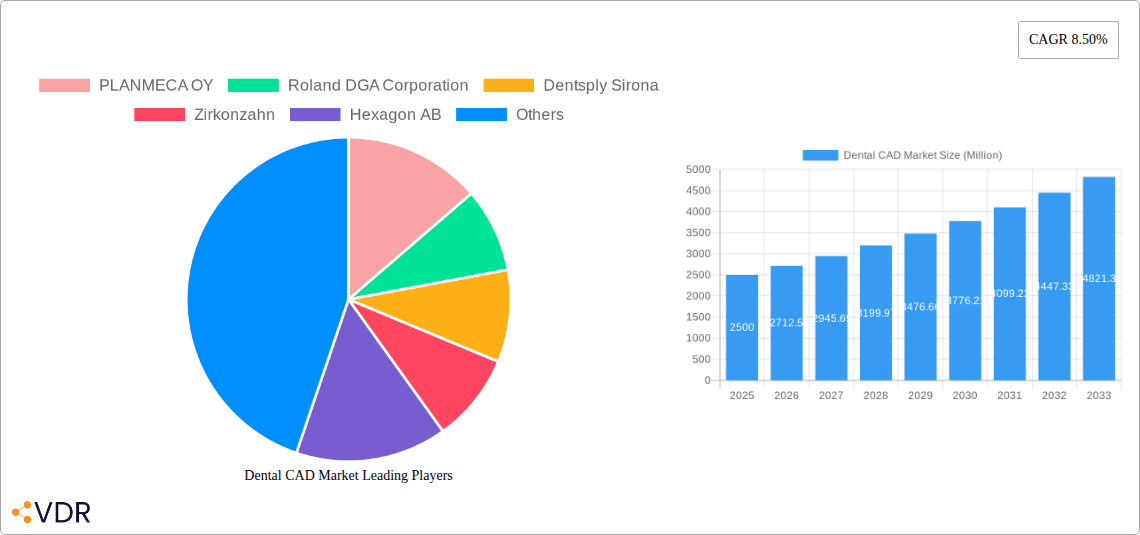
Dental CAD Market Company Market Share
Dental CAD Market: A Comprehensive Market Report (2019-2033)
This in-depth report provides a comprehensive analysis of the Dental CAD market, encompassing market dynamics, growth trends, regional segmentation, product landscape, key players, and future outlook. The report covers the period from 2019 to 2033, with 2025 as the base year and a forecast period from 2025 to 2033. The study segments the market by Component (Scanners, Milling Machines, Software, Other Components) and Application (Dental Prosthesis, Dental Implants), offering granular insights for informed decision-making. The market size is estimated in million units.
Dental CAD Market Market Dynamics & Structure
The Dental CAD market is characterized by a moderately concentrated landscape with key players like Dentsply Sirona, 3Shape, and Planmeca OY holding significant market share (xx%). Technological innovation, particularly in intraoral scanners and CAD/CAM software, is a primary growth driver. Stringent regulatory frameworks governing medical devices influence market access and product development. Competitive pressures exist from established players and emerging companies offering innovative solutions. The market witnesses continuous mergers and acquisitions (M&A) activity, with approximately xx M&A deals recorded between 2019 and 2024. End-user demographics, including the increasing demand for aesthetic dentistry and advanced restorative procedures, further fuel market growth.
- Market Concentration: Moderately concentrated, with top players holding xx% market share.
- Technological Innovation: Advancements in AI-powered imaging, 3D printing, and software integration.
- Regulatory Landscape: Stringent regulatory requirements impacting product approvals and market access.
- Competitive Landscape: Intense competition among established players and emerging innovative companies.
- M&A Activity: Approximately xx M&A deals in the historical period (2019-2024).
- Innovation Barriers: High R&D costs, regulatory hurdles, and integration challenges.
Dental CAD Market Growth Trends & Insights
The global Dental CAD market experienced robust growth during the historical period (2019-2024), with a CAGR of xx%. This growth is attributed to factors such as the rising prevalence of dental diseases, increasing demand for minimally invasive procedures, and technological advancements in CAD/CAM systems. The market penetration of digital dentistry solutions is steadily increasing, driven by factors such as enhanced accuracy, reduced treatment time, and improved patient comfort. Technological disruptions, including the integration of AI and machine learning, are transforming the landscape and driving innovation. Shifting consumer preferences towards technologically advanced, aesthetically pleasing dental solutions also contribute to the market growth. The forecast period (2025-2033) anticipates continued growth, albeit at a moderated pace (CAGR of xx%), reaching a market size of xx million units by 2033.
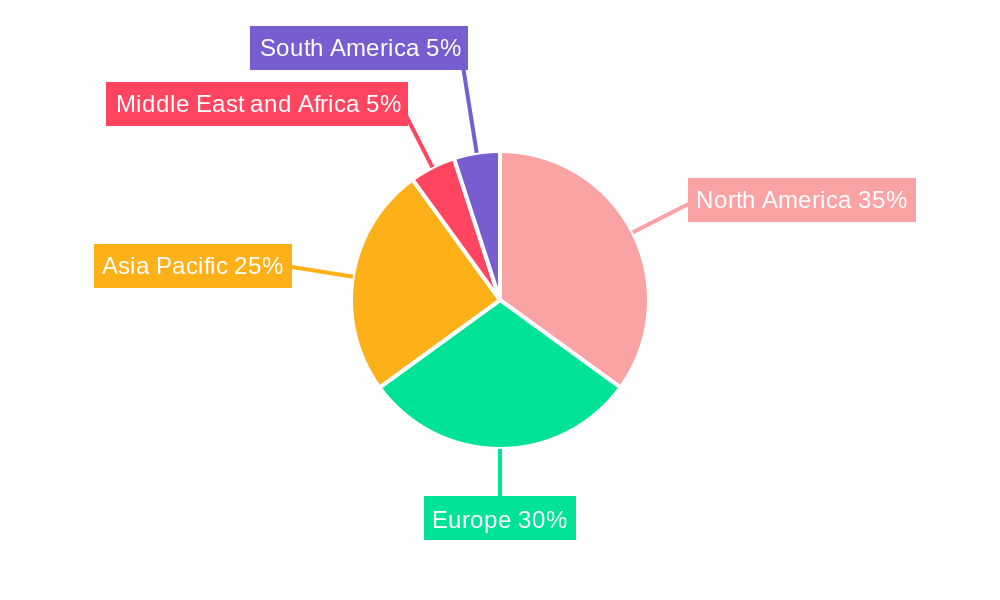
Dominant Regions, Countries, or Segments in Dental CAD Market
North America currently dominates the Dental CAD market, followed by Europe, driven by high healthcare expenditure, advanced infrastructure, and a significant adoption of digital dentistry techniques. Within components, the software segment holds the largest market share due to continuous software enhancements for ease of use and improved integration. The dental prosthesis application segment dominates due to its wider use across various dental procedures.
- Key Regional Drivers:
- North America: High healthcare spending, technological advancements.
- Europe: Growing adoption of digital dentistry, well-established healthcare infrastructure.
- Asia-Pacific: Increasing dental awareness, rising disposable incomes.
- Dominant Segments:
- By Component: Software (largest market share)
- By Application: Dental Prosthesis (largest market share)
- Growth Potential: Significant growth potential exists in emerging markets in Asia-Pacific and Latin America.
Dental CAD Market Product Landscape
The Dental CAD market offers a diverse range of products, including intraoral scanners with advanced imaging capabilities, high-precision milling machines, and user-friendly CAD/CAM software. Recent innovations include AI-powered software for automated design and manufacturing, improved material compatibility, and enhanced connectivity features for seamless workflow integration. Unique selling propositions often include speed, accuracy, ease of use, and cost-effectiveness.
Key Drivers, Barriers & Challenges in Dental CAD Market
Key Drivers:
- Rising prevalence of dental diseases globally.
- Increasing demand for minimally invasive procedures.
- Technological advancements in CAD/CAM systems (AI integration, improved accuracy).
- Growing adoption of digital dentistry techniques.
Challenges & Restraints:
- High initial investment costs for CAD/CAM systems.
- Regulatory hurdles and compliance requirements.
- Skill gap among dental professionals in operating CAD/CAM systems.
- Intense competition among existing players and new entrants. This has resulted in a xx% decrease in average profit margins in the past 2 years.
Emerging Opportunities in Dental CAD Market
- Expansion into emerging markets with growing dental awareness.
- Development of cost-effective CAD/CAM solutions for smaller dental practices.
- Integration of AI and machine learning for automated workflow and improved accuracy.
- Personalized dental solutions based on individual patient needs.
Growth Accelerators in the Dental CAD Market Industry
The long-term growth of the Dental CAD market will be fueled by continuous technological advancements, strategic partnerships between CAD/CAM manufacturers and dental material providers, and the expansion of digital dentistry services into underserved regions. The increasing adoption of cloud-based solutions and the development of open-standard interfaces for seamless integration across different systems will further accelerate growth.
Key Players Shaping the Dental CAD Market Market
Notable Milestones in Dental CAD Market Sector
- September 2022: Planmeca launched a new software module for Planmeca Romexis, streamlining digital impression workflows.
- April 2022: Dentsply Sirona released inLab Software 22.0, featuring a harmonized user interface and expanded design options.
In-Depth Dental CAD Market Market Outlook
The Dental CAD market is poised for continued growth driven by technological advancements, increasing adoption rates, and expansion into new markets. Strategic partnerships and collaborations among key players will further accelerate market expansion. Companies focused on innovation, particularly in AI-powered solutions and integration with other dental technologies, are expected to capture significant market share in the coming years. The market presents lucrative opportunities for companies specializing in developing user-friendly, cost-effective CAD/CAM systems catering to the needs of various dental practices.
Dental CAD Market Segmentation
-
1. Component
- 1.1. Scanners
- 1.2. Milling Machines
- 1.3. Software
- 1.4. Other Components
-
2. Application
- 2.1. Dental Prosthesis
- 2.2. Dental Implants
Dental CAD Market Segmentation By Geography
-
1. North America
- 1.1. United States
- 1.2. Canada
- 1.3. Mexico
-
2. Europe
- 2.1. Germany
- 2.2. United Kingdom
- 2.3. France
- 2.4. Italy
- 2.5. Spain
- 2.6. Rest of Europe
-
3. Asia Pacific
- 3.1. China
- 3.2. Japan
- 3.3. India
- 3.4. Australia
- 3.5. South Korea
- 3.6. Rest of Asia Pacific
-
4. Middle East and Africa
- 4.1. GCC
- 4.2. South Africa
- 4.3. Rest of Middle East and Africa
-
5. South America
- 5.1. Brazil
- 5.2. Argentina
- 5.3. Rest of South America
Dental CAD Market Regional Market Share
Geographic Coverage of Dental CAD Market
Dental CAD Market REPORT HIGHLIGHTS
| Aspects | Details |
|---|---|
| Study Period | 2020-2034 |
| Base Year | 2025 |
| Estimated Year | 2026 |
| Forecast Period | 2026-2034 |
| Historical Period | 2020-2025 |
| Growth Rate | CAGR of 8.5% from 2020-2034 |
| Segmentation |
|
Table of Contents
- 1. Introduction
- 1.1. Research Scope
- 1.2. Market Segmentation
- 1.3. Research Objective
- 1.4. Definitions and Assumptions
- 2. Executive Summary
- 2.1. Market Snapshot
- 3. Market Dynamics
- 3.1. Market Drivers
- 3.2. Market Restrains
- 3.3. Market Trends
- 3.4. Market Opportunities
- 4. Market Factor Analysis
- 4.1. Porters Five Forces
- 4.1.1. Bargaining Power of Suppliers
- 4.1.2. Bargaining Power of Buyers
- 4.1.3. Threat of New Entrants
- 4.1.4. Threat of Substitutes
- 4.1.5. Competitive Rivalry
- 4.2. PESTEL analysis
- 4.3. BCG Analysis
- 4.3.1. Stars (High Growth, High Market Share)
- 4.3.2. Cash Cows (Low Growth, High Market Share)
- 4.3.3. Question Mark (High Growth, Low Market Share)
- 4.3.4. Dogs (Low Growth, Low Market Share)
- 4.4. Ansoff Matrix Analysis
- 4.5. Supply Chain Analysis
- 4.6. Regulatory Landscape
- 4.7. Current Market Potential and Opportunity Assessment (TAM–SAM–SOM Framework)
- 4.8. VDR Analyst Note
- 4.1. Porters Five Forces
- 5. Market Analysis, Insights and Forecast 2021-2033
- 5.1. Market Analysis, Insights and Forecast - by Component
- 5.1.1. Scanners
- 5.1.2. Milling Machines
- 5.1.3. Software
- 5.1.4. Other Components
- 5.2. Market Analysis, Insights and Forecast - by Application
- 5.2.1. Dental Prosthesis
- 5.2.2. Dental Implants
- 5.3. Market Analysis, Insights and Forecast - by Region
- 5.3.1. North America
- 5.3.2. Europe
- 5.3.3. Asia Pacific
- 5.3.4. Middle East and Africa
- 5.3.5. South America
- 5.1. Market Analysis, Insights and Forecast - by Component
- 6. Global Dental CAD Market Analysis, Insights and Forecast, 2021-2033
- 6.1. Market Analysis, Insights and Forecast - by Component
- 6.1.1. Scanners
- 6.1.2. Milling Machines
- 6.1.3. Software
- 6.1.4. Other Components
- 6.2. Market Analysis, Insights and Forecast - by Application
- 6.2.1. Dental Prosthesis
- 6.2.2. Dental Implants
- 6.1. Market Analysis, Insights and Forecast - by Component
- 7. North America Dental CAD Market Analysis, Insights and Forecast, 2021-2033
- 7.1. Market Analysis, Insights and Forecast - by Component
- 7.1.1. Scanners
- 7.1.2. Milling Machines
- 7.1.3. Software
- 7.1.4. Other Components
- 7.2. Market Analysis, Insights and Forecast - by Application
- 7.2.1. Dental Prosthesis
- 7.2.2. Dental Implants
- 7.1. Market Analysis, Insights and Forecast - by Component
- 8. Europe Dental CAD Market Analysis, Insights and Forecast, 2021-2033
- 8.1. Market Analysis, Insights and Forecast - by Component
- 8.1.1. Scanners
- 8.1.2. Milling Machines
- 8.1.3. Software
- 8.1.4. Other Components
- 8.2. Market Analysis, Insights and Forecast - by Application
- 8.2.1. Dental Prosthesis
- 8.2.2. Dental Implants
- 8.1. Market Analysis, Insights and Forecast - by Component
- 9. Asia Pacific Dental CAD Market Analysis, Insights and Forecast, 2021-2033
- 9.1. Market Analysis, Insights and Forecast - by Component
- 9.1.1. Scanners
- 9.1.2. Milling Machines
- 9.1.3. Software
- 9.1.4. Other Components
- 9.2. Market Analysis, Insights and Forecast - by Application
- 9.2.1. Dental Prosthesis
- 9.2.2. Dental Implants
- 9.1. Market Analysis, Insights and Forecast - by Component
- 10. Middle East and Africa Dental CAD Market Analysis, Insights and Forecast, 2021-2033
- 10.1. Market Analysis, Insights and Forecast - by Component
- 10.1.1. Scanners
- 10.1.2. Milling Machines
- 10.1.3. Software
- 10.1.4. Other Components
- 10.2. Market Analysis, Insights and Forecast - by Application
- 10.2.1. Dental Prosthesis
- 10.2.2. Dental Implants
- 10.1. Market Analysis, Insights and Forecast - by Component
- 11. South America Dental CAD Market Analysis, Insights and Forecast, 2021-2033
- 11.1. Market Analysis, Insights and Forecast - by Component
- 11.1.1. Scanners
- 11.1.2. Milling Machines
- 11.1.3. Software
- 11.1.4. Other Components
- 11.2. Market Analysis, Insights and Forecast - by Application
- 11.2.1. Dental Prosthesis
- 11.2.2. Dental Implants
- 11.1. Market Analysis, Insights and Forecast - by Component
- 12. Competitive Analysis
- 12.1. Company Profiles
- 12.1.1 PLANMECA OY
- 12.1.1.1. Company Overview
- 12.1.1.2. Products
- 12.1.1.3. Company Financials
- 12.1.1.4. SWOT Analysis
- 12.1.2 Roland DGA Corporation
- 12.1.2.1. Company Overview
- 12.1.2.2. Products
- 12.1.2.3. Company Financials
- 12.1.2.4. SWOT Analysis
- 12.1.3 Dentsply Sirona
- 12.1.3.1. Company Overview
- 12.1.3.2. Products
- 12.1.3.3. Company Financials
- 12.1.3.4. SWOT Analysis
- 12.1.4 Zirkonzahn
- 12.1.4.1. Company Overview
- 12.1.4.2. Products
- 12.1.4.3. Company Financials
- 12.1.4.4. SWOT Analysis
- 12.1.5 Hexagon AB
- 12.1.5.1. Company Overview
- 12.1.5.2. Products
- 12.1.5.3. Company Financials
- 12.1.5.4. SWOT Analysis
- 12.1.6 Kelkar Dynamics LLP
- 12.1.6.1. Company Overview
- 12.1.6.2. Products
- 12.1.6.3. Company Financials
- 12.1.6.4. SWOT Analysis
- 12.1.7 Amann Girrbach AG
- 12.1.7.1. Company Overview
- 12.1.7.2. Products
- 12.1.7.3. Company Financials
- 12.1.7.4. SWOT Analysis
- 12.1.8 Carestream Dental LLC
- 12.1.8.1. Company Overview
- 12.1.8.2. Products
- 12.1.8.3. Company Financials
- 12.1.8.4. SWOT Analysis
- 12.1.9 3Shape
- 12.1.9.1. Company Overview
- 12.1.9.2. Products
- 12.1.9.3. Company Financials
- 12.1.9.4. SWOT Analysis
- 12.1.10 Align Technology Inc
- 12.1.10.1. Company Overview
- 12.1.10.2. Products
- 12.1.10.3. Company Financials
- 12.1.10.4. SWOT Analysis
- 12.1.11 Envista Holdings Corporation
- 12.1.11.1. Company Overview
- 12.1.11.2. Products
- 12.1.11.3. Company Financials
- 12.1.11.4. SWOT Analysis
- 12.1.12 Datron AG
- 12.1.12.1. Company Overview
- 12.1.12.2. Products
- 12.1.12.3. Company Financials
- 12.1.12.4. SWOT Analysis
- 12.1.13 Institut Straumann AG
- 12.1.13.1. Company Overview
- 12.1.13.2. Products
- 12.1.13.3. Company Financials
- 12.1.13.4. SWOT Analysis
- 12.1.14 ZimVie Inc
- 12.1.14.1. Company Overview
- 12.1.14.2. Products
- 12.1.14.3. Company Financials
- 12.1.14.4. SWOT Analysis
- 12.1.1 PLANMECA OY
- 12.2. Market Entropy
- 12.2.1 Company's Key Areas Served
- 12.2.2 Recent Developments
- 12.3. Company Market Share Analysis 2025
- 12.3.1 Top 5 Companies Market Share Analysis
- 12.3.2 Top 3 Companies Market Share Analysis
- 12.4. List of Potential Customers
- 13. Research Methodology
List of Figures
- Figure 1: Global Dental CAD Market Revenue Breakdown (billion, %) by Region 2025 & 2033
- Figure 2: Global Dental CAD Market Volume Breakdown (K Unit, %) by Region 2025 & 2033
- Figure 3: North America Dental CAD Market Revenue (billion), by Component 2025 & 2033
- Figure 4: North America Dental CAD Market Volume (K Unit), by Component 2025 & 2033
- Figure 5: North America Dental CAD Market Revenue Share (%), by Component 2025 & 2033
- Figure 6: North America Dental CAD Market Volume Share (%), by Component 2025 & 2033
- Figure 7: North America Dental CAD Market Revenue (billion), by Application 2025 & 2033
- Figure 8: North America Dental CAD Market Volume (K Unit), by Application 2025 & 2033
- Figure 9: North America Dental CAD Market Revenue Share (%), by Application 2025 & 2033
- Figure 10: North America Dental CAD Market Volume Share (%), by Application 2025 & 2033
- Figure 11: North America Dental CAD Market Revenue (billion), by Country 2025 & 2033
- Figure 12: North America Dental CAD Market Volume (K Unit), by Country 2025 & 2033
- Figure 13: North America Dental CAD Market Revenue Share (%), by Country 2025 & 2033
- Figure 14: North America Dental CAD Market Volume Share (%), by Country 2025 & 2033
- Figure 15: Europe Dental CAD Market Revenue (billion), by Component 2025 & 2033
- Figure 16: Europe Dental CAD Market Volume (K Unit), by Component 2025 & 2033
- Figure 17: Europe Dental CAD Market Revenue Share (%), by Component 2025 & 2033
- Figure 18: Europe Dental CAD Market Volume Share (%), by Component 2025 & 2033
- Figure 19: Europe Dental CAD Market Revenue (billion), by Application 2025 & 2033
- Figure 20: Europe Dental CAD Market Volume (K Unit), by Application 2025 & 2033
- Figure 21: Europe Dental CAD Market Revenue Share (%), by Application 2025 & 2033
- Figure 22: Europe Dental CAD Market Volume Share (%), by Application 2025 & 2033
- Figure 23: Europe Dental CAD Market Revenue (billion), by Country 2025 & 2033
- Figure 24: Europe Dental CAD Market Volume (K Unit), by Country 2025 & 2033
- Figure 25: Europe Dental CAD Market Revenue Share (%), by Country 2025 & 2033
- Figure 26: Europe Dental CAD Market Volume Share (%), by Country 2025 & 2033
- Figure 27: Asia Pacific Dental CAD Market Revenue (billion), by Component 2025 & 2033
- Figure 28: Asia Pacific Dental CAD Market Volume (K Unit), by Component 2025 & 2033
- Figure 29: Asia Pacific Dental CAD Market Revenue Share (%), by Component 2025 & 2033
- Figure 30: Asia Pacific Dental CAD Market Volume Share (%), by Component 2025 & 2033
- Figure 31: Asia Pacific Dental CAD Market Revenue (billion), by Application 2025 & 2033
- Figure 32: Asia Pacific Dental CAD Market Volume (K Unit), by Application 2025 & 2033
- Figure 33: Asia Pacific Dental CAD Market Revenue Share (%), by Application 2025 & 2033
- Figure 34: Asia Pacific Dental CAD Market Volume Share (%), by Application 2025 & 2033
- Figure 35: Asia Pacific Dental CAD Market Revenue (billion), by Country 2025 & 2033
- Figure 36: Asia Pacific Dental CAD Market Volume (K Unit), by Country 2025 & 2033
- Figure 37: Asia Pacific Dental CAD Market Revenue Share (%), by Country 2025 & 2033
- Figure 38: Asia Pacific Dental CAD Market Volume Share (%), by Country 2025 & 2033
- Figure 39: Middle East and Africa Dental CAD Market Revenue (billion), by Component 2025 & 2033
- Figure 40: Middle East and Africa Dental CAD Market Volume (K Unit), by Component 2025 & 2033
- Figure 41: Middle East and Africa Dental CAD Market Revenue Share (%), by Component 2025 & 2033
- Figure 42: Middle East and Africa Dental CAD Market Volume Share (%), by Component 2025 & 2033
- Figure 43: Middle East and Africa Dental CAD Market Revenue (billion), by Application 2025 & 2033
- Figure 44: Middle East and Africa Dental CAD Market Volume (K Unit), by Application 2025 & 2033
- Figure 45: Middle East and Africa Dental CAD Market Revenue Share (%), by Application 2025 & 2033
- Figure 46: Middle East and Africa Dental CAD Market Volume Share (%), by Application 2025 & 2033
- Figure 47: Middle East and Africa Dental CAD Market Revenue (billion), by Country 2025 & 2033
- Figure 48: Middle East and Africa Dental CAD Market Volume (K Unit), by Country 2025 & 2033
- Figure 49: Middle East and Africa Dental CAD Market Revenue Share (%), by Country 2025 & 2033
- Figure 50: Middle East and Africa Dental CAD Market Volume Share (%), by Country 2025 & 2033
- Figure 51: South America Dental CAD Market Revenue (billion), by Component 2025 & 2033
- Figure 52: South America Dental CAD Market Volume (K Unit), by Component 2025 & 2033
- Figure 53: South America Dental CAD Market Revenue Share (%), by Component 2025 & 2033
- Figure 54: South America Dental CAD Market Volume Share (%), by Component 2025 & 2033
- Figure 55: South America Dental CAD Market Revenue (billion), by Application 2025 & 2033
- Figure 56: South America Dental CAD Market Volume (K Unit), by Application 2025 & 2033
- Figure 57: South America Dental CAD Market Revenue Share (%), by Application 2025 & 2033
- Figure 58: South America Dental CAD Market Volume Share (%), by Application 2025 & 2033
- Figure 59: South America Dental CAD Market Revenue (billion), by Country 2025 & 2033
- Figure 60: South America Dental CAD Market Volume (K Unit), by Country 2025 & 2033
- Figure 61: South America Dental CAD Market Revenue Share (%), by Country 2025 & 2033
- Figure 62: South America Dental CAD Market Volume Share (%), by Country 2025 & 2033
List of Tables
- Table 1: Global Dental CAD Market Revenue billion Forecast, by Component 2020 & 2033
- Table 2: Global Dental CAD Market Volume K Unit Forecast, by Component 2020 & 2033
- Table 3: Global Dental CAD Market Revenue billion Forecast, by Application 2020 & 2033
- Table 4: Global Dental CAD Market Volume K Unit Forecast, by Application 2020 & 2033
- Table 5: Global Dental CAD Market Revenue billion Forecast, by Region 2020 & 2033
- Table 6: Global Dental CAD Market Volume K Unit Forecast, by Region 2020 & 2033
- Table 7: Global Dental CAD Market Revenue billion Forecast, by Component 2020 & 2033
- Table 8: Global Dental CAD Market Volume K Unit Forecast, by Component 2020 & 2033
- Table 9: Global Dental CAD Market Revenue billion Forecast, by Application 2020 & 2033
- Table 10: Global Dental CAD Market Volume K Unit Forecast, by Application 2020 & 2033
- Table 11: Global Dental CAD Market Revenue billion Forecast, by Country 2020 & 2033
- Table 12: Global Dental CAD Market Volume K Unit Forecast, by Country 2020 & 2033
- Table 13: United States Dental CAD Market Revenue (billion) Forecast, by Application 2020 & 2033
- Table 14: United States Dental CAD Market Volume (K Unit) Forecast, by Application 2020 & 2033
- Table 15: Canada Dental CAD Market Revenue (billion) Forecast, by Application 2020 & 2033
- Table 16: Canada Dental CAD Market Volume (K Unit) Forecast, by Application 2020 & 2033
- Table 17: Mexico Dental CAD Market Revenue (billion) Forecast, by Application 2020 & 2033
- Table 18: Mexico Dental CAD Market Volume (K Unit) Forecast, by Application 2020 & 2033
- Table 19: Global Dental CAD Market Revenue billion Forecast, by Component 2020 & 2033
- Table 20: Global Dental CAD Market Volume K Unit Forecast, by Component 2020 & 2033
- Table 21: Global Dental CAD Market Revenue billion Forecast, by Application 2020 & 2033
- Table 22: Global Dental CAD Market Volume K Unit Forecast, by Application 2020 & 2033
- Table 23: Global Dental CAD Market Revenue billion Forecast, by Country 2020 & 2033
- Table 24: Global Dental CAD Market Volume K Unit Forecast, by Country 2020 & 2033
- Table 25: Germany Dental CAD Market Revenue (billion) Forecast, by Application 2020 & 2033
- Table 26: Germany Dental CAD Market Volume (K Unit) Forecast, by Application 2020 & 2033
- Table 27: United Kingdom Dental CAD Market Revenue (billion) Forecast, by Application 2020 & 2033
- Table 28: United Kingdom Dental CAD Market Volume (K Unit) Forecast, by Application 2020 & 2033
- Table 29: France Dental CAD Market Revenue (billion) Forecast, by Application 2020 & 2033
- Table 30: France Dental CAD Market Volume (K Unit) Forecast, by Application 2020 & 2033
- Table 31: Italy Dental CAD Market Revenue (billion) Forecast, by Application 2020 & 2033
- Table 32: Italy Dental CAD Market Volume (K Unit) Forecast, by Application 2020 & 2033
- Table 33: Spain Dental CAD Market Revenue (billion) Forecast, by Application 2020 & 2033
- Table 34: Spain Dental CAD Market Volume (K Unit) Forecast, by Application 2020 & 2033
- Table 35: Rest of Europe Dental CAD Market Revenue (billion) Forecast, by Application 2020 & 2033
- Table 36: Rest of Europe Dental CAD Market Volume (K Unit) Forecast, by Application 2020 & 2033
- Table 37: Global Dental CAD Market Revenue billion Forecast, by Component 2020 & 2033
- Table 38: Global Dental CAD Market Volume K Unit Forecast, by Component 2020 & 2033
- Table 39: Global Dental CAD Market Revenue billion Forecast, by Application 2020 & 2033
- Table 40: Global Dental CAD Market Volume K Unit Forecast, by Application 2020 & 2033
- Table 41: Global Dental CAD Market Revenue billion Forecast, by Country 2020 & 2033
- Table 42: Global Dental CAD Market Volume K Unit Forecast, by Country 2020 & 2033
- Table 43: China Dental CAD Market Revenue (billion) Forecast, by Application 2020 & 2033
- Table 44: China Dental CAD Market Volume (K Unit) Forecast, by Application 2020 & 2033
- Table 45: Japan Dental CAD Market Revenue (billion) Forecast, by Application 2020 & 2033
- Table 46: Japan Dental CAD Market Volume (K Unit) Forecast, by Application 2020 & 2033
- Table 47: India Dental CAD Market Revenue (billion) Forecast, by Application 2020 & 2033
- Table 48: India Dental CAD Market Volume (K Unit) Forecast, by Application 2020 & 2033
- Table 49: Australia Dental CAD Market Revenue (billion) Forecast, by Application 2020 & 2033
- Table 50: Australia Dental CAD Market Volume (K Unit) Forecast, by Application 2020 & 2033
- Table 51: South Korea Dental CAD Market Revenue (billion) Forecast, by Application 2020 & 2033
- Table 52: South Korea Dental CAD Market Volume (K Unit) Forecast, by Application 2020 & 2033
- Table 53: Rest of Asia Pacific Dental CAD Market Revenue (billion) Forecast, by Application 2020 & 2033
- Table 54: Rest of Asia Pacific Dental CAD Market Volume (K Unit) Forecast, by Application 2020 & 2033
- Table 55: Global Dental CAD Market Revenue billion Forecast, by Component 2020 & 2033
- Table 56: Global Dental CAD Market Volume K Unit Forecast, by Component 2020 & 2033
- Table 57: Global Dental CAD Market Revenue billion Forecast, by Application 2020 & 2033
- Table 58: Global Dental CAD Market Volume K Unit Forecast, by Application 2020 & 2033
- Table 59: Global Dental CAD Market Revenue billion Forecast, by Country 2020 & 2033
- Table 60: Global Dental CAD Market Volume K Unit Forecast, by Country 2020 & 2033
- Table 61: GCC Dental CAD Market Revenue (billion) Forecast, by Application 2020 & 2033
- Table 62: GCC Dental CAD Market Volume (K Unit) Forecast, by Application 2020 & 2033
- Table 63: South Africa Dental CAD Market Revenue (billion) Forecast, by Application 2020 & 2033
- Table 64: South Africa Dental CAD Market Volume (K Unit) Forecast, by Application 2020 & 2033
- Table 65: Rest of Middle East and Africa Dental CAD Market Revenue (billion) Forecast, by Application 2020 & 2033
- Table 66: Rest of Middle East and Africa Dental CAD Market Volume (K Unit) Forecast, by Application 2020 & 2033
- Table 67: Global Dental CAD Market Revenue billion Forecast, by Component 2020 & 2033
- Table 68: Global Dental CAD Market Volume K Unit Forecast, by Component 2020 & 2033
- Table 69: Global Dental CAD Market Revenue billion Forecast, by Application 2020 & 2033
- Table 70: Global Dental CAD Market Volume K Unit Forecast, by Application 2020 & 2033
- Table 71: Global Dental CAD Market Revenue billion Forecast, by Country 2020 & 2033
- Table 72: Global Dental CAD Market Volume K Unit Forecast, by Country 2020 & 2033
- Table 73: Brazil Dental CAD Market Revenue (billion) Forecast, by Application 2020 & 2033
- Table 74: Brazil Dental CAD Market Volume (K Unit) Forecast, by Application 2020 & 2033
- Table 75: Argentina Dental CAD Market Revenue (billion) Forecast, by Application 2020 & 2033
- Table 76: Argentina Dental CAD Market Volume (K Unit) Forecast, by Application 2020 & 2033
- Table 77: Rest of South America Dental CAD Market Revenue (billion) Forecast, by Application 2020 & 2033
- Table 78: Rest of South America Dental CAD Market Volume (K Unit) Forecast, by Application 2020 & 2033
Frequently Asked Questions
1. What is the projected Compound Annual Growth Rate (CAGR) of the Dental CAD Market?
The projected CAGR is approximately 8.5%.
2. Which companies are prominent players in the Dental CAD Market?
Key companies in the market include PLANMECA OY, Roland DGA Corporation, Dentsply Sirona, Zirkonzahn, Hexagon AB, Kelkar Dynamics LLP, Amann Girrbach AG, Carestream Dental LLC, 3Shape, Align Technology Inc, Envista Holdings Corporation, Datron AG, Institut Straumann AG, ZimVie Inc.
3. What are the main segments of the Dental CAD Market?
The market segments include Component, Application.
4. Can you provide details about the market size?
The market size is estimated to be USD 2.94 billion as of 2022.
5. What are some drivers contributing to market growth?
Increasing Burden of Oral Diseases And Ageing Population; Technological Advancements in Dental Imaging Methodologies.
6. What are the notable trends driving market growth?
The Scanners Segment is Expected to Hold Significant Share in Dental CAD Market Over the Forecast Period.
7. Are there any restraints impacting market growth?
Excessive Costs Involved in Private Health Insurance.
8. Can you provide examples of recent developments in the market?
In September 2022, Planmeca introduced a completely new software module for Planmeca Romexis, which makes working with digital impressions easier and faster. The Planmeca Romexis CAD/CAM module streamlines the scan-and-send workflow for capturing, analyzing, and exporting digital impressions and offers new intraoral scanner users a smooth CAD/CAM dentistry experience.
9. What pricing options are available for accessing the report?
Pricing options include single-user, multi-user, and enterprise licenses priced at USD 4750, USD 5250, and USD 8750 respectively.
10. Is the market size provided in terms of value or volume?
The market size is provided in terms of value, measured in billion and volume, measured in K Unit.
11. Are there any specific market keywords associated with the report?
Yes, the market keyword associated with the report is "Dental CAD Market," which aids in identifying and referencing the specific market segment covered.
12. How do I determine which pricing option suits my needs best?
The pricing options vary based on user requirements and access needs. Individual users may opt for single-user licenses, while businesses requiring broader access may choose multi-user or enterprise licenses for cost-effective access to the report.
13. Are there any additional resources or data provided in the Dental CAD Market report?
While the report offers comprehensive insights, it's advisable to review the specific contents or supplementary materials provided to ascertain if additional resources or data are available.
14. How can I stay updated on further developments or reports in the Dental CAD Market?
To stay informed about further developments, trends, and reports in the Dental CAD Market, consider subscribing to industry newsletters, following relevant companies and organizations, or regularly checking reputable industry news sources and publications.
Methodology
Step 1 - Identification of Relevant Samples Size from Population Database


Step 2 - Approaches for Defining Global Market Size (Value, Volume* & Price*)

Note*: In applicable scenarios
Step 3 - Data Sources
Primary Research
- Web Analytics
- Survey Reports
- Research Institute
- Latest Research Reports
- Opinion Leaders
Secondary Research
- Annual Reports
- White Paper
- Latest Press Release
- Industry Association
- Paid Database
- Investor Presentations

Step 4 - Data Triangulation
Involves using different sources of information in order to increase the validity of a study
These sources are likely to be stakeholders in a program - participants, other researchers, program staff, other community members, and so on.
Then we put all data in single framework & apply various statistical tools to find out the dynamic on the market.
During the analysis stage, feedback from the stakeholder groups would be compared to determine areas of agreement as well as areas of divergence