

Key Insights
The global Single-Cell Analysis market is projected for significant expansion, with an estimated market size of $3.81 billion by 2025. The market is expected to witness a robust Compound Annual Growth Rate (CAGR) of 14.7%, growing from a base year of 2025 through 2033. This growth is propelled by increasing demand for precise diagnostics, the advancement of personalized medicine, and enhanced research capabilities across academic, biotechnology, and pharmaceutical sectors. Key growth factors include the rising incidence of chronic diseases, the imperative for early disease detection and monitoring, and continuous innovation in single-cell technologies such as advanced flow cytometry, single-cell sequencing, and microfluidics. These technologies offer unprecedented insights into cellular heterogeneity, crucial for understanding disease mechanisms and developing targeted therapies. The market is further stimulated by substantial investments in life sciences R&D and a supportive regulatory environment for advanced analytical tools.
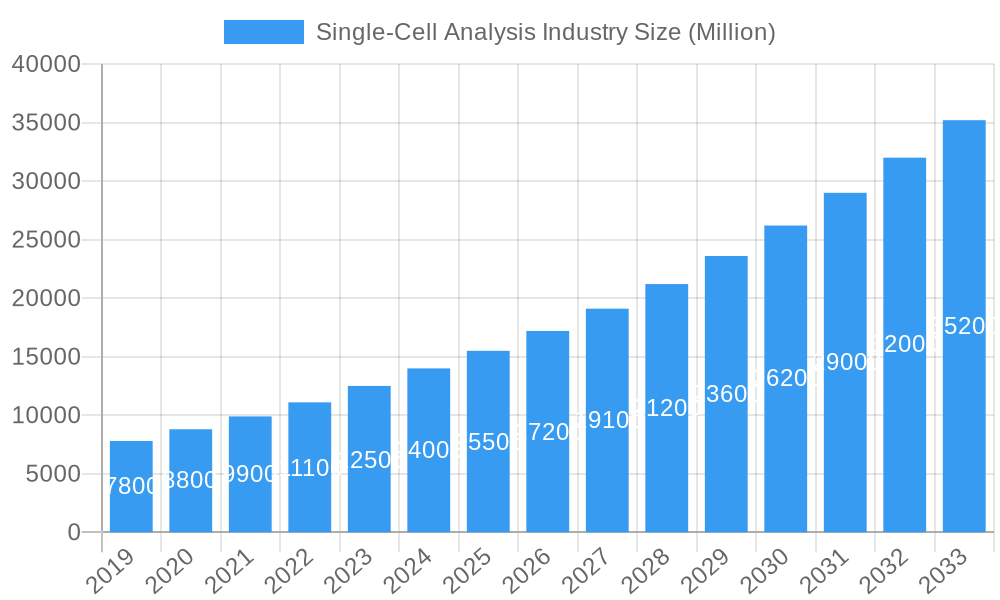
Single-Cell Analysis Industry Market Size (In Billion)
Single-cell analysis plays a critical role in drug discovery and development, aiding in the identification of novel drug targets, assessment of drug efficacy, and prediction of patient responses. Biotechnology and pharmaceutical firms are increasingly adopting these techniques to accelerate their pipelines. Hospital and diagnostic laboratories are also expanding usage for improved patient stratification and companion diagnostics. Challenges, including the high cost of instrumentation and the need for specialized data analysis expertise, are being addressed by ongoing technological innovations, more accessible platforms, and enhanced training initiatives. North America and Europe are expected to maintain market leadership due to strong research infrastructure and early adoption, while the Asia Pacific region is poised for the fastest growth, driven by increasing healthcare expenditure and a focus on scientific innovation.
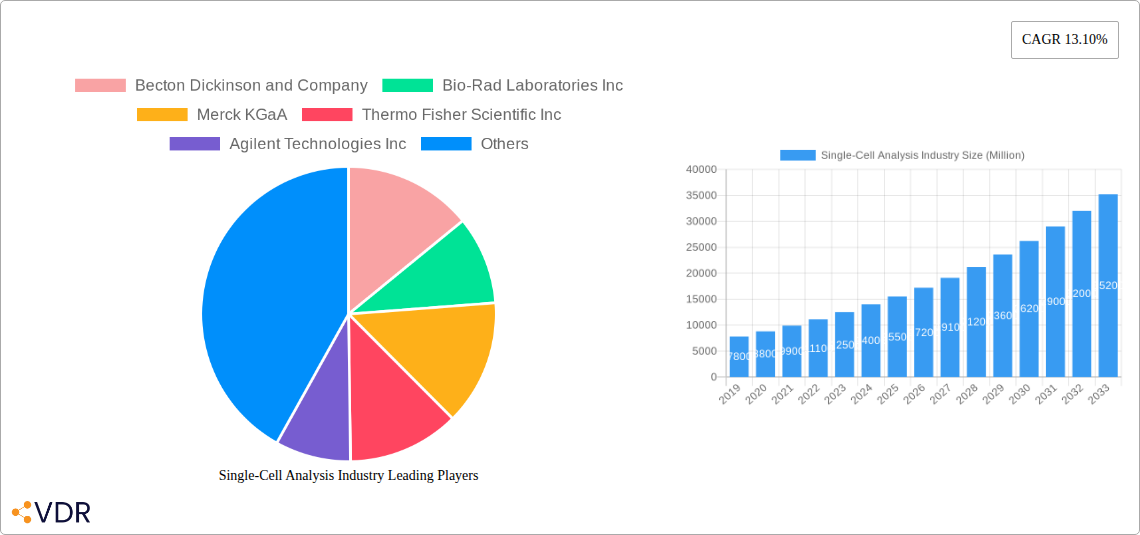
Single-Cell Analysis Industry Company Market Share
This report provides an in-depth analysis of the single-cell analysis market, detailing its evolution, growth drivers, and future outlook. It covers key areas such as single-cell sequencing, single-cell proteomics, single-cell transcriptomics, and single-cell multi-omics. The analysis encompasses the parent market (life sciences research tools) and its child markets (specific single-cell technologies) for the study period of 2019–2033, with a detailed examination of the base year 2025 and the forecast period 2025–2033, building upon historical data from 2019–2024. Market segmentation includes end-users such as Academic and Research Laboratories, Biotechnology and Pharmaceutical Companies, and Hospital and Diagnostic Laboratories, and highlights significant industry developments, including advancements from Mission Bio and 10x Genomics.
Single-Cell Analysis Industry Market Dynamics & Structure
The single-cell analysis industry is characterized by a moderately concentrated market structure, driven by significant technological innovation, particularly in single-cell sequencing and multi-omics platforms. Key players like Thermo Fisher Scientific Inc., Illumina Inc., and Becton Dickinson and Company dominate with their extensive product portfolios and research collaborations. Regulatory frameworks, while generally supportive of life sciences research, can present hurdles related to data privacy and standardization for clinical applications. Competitive product substitutes are emerging, but the unique insights offered by single-cell resolution maintain a strong market position. The primary end-user demographics are robust, with increasing investment from Biotechnology and Pharmaceutical Companies for drug discovery and development, alongside continued strong demand from Academic and Research Laboratories. Hospital and Diagnostic Laboratories are also growing as the translation of single-cell insights into clinical diagnostics progresses. Merger and acquisition (M&A) trends are active, with larger entities acquiring innovative startups to expand their technological capabilities and market reach.
- Market Concentration: Moderately concentrated, with a few major players holding significant market share.
- Technological Innovation: Driven by advancements in single-cell RNA sequencing, single-cell ATAC sequencing, and spatial transcriptomics.
- Regulatory Frameworks: Evolving to accommodate novel diagnostic and therapeutic applications.
- End-User Demographics: Significant growth anticipated from pharmaceutical companies for personalized medicine research.
- M&A Trends: Ongoing consolidation and strategic partnerships to enhance product offerings.
Single-Cell Analysis Industry Growth Trends & Insights
The single-cell analysis market is poised for substantial expansion, driven by an increasing demand for high-resolution biological insights. The market size is projected to grow at an impressive Compound Annual Growth Rate (CAGR) of approximately 15.8% during the forecast period of 2025–2033. This growth is fueled by the transformative potential of single-cell genomics and single-cell proteomics in unraveling complex biological processes at an unprecedented level of detail. Adoption rates of single-cell RNA sequencing (scRNA-seq) and related technologies are accelerating across research institutions and biopharmaceutical companies, enabling breakthroughs in cancer research, immunology, neuroscience, and developmental biology. Technological disruptions, such as the development of more affordable and user-friendly single-cell platforms and advanced bioinformatics tools, are democratizing access and broadening the application scope. Consumer behavior shifts are evident, with a growing emphasis on precision medicine and personalized therapeutic approaches, directly benefiting the demand for single-cell analysis solutions. The market penetration of these advanced technologies is expected to rise significantly as their clinical utility becomes more established.
- Market Size Evolution: Projected to reach over $25,000 million by 2033.
- Adoption Rates: Rapidly increasing across academic, pharmaceutical, and diagnostic sectors.
- Technological Disruptions: Miniaturization, automation, and improved data analysis pipelines are key.
- Consumer Behavior Shifts: Growing demand for personalized diagnostics and targeted therapies.
- Market Penetration: Expanding from specialized research into broader clinical applications.
Dominant Regions, Countries, or Segments in Single-Cell Analysis Industry
North America, particularly the United States, is currently the dominant region in the single-cell analysis industry. This leadership is underpinned by a robust ecosystem of leading academic and research institutions, significant investment from a thriving biotechnology and pharmaceutical sector, and favorable government funding for life sciences research. The presence of major industry players like Thermo Fisher Scientific Inc., Illumina Inc., and Becton Dickinson and Company, coupled with a strong venture capital presence, further solidifies North America's position. In terms of end-users, Biotechnology and Pharmaceutical Companies represent a critical growth segment. These companies are leveraging single-cell analysis for target identification, drug discovery, biomarker development, and preclinical testing, particularly in areas like oncology, immunology, and infectious diseases. The ability to dissect cellular heterogeneity provides invaluable insights for developing more effective and personalized therapeutics. The market share within this segment is substantial due to the high R&D expenditure and the increasing pressure to bring novel drugs to market.
- Dominant Region: North America, driven by the USA, leads in market share and innovation.
- Key Country Drivers (USA): Strong R&D infrastructure, substantial venture capital funding, and supportive government policies.
- Dominant End-User Segment: Biotechnology and Pharmaceutical Companies are major drivers of growth due to extensive R&D investments.
- Market Share within Segment: Pharmaceutical companies account for over 40% of the total market spend.
- Growth Potential: Emerging markets in Asia-Pacific are showing rapid growth due to increasing healthcare investment and a growing research base.
Single-Cell Analysis Industry Product Landscape
The single-cell analysis product landscape is rapidly advancing, offering a diverse range of innovative solutions. Key products include single-cell sequencing kits (e.g., for RNA, DNA, and ATAC-seq), single-cell protein analysis platforms, and spatial omics technologies. These platforms enable researchers to analyze gene expression, protein levels, epigenetic modifications, and their spatial organization within individual cells. Unique selling propositions lie in their ability to resolve cellular heterogeneity, identify rare cell populations, and uncover novel biomarkers. Technological advancements focus on increasing throughput, improving cell viability during sample preparation, and integrating multi-modal data analysis for comprehensive biological insights.
Key Drivers, Barriers & Challenges in Single-Cell Analysis Industry
The single-cell analysis industry is propelled by several key drivers, including the relentless pursuit of precision medicine, the need to understand complex disease mechanisms at a cellular level, and advancements in genomic and proteomic technologies. The increasing adoption in oncology, immunology, and neuroscience research further fuels growth.
- Technological Drivers: Miniaturization, automation, AI-driven data analysis, and multi-omics integration.
- Economic Drivers: Growing R&D budgets in biotech and pharma, and government funding for life sciences.
- Policy-Driven Factors: Initiatives promoting personalized healthcare and precision diagnostics.
However, the industry faces significant barriers and challenges. High instrument costs, complex data analysis requirements, and the need for specialized expertise can hinder widespread adoption. Supply chain disruptions for reagents and consumables can also impact market stability.
- Supply Chain Issues: Potential shortages of critical reagents and specialized components.
- Regulatory Hurdles: Navigating approval processes for clinical diagnostics and therapeutics.
- Competitive Pressures: Intense competition among established players and emerging startups.
- Data Analysis Complexity: Need for sophisticated bioinformatics expertise and infrastructure.
Emerging Opportunities in Single-Cell Analysis Industry
Emerging opportunities in the single-cell analysis industry are abundant, driven by the expansion into new therapeutic areas and the development of novel applications. The growing interest in single-cell analysis for infectious disease research, vaccine development, and the study of the human microbiome presents significant untapped markets. Furthermore, the integration of single-cell data with artificial intelligence and machine learning holds immense potential for predictive diagnostics and personalized treatment strategies. The development of point-of-care single-cell analysis solutions could also revolutionize diagnostics and therapeutic monitoring.
Growth Accelerators in the Single-Cell Analysis Industry Industry
Several growth accelerators are shaping the long-term trajectory of the single-cell analysis industry. Technological breakthroughs in high-throughput single-cell sorting, advanced microfluidics, and novel sequencing chemistries are continuously improving data quality and reducing costs. Strategic partnerships between technology providers, academic institutions, and pharmaceutical companies are crucial for translating research findings into clinical applications. Market expansion into emerging economies, driven by increasing healthcare spending and research infrastructure development, will also contribute significantly to sustained growth.
Key Players Shaping the Single-Cell Analysis Industry Market
- Becton Dickinson and Company
- Bio-Rad Laboratories Inc.
- Merck KGaA
- Thermo Fisher Scientific Inc.
- Agilent Technologies Inc.
- Promega Corporation
- Beckman Coulter Inc (Danaher Corporation)
- Qiagen NV
- Illumina Inc.
- GE Healthcare (GE Company)
- Fluidigm Corporation
Notable Milestones in Single-Cell Analysis Industry Sector
- March 2022: Mission Bio, Inc., launched the Tapestri Solution for Solid Tumor Research, offering an end-to-end single-cell DNA sequencing workflow, including nuclei isolation, research panels for breast cancer and glioblastoma, and improved CNV bioinformatic analysis.
- April 2022: 10x Genomics announced the commercial availability of two new products designed to enhance sample preparation workflows and promote wider adoption of its Chromium platform for single-cell analysis.
In-Depth Single-Cell Analysis Industry Market Outlook
The future outlook for the single-cell analysis industry is exceptionally bright, characterized by continuous innovation and expanding applications. Growth accelerators, including the development of single-cell multi-omics platforms, the integration of AI for data interpretation, and the expansion of single-cell analysis in clinical diagnostics, are poised to drive substantial market growth. Strategic partnerships will continue to foster collaboration and accelerate the translation of research into tangible therapeutic and diagnostic solutions. The increasing focus on personalized medicine globally ensures a sustained demand for the granular cellular insights that single-cell analysis provides, positioning the industry for robust and sustained expansion over the coming decade.
Single-Cell Analysis Industry Segmentation
-
1. End User
- 1.1. Academic and Research Laboratories
- 1.2. Biotechnology and Pharmaceutical Companies
- 1.3. Hospital and Diagnostic Laboratories
Single-Cell Analysis Industry Segmentation By Geography
-
1. North America
- 1.1. United States
- 1.2. Canada
- 1.3. Mexico
-
2. Europe
- 2.1. Germany
- 2.2. United Kingdom
- 2.3. France
- 2.4. Italy
- 2.5. Spain
- 2.6. Rest of Europe
-
3. Asia Pacific
- 3.1. China
- 3.2. Japan
- 3.3. India
- 3.4. Australia
- 3.5. South Korea
- 3.6. Rest of Asia Pacific
-
4. Middle East and Africa
- 4.1. GCC
- 4.2. South Africa
- 4.3. Rest of Middle East and Africa
-
5. South America
- 5.1. Brazil
- 5.2. Argentina
- 5.3. Rest of South America
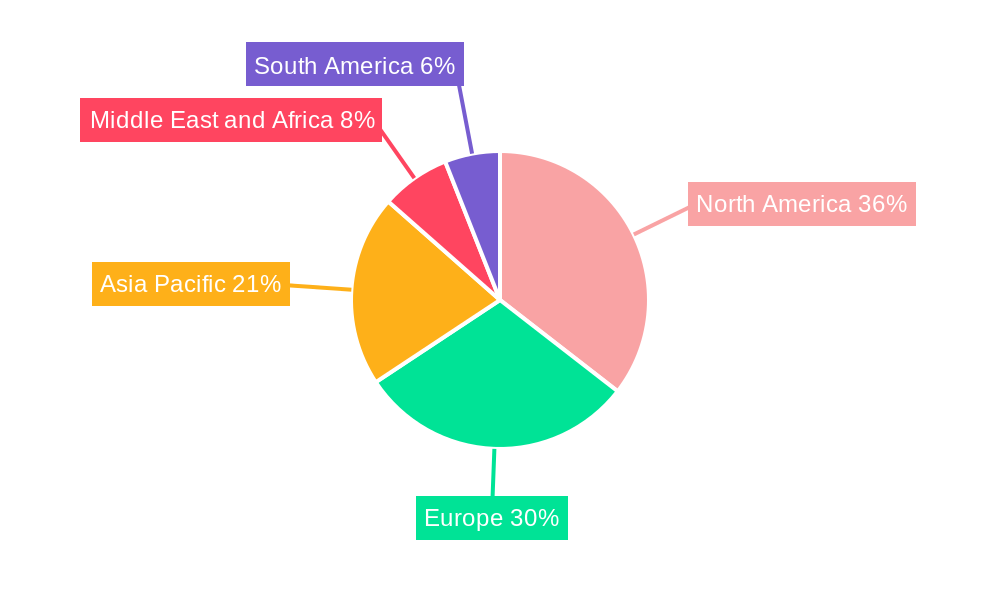
Single-Cell Analysis Industry Regional Market Share
Geographic Coverage of Single-Cell Analysis Industry
Single-Cell Analysis Industry REPORT HIGHLIGHTS
| Aspects | Details |
|---|---|
| Study Period | 2020-2034 |
| Base Year | 2025 |
| Estimated Year | 2026 |
| Forecast Period | 2026-2034 |
| Historical Period | 2020-2025 |
| Growth Rate | CAGR of 14.7% from 2020-2034 |
| Segmentation |
|
Table of Contents
- 1. Introduction
- 1.1. Research Scope
- 1.2. Market Segmentation
- 1.3. Research Objective
- 1.4. Definitions and Assumptions
- 2. Executive Summary
- 2.1. Market Snapshot
- 3. Market Dynamics
- 3.1. Market Drivers
- 3.2. Market Restrains
- 3.3. Market Trends
- 3.4. Market Opportunities
- 4. Market Factor Analysis
- 4.1. Porters Five Forces
- 4.1.1. Bargaining Power of Suppliers
- 4.1.2. Bargaining Power of Buyers
- 4.1.3. Threat of New Entrants
- 4.1.4. Threat of Substitutes
- 4.1.5. Competitive Rivalry
- 4.2. PESTEL analysis
- 4.3. BCG Analysis
- 4.3.1. Stars (High Growth, High Market Share)
- 4.3.2. Cash Cows (Low Growth, High Market Share)
- 4.3.3. Question Mark (High Growth, Low Market Share)
- 4.3.4. Dogs (Low Growth, Low Market Share)
- 4.4. Ansoff Matrix Analysis
- 4.5. Supply Chain Analysis
- 4.6. Regulatory Landscape
- 4.7. Current Market Potential and Opportunity Assessment (TAM–SAM–SOM Framework)
- 4.8. VDR Analyst Note
- 4.1. Porters Five Forces
- 5. Market Analysis, Insights and Forecast 2021-2033
- 5.1. Market Analysis, Insights and Forecast - by End User
- 5.1.1. Academic and Research Laboratories
- 5.1.2. Biotechnology and Pharmaceutical Companies
- 5.1.3. Hospital and Diagnostic Laboratories
- 5.2. Market Analysis, Insights and Forecast - by Region
- 5.2.1. North America
- 5.2.2. Europe
- 5.2.3. Asia Pacific
- 5.2.4. Middle East and Africa
- 5.2.5. South America
- 5.1. Market Analysis, Insights and Forecast - by End User
- 6. Global Single-Cell Analysis Industry Analysis, Insights and Forecast, 2021-2033
- 6.1. Market Analysis, Insights and Forecast - by End User
- 6.1.1. Academic and Research Laboratories
- 6.1.2. Biotechnology and Pharmaceutical Companies
- 6.1.3. Hospital and Diagnostic Laboratories
- 6.1. Market Analysis, Insights and Forecast - by End User
- 7. North America Single-Cell Analysis Industry Analysis, Insights and Forecast, 2021-2033
- 7.1. Market Analysis, Insights and Forecast - by End User
- 7.1.1. Academic and Research Laboratories
- 7.1.2. Biotechnology and Pharmaceutical Companies
- 7.1.3. Hospital and Diagnostic Laboratories
- 7.1. Market Analysis, Insights and Forecast - by End User
- 8. Europe Single-Cell Analysis Industry Analysis, Insights and Forecast, 2021-2033
- 8.1. Market Analysis, Insights and Forecast - by End User
- 8.1.1. Academic and Research Laboratories
- 8.1.2. Biotechnology and Pharmaceutical Companies
- 8.1.3. Hospital and Diagnostic Laboratories
- 8.1. Market Analysis, Insights and Forecast - by End User
- 9. Asia Pacific Single-Cell Analysis Industry Analysis, Insights and Forecast, 2021-2033
- 9.1. Market Analysis, Insights and Forecast - by End User
- 9.1.1. Academic and Research Laboratories
- 9.1.2. Biotechnology and Pharmaceutical Companies
- 9.1.3. Hospital and Diagnostic Laboratories
- 9.1. Market Analysis, Insights and Forecast - by End User
- 10. Middle East and Africa Single-Cell Analysis Industry Analysis, Insights and Forecast, 2021-2033
- 10.1. Market Analysis, Insights and Forecast - by End User
- 10.1.1. Academic and Research Laboratories
- 10.1.2. Biotechnology and Pharmaceutical Companies
- 10.1.3. Hospital and Diagnostic Laboratories
- 10.1. Market Analysis, Insights and Forecast - by End User
- 11. South America Single-Cell Analysis Industry Analysis, Insights and Forecast, 2021-2033
- 11.1. Market Analysis, Insights and Forecast - by End User
- 11.1.1. Academic and Research Laboratories
- 11.1.2. Biotechnology and Pharmaceutical Companies
- 11.1.3. Hospital and Diagnostic Laboratories
- 11.1. Market Analysis, Insights and Forecast - by End User
- 12. Competitive Analysis
- 12.1. Company Profiles
- 12.1.1 Becton Dickinson and Company
- 12.1.1.1. Company Overview
- 12.1.1.2. Products
- 12.1.1.3. Company Financials
- 12.1.1.4. SWOT Analysis
- 12.1.2 Bio-Rad Laboratories Inc
- 12.1.2.1. Company Overview
- 12.1.2.2. Products
- 12.1.2.3. Company Financials
- 12.1.2.4. SWOT Analysis
- 12.1.3 Merck KGaA
- 12.1.3.1. Company Overview
- 12.1.3.2. Products
- 12.1.3.3. Company Financials
- 12.1.3.4. SWOT Analysis
- 12.1.4 Thermo Fisher Scientific Inc
- 12.1.4.1. Company Overview
- 12.1.4.2. Products
- 12.1.4.3. Company Financials
- 12.1.4.4. SWOT Analysis
- 12.1.5 Agilent Technologies Inc
- 12.1.5.1. Company Overview
- 12.1.5.2. Products
- 12.1.5.3. Company Financials
- 12.1.5.4. SWOT Analysis
- 12.1.6 Promega Corporation
- 12.1.6.1. Company Overview
- 12.1.6.2. Products
- 12.1.6.3. Company Financials
- 12.1.6.4. SWOT Analysis
- 12.1.7 Beckman Coulter Inc (Danaher Corporation)
- 12.1.7.1. Company Overview
- 12.1.7.2. Products
- 12.1.7.3. Company Financials
- 12.1.7.4. SWOT Analysis
- 12.1.8 Qiagen NV
- 12.1.8.1. Company Overview
- 12.1.8.2. Products
- 12.1.8.3. Company Financials
- 12.1.8.4. SWOT Analysis
- 12.1.9 Illumina Inc
- 12.1.9.1. Company Overview
- 12.1.9.2. Products
- 12.1.9.3. Company Financials
- 12.1.9.4. SWOT Analysis
- 12.1.10 GE Healthcare (GE Company)
- 12.1.10.1. Company Overview
- 12.1.10.2. Products
- 12.1.10.3. Company Financials
- 12.1.10.4. SWOT Analysis
- 12.1.11 Fluidigm Corporation
- 12.1.11.1. Company Overview
- 12.1.11.2. Products
- 12.1.11.3. Company Financials
- 12.1.11.4. SWOT Analysis
- 12.1.1 Becton Dickinson and Company
- 12.2. Market Entropy
- 12.2.1 Company's Key Areas Served
- 12.2.2 Recent Developments
- 12.3. Company Market Share Analysis 2025
- 12.3.1 Top 5 Companies Market Share Analysis
- 12.3.2 Top 3 Companies Market Share Analysis
- 12.4. List of Potential Customers
- 13. Research Methodology
List of Figures
- Figure 1: Global Single-Cell Analysis Industry Revenue Breakdown (billion, %) by Region 2025 & 2033
- Figure 2: Global Single-Cell Analysis Industry Volume Breakdown (K Unit, %) by Region 2025 & 2033
- Figure 3: North America Single-Cell Analysis Industry Revenue (billion), by End User 2025 & 2033
- Figure 4: North America Single-Cell Analysis Industry Volume (K Unit), by End User 2025 & 2033
- Figure 5: North America Single-Cell Analysis Industry Revenue Share (%), by End User 2025 & 2033
- Figure 6: North America Single-Cell Analysis Industry Volume Share (%), by End User 2025 & 2033
- Figure 7: North America Single-Cell Analysis Industry Revenue (billion), by Country 2025 & 2033
- Figure 8: North America Single-Cell Analysis Industry Volume (K Unit), by Country 2025 & 2033
- Figure 9: North America Single-Cell Analysis Industry Revenue Share (%), by Country 2025 & 2033
- Figure 10: North America Single-Cell Analysis Industry Volume Share (%), by Country 2025 & 2033
- Figure 11: Europe Single-Cell Analysis Industry Revenue (billion), by End User 2025 & 2033
- Figure 12: Europe Single-Cell Analysis Industry Volume (K Unit), by End User 2025 & 2033
- Figure 13: Europe Single-Cell Analysis Industry Revenue Share (%), by End User 2025 & 2033
- Figure 14: Europe Single-Cell Analysis Industry Volume Share (%), by End User 2025 & 2033
- Figure 15: Europe Single-Cell Analysis Industry Revenue (billion), by Country 2025 & 2033
- Figure 16: Europe Single-Cell Analysis Industry Volume (K Unit), by Country 2025 & 2033
- Figure 17: Europe Single-Cell Analysis Industry Revenue Share (%), by Country 2025 & 2033
- Figure 18: Europe Single-Cell Analysis Industry Volume Share (%), by Country 2025 & 2033
- Figure 19: Asia Pacific Single-Cell Analysis Industry Revenue (billion), by End User 2025 & 2033
- Figure 20: Asia Pacific Single-Cell Analysis Industry Volume (K Unit), by End User 2025 & 2033
- Figure 21: Asia Pacific Single-Cell Analysis Industry Revenue Share (%), by End User 2025 & 2033
- Figure 22: Asia Pacific Single-Cell Analysis Industry Volume Share (%), by End User 2025 & 2033
- Figure 23: Asia Pacific Single-Cell Analysis Industry Revenue (billion), by Country 2025 & 2033
- Figure 24: Asia Pacific Single-Cell Analysis Industry Volume (K Unit), by Country 2025 & 2033
- Figure 25: Asia Pacific Single-Cell Analysis Industry Revenue Share (%), by Country 2025 & 2033
- Figure 26: Asia Pacific Single-Cell Analysis Industry Volume Share (%), by Country 2025 & 2033
- Figure 27: Middle East and Africa Single-Cell Analysis Industry Revenue (billion), by End User 2025 & 2033
- Figure 28: Middle East and Africa Single-Cell Analysis Industry Volume (K Unit), by End User 2025 & 2033
- Figure 29: Middle East and Africa Single-Cell Analysis Industry Revenue Share (%), by End User 2025 & 2033
- Figure 30: Middle East and Africa Single-Cell Analysis Industry Volume Share (%), by End User 2025 & 2033
- Figure 31: Middle East and Africa Single-Cell Analysis Industry Revenue (billion), by Country 2025 & 2033
- Figure 32: Middle East and Africa Single-Cell Analysis Industry Volume (K Unit), by Country 2025 & 2033
- Figure 33: Middle East and Africa Single-Cell Analysis Industry Revenue Share (%), by Country 2025 & 2033
- Figure 34: Middle East and Africa Single-Cell Analysis Industry Volume Share (%), by Country 2025 & 2033
- Figure 35: South America Single-Cell Analysis Industry Revenue (billion), by End User 2025 & 2033
- Figure 36: South America Single-Cell Analysis Industry Volume (K Unit), by End User 2025 & 2033
- Figure 37: South America Single-Cell Analysis Industry Revenue Share (%), by End User 2025 & 2033
- Figure 38: South America Single-Cell Analysis Industry Volume Share (%), by End User 2025 & 2033
- Figure 39: South America Single-Cell Analysis Industry Revenue (billion), by Country 2025 & 2033
- Figure 40: South America Single-Cell Analysis Industry Volume (K Unit), by Country 2025 & 2033
- Figure 41: South America Single-Cell Analysis Industry Revenue Share (%), by Country 2025 & 2033
- Figure 42: South America Single-Cell Analysis Industry Volume Share (%), by Country 2025 & 2033
List of Tables
- Table 1: Global Single-Cell Analysis Industry Revenue billion Forecast, by End User 2020 & 2033
- Table 2: Global Single-Cell Analysis Industry Volume K Unit Forecast, by End User 2020 & 2033
- Table 3: Global Single-Cell Analysis Industry Revenue billion Forecast, by Region 2020 & 2033
- Table 4: Global Single-Cell Analysis Industry Volume K Unit Forecast, by Region 2020 & 2033
- Table 5: Global Single-Cell Analysis Industry Revenue billion Forecast, by End User 2020 & 2033
- Table 6: Global Single-Cell Analysis Industry Volume K Unit Forecast, by End User 2020 & 2033
- Table 7: Global Single-Cell Analysis Industry Revenue billion Forecast, by Country 2020 & 2033
- Table 8: Global Single-Cell Analysis Industry Volume K Unit Forecast, by Country 2020 & 2033
- Table 9: United States Single-Cell Analysis Industry Revenue (billion) Forecast, by Application 2020 & 2033
- Table 10: United States Single-Cell Analysis Industry Volume (K Unit) Forecast, by Application 2020 & 2033
- Table 11: Canada Single-Cell Analysis Industry Revenue (billion) Forecast, by Application 2020 & 2033
- Table 12: Canada Single-Cell Analysis Industry Volume (K Unit) Forecast, by Application 2020 & 2033
- Table 13: Mexico Single-Cell Analysis Industry Revenue (billion) Forecast, by Application 2020 & 2033
- Table 14: Mexico Single-Cell Analysis Industry Volume (K Unit) Forecast, by Application 2020 & 2033
- Table 15: Global Single-Cell Analysis Industry Revenue billion Forecast, by End User 2020 & 2033
- Table 16: Global Single-Cell Analysis Industry Volume K Unit Forecast, by End User 2020 & 2033
- Table 17: Global Single-Cell Analysis Industry Revenue billion Forecast, by Country 2020 & 2033
- Table 18: Global Single-Cell Analysis Industry Volume K Unit Forecast, by Country 2020 & 2033
- Table 19: Germany Single-Cell Analysis Industry Revenue (billion) Forecast, by Application 2020 & 2033
- Table 20: Germany Single-Cell Analysis Industry Volume (K Unit) Forecast, by Application 2020 & 2033
- Table 21: United Kingdom Single-Cell Analysis Industry Revenue (billion) Forecast, by Application 2020 & 2033
- Table 22: United Kingdom Single-Cell Analysis Industry Volume (K Unit) Forecast, by Application 2020 & 2033
- Table 23: France Single-Cell Analysis Industry Revenue (billion) Forecast, by Application 2020 & 2033
- Table 24: France Single-Cell Analysis Industry Volume (K Unit) Forecast, by Application 2020 & 2033
- Table 25: Italy Single-Cell Analysis Industry Revenue (billion) Forecast, by Application 2020 & 2033
- Table 26: Italy Single-Cell Analysis Industry Volume (K Unit) Forecast, by Application 2020 & 2033
- Table 27: Spain Single-Cell Analysis Industry Revenue (billion) Forecast, by Application 2020 & 2033
- Table 28: Spain Single-Cell Analysis Industry Volume (K Unit) Forecast, by Application 2020 & 2033
- Table 29: Rest of Europe Single-Cell Analysis Industry Revenue (billion) Forecast, by Application 2020 & 2033
- Table 30: Rest of Europe Single-Cell Analysis Industry Volume (K Unit) Forecast, by Application 2020 & 2033
- Table 31: Global Single-Cell Analysis Industry Revenue billion Forecast, by End User 2020 & 2033
- Table 32: Global Single-Cell Analysis Industry Volume K Unit Forecast, by End User 2020 & 2033
- Table 33: Global Single-Cell Analysis Industry Revenue billion Forecast, by Country 2020 & 2033
- Table 34: Global Single-Cell Analysis Industry Volume K Unit Forecast, by Country 2020 & 2033
- Table 35: China Single-Cell Analysis Industry Revenue (billion) Forecast, by Application 2020 & 2033
- Table 36: China Single-Cell Analysis Industry Volume (K Unit) Forecast, by Application 2020 & 2033
- Table 37: Japan Single-Cell Analysis Industry Revenue (billion) Forecast, by Application 2020 & 2033
- Table 38: Japan Single-Cell Analysis Industry Volume (K Unit) Forecast, by Application 2020 & 2033
- Table 39: India Single-Cell Analysis Industry Revenue (billion) Forecast, by Application 2020 & 2033
- Table 40: India Single-Cell Analysis Industry Volume (K Unit) Forecast, by Application 2020 & 2033
- Table 41: Australia Single-Cell Analysis Industry Revenue (billion) Forecast, by Application 2020 & 2033
- Table 42: Australia Single-Cell Analysis Industry Volume (K Unit) Forecast, by Application 2020 & 2033
- Table 43: South Korea Single-Cell Analysis Industry Revenue (billion) Forecast, by Application 2020 & 2033
- Table 44: South Korea Single-Cell Analysis Industry Volume (K Unit) Forecast, by Application 2020 & 2033
- Table 45: Rest of Asia Pacific Single-Cell Analysis Industry Revenue (billion) Forecast, by Application 2020 & 2033
- Table 46: Rest of Asia Pacific Single-Cell Analysis Industry Volume (K Unit) Forecast, by Application 2020 & 2033
- Table 47: Global Single-Cell Analysis Industry Revenue billion Forecast, by End User 2020 & 2033
- Table 48: Global Single-Cell Analysis Industry Volume K Unit Forecast, by End User 2020 & 2033
- Table 49: Global Single-Cell Analysis Industry Revenue billion Forecast, by Country 2020 & 2033
- Table 50: Global Single-Cell Analysis Industry Volume K Unit Forecast, by Country 2020 & 2033
- Table 51: GCC Single-Cell Analysis Industry Revenue (billion) Forecast, by Application 2020 & 2033
- Table 52: GCC Single-Cell Analysis Industry Volume (K Unit) Forecast, by Application 2020 & 2033
- Table 53: South Africa Single-Cell Analysis Industry Revenue (billion) Forecast, by Application 2020 & 2033
- Table 54: South Africa Single-Cell Analysis Industry Volume (K Unit) Forecast, by Application 2020 & 2033
- Table 55: Rest of Middle East and Africa Single-Cell Analysis Industry Revenue (billion) Forecast, by Application 2020 & 2033
- Table 56: Rest of Middle East and Africa Single-Cell Analysis Industry Volume (K Unit) Forecast, by Application 2020 & 2033
- Table 57: Global Single-Cell Analysis Industry Revenue billion Forecast, by End User 2020 & 2033
- Table 58: Global Single-Cell Analysis Industry Volume K Unit Forecast, by End User 2020 & 2033
- Table 59: Global Single-Cell Analysis Industry Revenue billion Forecast, by Country 2020 & 2033
- Table 60: Global Single-Cell Analysis Industry Volume K Unit Forecast, by Country 2020 & 2033
- Table 61: Brazil Single-Cell Analysis Industry Revenue (billion) Forecast, by Application 2020 & 2033
- Table 62: Brazil Single-Cell Analysis Industry Volume (K Unit) Forecast, by Application 2020 & 2033
- Table 63: Argentina Single-Cell Analysis Industry Revenue (billion) Forecast, by Application 2020 & 2033
- Table 64: Argentina Single-Cell Analysis Industry Volume (K Unit) Forecast, by Application 2020 & 2033
- Table 65: Rest of South America Single-Cell Analysis Industry Revenue (billion) Forecast, by Application 2020 & 2033
- Table 66: Rest of South America Single-Cell Analysis Industry Volume (K Unit) Forecast, by Application 2020 & 2033
Frequently Asked Questions
1. What is the projected Compound Annual Growth Rate (CAGR) of the Single-Cell Analysis Industry?
The projected CAGR is approximately 14.7%.
2. Which companies are prominent players in the Single-Cell Analysis Industry?
Key companies in the market include Becton Dickinson and Company, Bio-Rad Laboratories Inc, Merck KGaA, Thermo Fisher Scientific Inc, Agilent Technologies Inc, Promega Corporation, Beckman Coulter Inc (Danaher Corporation), Qiagen NV, Illumina Inc, GE Healthcare (GE Company), Fluidigm Corporation.
3. What are the main segments of the Single-Cell Analysis Industry?
The market segments include End User.
4. Can you provide details about the market size?
The market size is estimated to be USD 3.81 billion as of 2022.
5. What are some drivers contributing to market growth?
Technological Advancements in Single-cell Analysis Products; Increasing Investments in Cancer Research; Growing Biotechnology and Biopharmaceutical Industries.
6. What are the notable trends driving market growth?
The Research Applications Segment is Expected to Grow at a Good Rate Over the Forecast Period.
7. Are there any restraints impacting market growth?
High Cost of Single Cell Analysis Instruments.
8. Can you provide examples of recent developments in the market?
In March 2022, Mission Bio, Inc., launched the Tapestri Solution for Solid Tumor Research. This new end-to-end single-cell DNA sequencing workflow on the Tapestri Platform includes nuclei isolation prep protocol, pre-designed research panels for breast cancer and glioblastoma multiforme, and an improved single-cell copy number variation (CNV) bioinformatic analysis tool.
9. What pricing options are available for accessing the report?
Pricing options include single-user, multi-user, and enterprise licenses priced at USD 4750, USD 5250, and USD 8750 respectively.
10. Is the market size provided in terms of value or volume?
The market size is provided in terms of value, measured in billion and volume, measured in K Unit.
11. Are there any specific market keywords associated with the report?
Yes, the market keyword associated with the report is "Single-Cell Analysis Industry," which aids in identifying and referencing the specific market segment covered.
12. How do I determine which pricing option suits my needs best?
The pricing options vary based on user requirements and access needs. Individual users may opt for single-user licenses, while businesses requiring broader access may choose multi-user or enterprise licenses for cost-effective access to the report.
13. Are there any additional resources or data provided in the Single-Cell Analysis Industry report?
While the report offers comprehensive insights, it's advisable to review the specific contents or supplementary materials provided to ascertain if additional resources or data are available.
14. How can I stay updated on further developments or reports in the Single-Cell Analysis Industry?
To stay informed about further developments, trends, and reports in the Single-Cell Analysis Industry, consider subscribing to industry newsletters, following relevant companies and organizations, or regularly checking reputable industry news sources and publications.
Methodology
Step 1 - Identification of Relevant Samples Size from Population Database


Step 2 - Approaches for Defining Global Market Size (Value, Volume* & Price*)

Note*: In applicable scenarios
Step 3 - Data Sources
Primary Research
- Web Analytics
- Survey Reports
- Research Institute
- Latest Research Reports
- Opinion Leaders
Secondary Research
- Annual Reports
- White Paper
- Latest Press Release
- Industry Association
- Paid Database
- Investor Presentations

Step 4 - Data Triangulation
Involves using different sources of information in order to increase the validity of a study
These sources are likely to be stakeholders in a program - participants, other researchers, program staff, other community members, and so on.
Then we put all data in single framework & apply various statistical tools to find out the dynamic on the market.
During the analysis stage, feedback from the stakeholder groups would be compared to determine areas of agreement as well as areas of divergence