
Key Insights
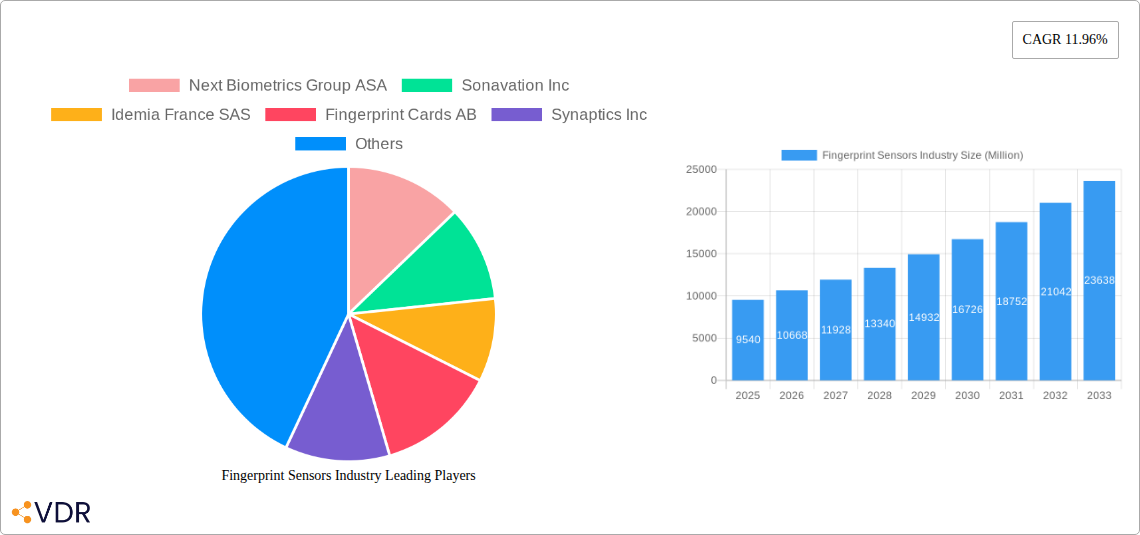
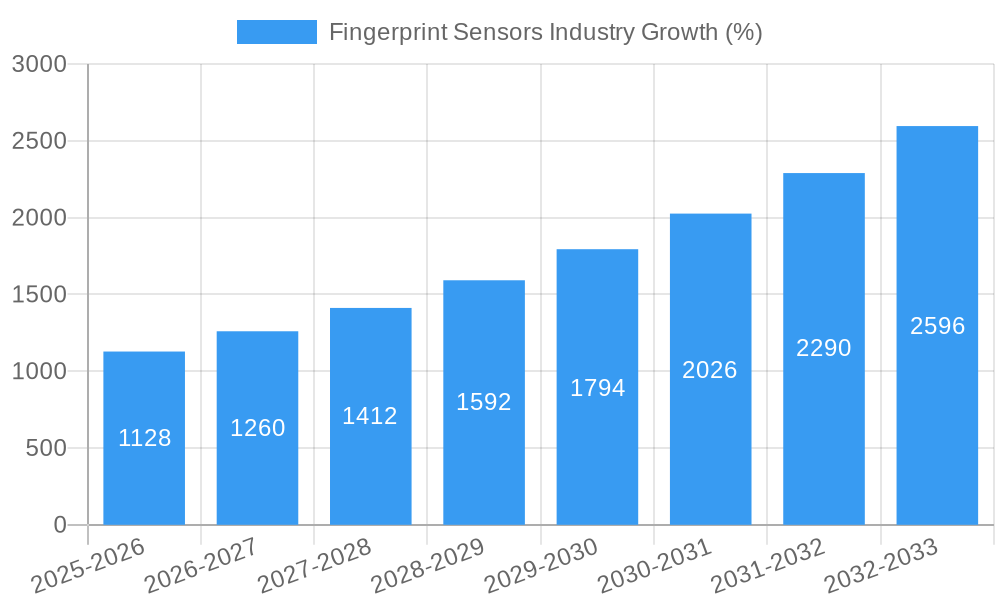
The global fingerprint sensor market, valued at $9.54 billion in 2025, is poised for robust growth, exhibiting a Compound Annual Growth Rate (CAGR) of 11.96% from 2025 to 2033. This expansion is driven by several key factors. The increasing adoption of smartphones and other consumer electronics featuring advanced biometric security features is a significant driver. Furthermore, the growing demand for secure authentication in various sectors, including banking, finance, and services (BFSI), government, and military & defense, fuels market expansion. The integration of fingerprint sensors into Internet of Things (IoT) devices, such as smart home appliances and wearables, is another emerging trend contributing to market growth. Technological advancements leading to smaller, faster, and more accurate fingerprint sensors are also playing a crucial role. While challenges such as the potential for spoofing and concerns over data privacy exist, the overall market trajectory remains positive, driven by the overwhelming advantages of fingerprint authentication in terms of security and convenience.
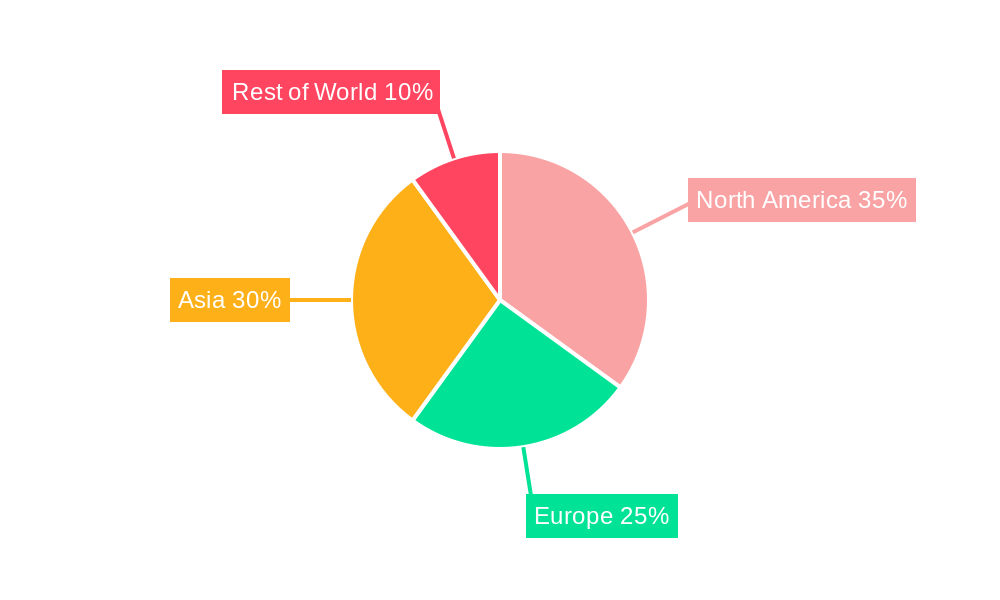
Segment-wise, the smartphone and tablet application segment currently dominates the market, but significant growth opportunities lie within the IoT and smartcard sectors. Geographically, North America and Asia (particularly China) represent the largest markets, with Europe and other regions showing promising growth potential. The competitive landscape includes both established players like Synaptics, Qualcomm, and Idemia, as well as emerging innovators. The market is characterized by ongoing innovation in sensor technology, focusing on improving accuracy, speed, and cost-effectiveness. The forecast period (2025-2033) anticipates continued strong growth, driven by the factors mentioned above, leading to a substantial increase in market value by the end of the forecast period. The continued focus on enhancing security across various applications will be a key catalyst in shaping the future of the fingerprint sensor market.
Fingerprint Sensors Industry Market Report: 2019-2033
This comprehensive report provides an in-depth analysis of the Fingerprint Sensors Industry, encompassing market dynamics, growth trends, regional analysis, product landscape, key players, and future outlook. The study period covers 2019-2033, with 2025 as the base and estimated year. The report is essential for industry professionals, investors, and anyone seeking a thorough understanding of this rapidly evolving market. The total market size is predicted to reach xx Million units by 2033.
Fingerprint Sensors Industry Market Dynamics & Structure
The global fingerprint sensors market is characterized by a moderately concentrated landscape, with key players vying for market share. Technological innovation, particularly in areas like in-display fingerprint sensors and improved accuracy, is a significant driver. Stringent data privacy regulations are shaping market practices, while competitive pressures from alternative authentication methods (e.g., facial recognition) exist. Mergers and acquisitions (M&A) activity remains moderate, with strategic partnerships playing a crucial role in market expansion. The market size in 2025 is estimated at xx Million units.
- Market Concentration: The top 5 players hold approximately xx% of the market share in 2025.
- Technological Innovation: Focus on miniaturization, improved accuracy, and integration with existing devices.
- Regulatory Landscape: Compliance with GDPR, CCPA, and other data privacy regulations is critical.
- Competitive Substitutes: Facial recognition, voice recognition, and other biometric technologies pose competition.
- M&A Activity: xx M&A deals were recorded in the historical period (2019-2024), primarily focused on enhancing technological capabilities and expanding market reach.
- Innovation Barriers: High R&D costs and the need for stringent quality control pose significant barriers to entry.
Fingerprint Sensors Industry Growth Trends & Insights
The fingerprint sensors market has experienced substantial growth over the past years, driven by increasing smartphone adoption and the expanding use of biometric authentication across various sectors. The compound annual growth rate (CAGR) during the historical period (2019-2024) was approximately xx%, while the forecast period (2025-2033) projects a CAGR of xx%. This growth is fueled by technological advancements leading to more accurate, reliable, and cost-effective sensors. Consumer preference for enhanced security and convenience is also a key factor. Market penetration in smartphones is high, while other applications, such as laptops and IoT devices, show significant growth potential.
Dominant Regions, Countries, or Segments in Fingerprint Sensors Industry
The Asia-Pacific region currently holds the largest market share, driven by high smartphone penetration and a strong manufacturing base. North America and Europe follow closely, exhibiting robust growth in various applications, including BFSI and government sectors. Within the application segments, smartphones and tablets dominate, followed by laptops and the rapidly expanding IoT market. The capacitive sensor type currently holds a majority share, but ultrasonic and optical sensors are gaining traction.
- By Application: Smartphones/Tablets (xx Million units in 2025), Laptops (xx Million units in 2025), Smartcards (xx Million units in 2025), IoT and Other Applications (xx Million units in 2025).
- By End-user Industries: Consumer Electronics (xx Million units in 2025), BFSI (xx Million units in 2025), Government (xx Million units in 2025), Military and Defense (xx Million units in 2025).
- By Type: Capacitive (xx Million units in 2025), Optical (xx Million units in 2025), Ultrasonic (xx Million units in 2025), Thermal (xx Million units in 2025).
- Key Drivers: Growing adoption of smartphones and IoT devices, increasing demand for secure authentication solutions, government initiatives promoting digitalization.
Fingerprint Sensors Industry Product Landscape
The fingerprint sensor market offers a diverse range of products, from traditional capacitive sensors to advanced in-display ultrasonic and optical sensors. Key improvements include enhanced image quality, faster response times, and improved reliability in diverse environmental conditions. Unique selling propositions include miniaturization, power efficiency, and seamless integration with various devices. Continuous innovation in materials science and sensor technology leads to ongoing improvements in performance metrics, such as accuracy, durability, and cost-effectiveness.
Key Drivers, Barriers & Challenges in Fingerprint Sensors Industry
Key Drivers: The increasing demand for secure authentication across various applications, coupled with advancements in sensor technology and falling prices, are major drivers. Government initiatives promoting digital identity verification and the expansion of the IoT ecosystem further accelerate market growth.
Key Challenges: Competition from alternative authentication methods, supply chain disruptions, and the need for stringent quality control and regulatory compliance pose significant challenges. Concerns regarding data privacy and security also influence market dynamics. The cost of R&D and production remains a factor for some sensor types.
Emerging Opportunities in Fingerprint Sensors Industry
Emerging opportunities include the expansion into new applications, such as automotive, healthcare, and access control systems. The integration of fingerprint sensors with other biometric technologies, such as facial recognition, offers enhanced security and user experience. The growing adoption of AI and machine learning in fingerprint authentication opens new avenues for improved accuracy and personalization. Furthermore, the development of more robust and cost-effective sensors for harsh environments expands market potential.
Growth Accelerators in the Fingerprint Sensors Industry
Technological advancements, strategic partnerships, and market expansion into new and emerging sectors are key growth accelerators. The continuous development of more accurate, reliable, and cost-effective fingerprint sensors fuels market expansion. Collaborations between sensor manufacturers, device manufacturers, and software developers create synergistic opportunities. Government initiatives promoting digital identification and security further support market growth.
Key Players Shaping the Fingerprint Sensors Industry Market
- Next Biometrics Group ASA
- Sonavation Inc
- Idemia France SAS
- Fingerprint Cards AB
- Synaptics Inc
- Qualcomm Technologies Inc
- NEC Corporation
- Thales Group (Gemalto NV)
- TDK Corporation
- Shenzhen Goodix Technology Co Ltd
- Idex Biometrics ASA
- Vkansee Technology Inc
- Crucialtec Co Ltd
- Egis Technology Inc
Notable Milestones in Fingerprint Sensors Industry Sector
- May 2023: Samsung Display unveiled its Sensor OLED Display technology, integrating the fingerprint sensor directly into the display panel.
- September 2023: Mastercard launched an in-car payment system using fingerprint sensors in partnership with Mercedes-Benz in Germany.
In-Depth Fingerprint Sensors Industry Market Outlook
The fingerprint sensors market is poised for sustained growth, driven by technological innovation, increasing adoption across diverse sectors, and strong demand for secure authentication solutions. Strategic partnerships, expansion into new applications, and ongoing advancements in sensor technology will shape the future market landscape. The market presents significant opportunities for companies that can deliver innovative, reliable, and cost-effective solutions. The continued focus on improving accuracy, miniaturization, and integration with existing devices will be crucial for success.
Fingerprint Sensors Industry Segmentation
-
1. Type
- 1.1. Optical
- 1.2. Capacitive
- 1.3. Thermal
- 1.4. Ultrasonic
-
2. Application
- 2.1. Smartphones/Tablets
- 2.2. Laptops
- 2.3. Smartcards
- 2.4. IoT and Other Applications
-
3. End-user Industries
- 3.1. Military and Defense
- 3.2. Consumer Electronics
- 3.3. BFSI
- 3.4. Government
- 3.5. Other End-user Industries
Fingerprint Sensors Industry Segmentation By Geography
-
1. North America
- 1.1. United States
- 1.2. Canada
-
2. Europe
- 2.1. Germany
- 2.2. United Kingdom
- 2.3. France
-
3. Asia
- 3.1. China
- 3.2. Japan
- 3.3. India
- 3.4. South Korea
- 4. Australia and New Zealand
- 5. Latin America
- 6. Middle East and Africa
Fingerprint Sensors Industry REPORT HIGHLIGHTS
| Aspects | Details |
|---|---|
| Study Period | 2019-2033 |
| Base Year | 2024 |
| Estimated Year | 2025 |
| Forecast Period | 2025-2033 |
| Historical Period | 2019-2024 |
| Growth Rate | CAGR of 11.96% from 2019-2033 |
| Segmentation |
|
Table of Contents
- 1. Introduction
- 1.1. Research Scope
- 1.2. Market Segmentation
- 1.3. Research Methodology
- 1.4. Definitions and Assumptions
- 2. Executive Summary
- 2.1. Introduction
- 3. Market Dynamics
- 3.1. Introduction
- 3.2. Market Drivers
- 3.2.1. Increasing Usage of Fingerprint Sensors for Smart Wearable Devices and Smartphones; Need for Secured Security and Business Applications; Government Initiatives to Adopt Biometrics in Various Fields
- 3.3. Market Restrains
- 3.3.1 Increase in Adoption of Substitute Technologies
- 3.3.2 such as Face and Iris Scanning
- 3.4. Market Trends
- 3.4.1. Smartphones Under the Application Segment is Expected to Hold a Major Share
- 4. Market Factor Analysis
- 4.1. Porters Five Forces
- 4.2. Supply/Value Chain
- 4.3. PESTEL analysis
- 4.4. Market Entropy
- 4.5. Patent/Trademark Analysis
- 5. Global Fingerprint Sensors Industry Analysis, Insights and Forecast, 2019-2031
- 5.1. Market Analysis, Insights and Forecast - by Type
- 5.1.1. Optical
- 5.1.2. Capacitive
- 5.1.3. Thermal
- 5.1.4. Ultrasonic
- 5.2. Market Analysis, Insights and Forecast - by Application
- 5.2.1. Smartphones/Tablets
- 5.2.2. Laptops
- 5.2.3. Smartcards
- 5.2.4. IoT and Other Applications
- 5.3. Market Analysis, Insights and Forecast - by End-user Industries
- 5.3.1. Military and Defense
- 5.3.2. Consumer Electronics
- 5.3.3. BFSI
- 5.3.4. Government
- 5.3.5. Other End-user Industries
- 5.4. Market Analysis, Insights and Forecast - by Region
- 5.4.1. North America
- 5.4.2. Europe
- 5.4.3. Asia
- 5.4.4. Australia and New Zealand
- 5.4.5. Latin America
- 5.4.6. Middle East and Africa
- 5.1. Market Analysis, Insights and Forecast - by Type
- 6. North America Fingerprint Sensors Industry Analysis, Insights and Forecast, 2019-2031
- 6.1. Market Analysis, Insights and Forecast - by Type
- 6.1.1. Optical
- 6.1.2. Capacitive
- 6.1.3. Thermal
- 6.1.4. Ultrasonic
- 6.2. Market Analysis, Insights and Forecast - by Application
- 6.2.1. Smartphones/Tablets
- 6.2.2. Laptops
- 6.2.3. Smartcards
- 6.2.4. IoT and Other Applications
- 6.3. Market Analysis, Insights and Forecast - by End-user Industries
- 6.3.1. Military and Defense
- 6.3.2. Consumer Electronics
- 6.3.3. BFSI
- 6.3.4. Government
- 6.3.5. Other End-user Industries
- 6.1. Market Analysis, Insights and Forecast - by Type
- 7. Europe Fingerprint Sensors Industry Analysis, Insights and Forecast, 2019-2031
- 7.1. Market Analysis, Insights and Forecast - by Type
- 7.1.1. Optical
- 7.1.2. Capacitive
- 7.1.3. Thermal
- 7.1.4. Ultrasonic
- 7.2. Market Analysis, Insights and Forecast - by Application
- 7.2.1. Smartphones/Tablets
- 7.2.2. Laptops
- 7.2.3. Smartcards
- 7.2.4. IoT and Other Applications
- 7.3. Market Analysis, Insights and Forecast - by End-user Industries
- 7.3.1. Military and Defense
- 7.3.2. Consumer Electronics
- 7.3.3. BFSI
- 7.3.4. Government
- 7.3.5. Other End-user Industries
- 7.1. Market Analysis, Insights and Forecast - by Type
- 8. Asia Fingerprint Sensors Industry Analysis, Insights and Forecast, 2019-2031
- 8.1. Market Analysis, Insights and Forecast - by Type
- 8.1.1. Optical
- 8.1.2. Capacitive
- 8.1.3. Thermal
- 8.1.4. Ultrasonic
- 8.2. Market Analysis, Insights and Forecast - by Application
- 8.2.1. Smartphones/Tablets
- 8.2.2. Laptops
- 8.2.3. Smartcards
- 8.2.4. IoT and Other Applications
- 8.3. Market Analysis, Insights and Forecast - by End-user Industries
- 8.3.1. Military and Defense
- 8.3.2. Consumer Electronics
- 8.3.3. BFSI
- 8.3.4. Government
- 8.3.5. Other End-user Industries
- 8.1. Market Analysis, Insights and Forecast - by Type
- 9. Australia and New Zealand Fingerprint Sensors Industry Analysis, Insights and Forecast, 2019-2031
- 9.1. Market Analysis, Insights and Forecast - by Type
- 9.1.1. Optical
- 9.1.2. Capacitive
- 9.1.3. Thermal
- 9.1.4. Ultrasonic
- 9.2. Market Analysis, Insights and Forecast - by Application
- 9.2.1. Smartphones/Tablets
- 9.2.2. Laptops
- 9.2.3. Smartcards
- 9.2.4. IoT and Other Applications
- 9.3. Market Analysis, Insights and Forecast - by End-user Industries
- 9.3.1. Military and Defense
- 9.3.2. Consumer Electronics
- 9.3.3. BFSI
- 9.3.4. Government
- 9.3.5. Other End-user Industries
- 9.1. Market Analysis, Insights and Forecast - by Type
- 10. Latin America Fingerprint Sensors Industry Analysis, Insights and Forecast, 2019-2031
- 10.1. Market Analysis, Insights and Forecast - by Type
- 10.1.1. Optical
- 10.1.2. Capacitive
- 10.1.3. Thermal
- 10.1.4. Ultrasonic
- 10.2. Market Analysis, Insights and Forecast - by Application
- 10.2.1. Smartphones/Tablets
- 10.2.2. Laptops
- 10.2.3. Smartcards
- 10.2.4. IoT and Other Applications
- 10.3. Market Analysis, Insights and Forecast - by End-user Industries
- 10.3.1. Military and Defense
- 10.3.2. Consumer Electronics
- 10.3.3. BFSI
- 10.3.4. Government
- 10.3.5. Other End-user Industries
- 10.1. Market Analysis, Insights and Forecast - by Type
- 11. Middle East and Africa Fingerprint Sensors Industry Analysis, Insights and Forecast, 2019-2031
- 11.1. Market Analysis, Insights and Forecast - by Type
- 11.1.1. Optical
- 11.1.2. Capacitive
- 11.1.3. Thermal
- 11.1.4. Ultrasonic
- 11.2. Market Analysis, Insights and Forecast - by Application
- 11.2.1. Smartphones/Tablets
- 11.2.2. Laptops
- 11.2.3. Smartcards
- 11.2.4. IoT and Other Applications
- 11.3. Market Analysis, Insights and Forecast - by End-user Industries
- 11.3.1. Military and Defense
- 11.3.2. Consumer Electronics
- 11.3.3. BFSI
- 11.3.4. Government
- 11.3.5. Other End-user Industries
- 11.1. Market Analysis, Insights and Forecast - by Type
- 12. North America Fingerprint Sensors Industry Analysis, Insights and Forecast, 2019-2031
- 12.1. Market Analysis, Insights and Forecast - By Country/Sub-region
- 12.1.1 United States
- 12.1.2 Canada
- 13. Europe Fingerprint Sensors Industry Analysis, Insights and Forecast, 2019-2031
- 13.1. Market Analysis, Insights and Forecast - By Country/Sub-region
- 13.1.1 Germany
- 13.1.2 United Kingdom
- 13.1.3 France
- 14. Asia Fingerprint Sensors Industry Analysis, Insights and Forecast, 2019-2031
- 14.1. Market Analysis, Insights and Forecast - By Country/Sub-region
- 14.1.1 China
- 14.1.2 Japan
- 14.1.3 India
- 14.1.4 South Korea
- 15. Australia and New Zealand Fingerprint Sensors Industry Analysis, Insights and Forecast, 2019-2031
- 15.1. Market Analysis, Insights and Forecast - By Country/Sub-region
- 15.1.1.
- 16. Latin America Fingerprint Sensors Industry Analysis, Insights and Forecast, 2019-2031
- 16.1. Market Analysis, Insights and Forecast - By Country/Sub-region
- 16.1.1.
- 17. Middle East and Africa Fingerprint Sensors Industry Analysis, Insights and Forecast, 2019-2031
- 17.1. Market Analysis, Insights and Forecast - By Country/Sub-region
- 17.1.1.
- 18. Competitive Analysis
- 18.1. Global Market Share Analysis 2024
- 18.2. Company Profiles
- 18.2.1 Next Biometrics Group ASA
- 18.2.1.1. Overview
- 18.2.1.2. Products
- 18.2.1.3. SWOT Analysis
- 18.2.1.4. Recent Developments
- 18.2.1.5. Financials (Based on Availability)
- 18.2.2 Sonavation Inc
- 18.2.2.1. Overview
- 18.2.2.2. Products
- 18.2.2.3. SWOT Analysis
- 18.2.2.4. Recent Developments
- 18.2.2.5. Financials (Based on Availability)
- 18.2.3 Idemia France SAS
- 18.2.3.1. Overview
- 18.2.3.2. Products
- 18.2.3.3. SWOT Analysis
- 18.2.3.4. Recent Developments
- 18.2.3.5. Financials (Based on Availability)
- 18.2.4 Fingerprint Cards AB
- 18.2.4.1. Overview
- 18.2.4.2. Products
- 18.2.4.3. SWOT Analysis
- 18.2.4.4. Recent Developments
- 18.2.4.5. Financials (Based on Availability)
- 18.2.5 Synaptics Inc
- 18.2.5.1. Overview
- 18.2.5.2. Products
- 18.2.5.3. SWOT Analysis
- 18.2.5.4. Recent Developments
- 18.2.5.5. Financials (Based on Availability)
- 18.2.6 Qualcomm Technologies Inc
- 18.2.6.1. Overview
- 18.2.6.2. Products
- 18.2.6.3. SWOT Analysis
- 18.2.6.4. Recent Developments
- 18.2.6.5. Financials (Based on Availability)
- 18.2.7 NEC Corporation
- 18.2.7.1. Overview
- 18.2.7.2. Products
- 18.2.7.3. SWOT Analysis
- 18.2.7.4. Recent Developments
- 18.2.7.5. Financials (Based on Availability)
- 18.2.8 Thales Group (Gemalto NV)
- 18.2.8.1. Overview
- 18.2.8.2. Products
- 18.2.8.3. SWOT Analysis
- 18.2.8.4. Recent Developments
- 18.2.8.5. Financials (Based on Availability)
- 18.2.9 TDK Corporation
- 18.2.9.1. Overview
- 18.2.9.2. Products
- 18.2.9.3. SWOT Analysis
- 18.2.9.4. Recent Developments
- 18.2.9.5. Financials (Based on Availability)
- 18.2.10 Shenzhen Goodix Technology Co Ltd
- 18.2.10.1. Overview
- 18.2.10.2. Products
- 18.2.10.3. SWOT Analysis
- 18.2.10.4. Recent Developments
- 18.2.10.5. Financials (Based on Availability)
- 18.2.11 Idex Biometrics ASA
- 18.2.11.1. Overview
- 18.2.11.2. Products
- 18.2.11.3. SWOT Analysis
- 18.2.11.4. Recent Developments
- 18.2.11.5. Financials (Based on Availability)
- 18.2.12 Vkansee Technology Inc
- 18.2.12.1. Overview
- 18.2.12.2. Products
- 18.2.12.3. SWOT Analysis
- 18.2.12.4. Recent Developments
- 18.2.12.5. Financials (Based on Availability)
- 18.2.13 Crucialtec Co Ltd
- 18.2.13.1. Overview
- 18.2.13.2. Products
- 18.2.13.3. SWOT Analysis
- 18.2.13.4. Recent Developments
- 18.2.13.5. Financials (Based on Availability)
- 18.2.14 Egis Technology Inc
- 18.2.14.1. Overview
- 18.2.14.2. Products
- 18.2.14.3. SWOT Analysis
- 18.2.14.4. Recent Developments
- 18.2.14.5. Financials (Based on Availability)
- 18.2.1 Next Biometrics Group ASA
List of Figures
- Figure 1: Global Fingerprint Sensors Industry Revenue Breakdown (Million, %) by Region 2024 & 2032
- Figure 2: North America Fingerprint Sensors Industry Revenue (Million), by Country 2024 & 2032
- Figure 3: North America Fingerprint Sensors Industry Revenue Share (%), by Country 2024 & 2032
- Figure 4: Europe Fingerprint Sensors Industry Revenue (Million), by Country 2024 & 2032
- Figure 5: Europe Fingerprint Sensors Industry Revenue Share (%), by Country 2024 & 2032
- Figure 6: Asia Fingerprint Sensors Industry Revenue (Million), by Country 2024 & 2032
- Figure 7: Asia Fingerprint Sensors Industry Revenue Share (%), by Country 2024 & 2032
- Figure 8: Australia and New Zealand Fingerprint Sensors Industry Revenue (Million), by Country 2024 & 2032
- Figure 9: Australia and New Zealand Fingerprint Sensors Industry Revenue Share (%), by Country 2024 & 2032
- Figure 10: Latin America Fingerprint Sensors Industry Revenue (Million), by Country 2024 & 2032
- Figure 11: Latin America Fingerprint Sensors Industry Revenue Share (%), by Country 2024 & 2032
- Figure 12: Middle East and Africa Fingerprint Sensors Industry Revenue (Million), by Country 2024 & 2032
- Figure 13: Middle East and Africa Fingerprint Sensors Industry Revenue Share (%), by Country 2024 & 2032
- Figure 14: North America Fingerprint Sensors Industry Revenue (Million), by Type 2024 & 2032
- Figure 15: North America Fingerprint Sensors Industry Revenue Share (%), by Type 2024 & 2032
- Figure 16: North America Fingerprint Sensors Industry Revenue (Million), by Application 2024 & 2032
- Figure 17: North America Fingerprint Sensors Industry Revenue Share (%), by Application 2024 & 2032
- Figure 18: North America Fingerprint Sensors Industry Revenue (Million), by End-user Industries 2024 & 2032
- Figure 19: North America Fingerprint Sensors Industry Revenue Share (%), by End-user Industries 2024 & 2032
- Figure 20: North America Fingerprint Sensors Industry Revenue (Million), by Country 2024 & 2032
- Figure 21: North America Fingerprint Sensors Industry Revenue Share (%), by Country 2024 & 2032
- Figure 22: Europe Fingerprint Sensors Industry Revenue (Million), by Type 2024 & 2032
- Figure 23: Europe Fingerprint Sensors Industry Revenue Share (%), by Type 2024 & 2032
- Figure 24: Europe Fingerprint Sensors Industry Revenue (Million), by Application 2024 & 2032
- Figure 25: Europe Fingerprint Sensors Industry Revenue Share (%), by Application 2024 & 2032
- Figure 26: Europe Fingerprint Sensors Industry Revenue (Million), by End-user Industries 2024 & 2032
- Figure 27: Europe Fingerprint Sensors Industry Revenue Share (%), by End-user Industries 2024 & 2032
- Figure 28: Europe Fingerprint Sensors Industry Revenue (Million), by Country 2024 & 2032
- Figure 29: Europe Fingerprint Sensors Industry Revenue Share (%), by Country 2024 & 2032
- Figure 30: Asia Fingerprint Sensors Industry Revenue (Million), by Type 2024 & 2032
- Figure 31: Asia Fingerprint Sensors Industry Revenue Share (%), by Type 2024 & 2032
- Figure 32: Asia Fingerprint Sensors Industry Revenue (Million), by Application 2024 & 2032
- Figure 33: Asia Fingerprint Sensors Industry Revenue Share (%), by Application 2024 & 2032
- Figure 34: Asia Fingerprint Sensors Industry Revenue (Million), by End-user Industries 2024 & 2032
- Figure 35: Asia Fingerprint Sensors Industry Revenue Share (%), by End-user Industries 2024 & 2032
- Figure 36: Asia Fingerprint Sensors Industry Revenue (Million), by Country 2024 & 2032
- Figure 37: Asia Fingerprint Sensors Industry Revenue Share (%), by Country 2024 & 2032
- Figure 38: Australia and New Zealand Fingerprint Sensors Industry Revenue (Million), by Type 2024 & 2032
- Figure 39: Australia and New Zealand Fingerprint Sensors Industry Revenue Share (%), by Type 2024 & 2032
- Figure 40: Australia and New Zealand Fingerprint Sensors Industry Revenue (Million), by Application 2024 & 2032
- Figure 41: Australia and New Zealand Fingerprint Sensors Industry Revenue Share (%), by Application 2024 & 2032
- Figure 42: Australia and New Zealand Fingerprint Sensors Industry Revenue (Million), by End-user Industries 2024 & 2032
- Figure 43: Australia and New Zealand Fingerprint Sensors Industry Revenue Share (%), by End-user Industries 2024 & 2032
- Figure 44: Australia and New Zealand Fingerprint Sensors Industry Revenue (Million), by Country 2024 & 2032
- Figure 45: Australia and New Zealand Fingerprint Sensors Industry Revenue Share (%), by Country 2024 & 2032
- Figure 46: Latin America Fingerprint Sensors Industry Revenue (Million), by Type 2024 & 2032
- Figure 47: Latin America Fingerprint Sensors Industry Revenue Share (%), by Type 2024 & 2032
- Figure 48: Latin America Fingerprint Sensors Industry Revenue (Million), by Application 2024 & 2032
- Figure 49: Latin America Fingerprint Sensors Industry Revenue Share (%), by Application 2024 & 2032
- Figure 50: Latin America Fingerprint Sensors Industry Revenue (Million), by End-user Industries 2024 & 2032
- Figure 51: Latin America Fingerprint Sensors Industry Revenue Share (%), by End-user Industries 2024 & 2032
- Figure 52: Latin America Fingerprint Sensors Industry Revenue (Million), by Country 2024 & 2032
- Figure 53: Latin America Fingerprint Sensors Industry Revenue Share (%), by Country 2024 & 2032
- Figure 54: Middle East and Africa Fingerprint Sensors Industry Revenue (Million), by Type 2024 & 2032
- Figure 55: Middle East and Africa Fingerprint Sensors Industry Revenue Share (%), by Type 2024 & 2032
- Figure 56: Middle East and Africa Fingerprint Sensors Industry Revenue (Million), by Application 2024 & 2032
- Figure 57: Middle East and Africa Fingerprint Sensors Industry Revenue Share (%), by Application 2024 & 2032
- Figure 58: Middle East and Africa Fingerprint Sensors Industry Revenue (Million), by End-user Industries 2024 & 2032
- Figure 59: Middle East and Africa Fingerprint Sensors Industry Revenue Share (%), by End-user Industries 2024 & 2032
- Figure 60: Middle East and Africa Fingerprint Sensors Industry Revenue (Million), by Country 2024 & 2032
- Figure 61: Middle East and Africa Fingerprint Sensors Industry Revenue Share (%), by Country 2024 & 2032
List of Tables
- Table 1: Global Fingerprint Sensors Industry Revenue Million Forecast, by Region 2019 & 2032
- Table 2: Global Fingerprint Sensors Industry Revenue Million Forecast, by Type 2019 & 2032
- Table 3: Global Fingerprint Sensors Industry Revenue Million Forecast, by Application 2019 & 2032
- Table 4: Global Fingerprint Sensors Industry Revenue Million Forecast, by End-user Industries 2019 & 2032
- Table 5: Global Fingerprint Sensors Industry Revenue Million Forecast, by Region 2019 & 2032
- Table 6: Global Fingerprint Sensors Industry Revenue Million Forecast, by Country 2019 & 2032
- Table 7: United States Fingerprint Sensors Industry Revenue (Million) Forecast, by Application 2019 & 2032
- Table 8: Canada Fingerprint Sensors Industry Revenue (Million) Forecast, by Application 2019 & 2032
- Table 9: Global Fingerprint Sensors Industry Revenue Million Forecast, by Country 2019 & 2032
- Table 10: Germany Fingerprint Sensors Industry Revenue (Million) Forecast, by Application 2019 & 2032
- Table 11: United Kingdom Fingerprint Sensors Industry Revenue (Million) Forecast, by Application 2019 & 2032
- Table 12: France Fingerprint Sensors Industry Revenue (Million) Forecast, by Application 2019 & 2032
- Table 13: Global Fingerprint Sensors Industry Revenue Million Forecast, by Country 2019 & 2032
- Table 14: China Fingerprint Sensors Industry Revenue (Million) Forecast, by Application 2019 & 2032
- Table 15: Japan Fingerprint Sensors Industry Revenue (Million) Forecast, by Application 2019 & 2032
- Table 16: India Fingerprint Sensors Industry Revenue (Million) Forecast, by Application 2019 & 2032
- Table 17: South Korea Fingerprint Sensors Industry Revenue (Million) Forecast, by Application 2019 & 2032
- Table 18: Global Fingerprint Sensors Industry Revenue Million Forecast, by Country 2019 & 2032
- Table 19: Fingerprint Sensors Industry Revenue (Million) Forecast, by Application 2019 & 2032
- Table 20: Global Fingerprint Sensors Industry Revenue Million Forecast, by Country 2019 & 2032
- Table 21: Fingerprint Sensors Industry Revenue (Million) Forecast, by Application 2019 & 2032
- Table 22: Global Fingerprint Sensors Industry Revenue Million Forecast, by Country 2019 & 2032
- Table 23: Fingerprint Sensors Industry Revenue (Million) Forecast, by Application 2019 & 2032
- Table 24: Global Fingerprint Sensors Industry Revenue Million Forecast, by Type 2019 & 2032
- Table 25: Global Fingerprint Sensors Industry Revenue Million Forecast, by Application 2019 & 2032
- Table 26: Global Fingerprint Sensors Industry Revenue Million Forecast, by End-user Industries 2019 & 2032
- Table 27: Global Fingerprint Sensors Industry Revenue Million Forecast, by Country 2019 & 2032
- Table 28: United States Fingerprint Sensors Industry Revenue (Million) Forecast, by Application 2019 & 2032
- Table 29: Canada Fingerprint Sensors Industry Revenue (Million) Forecast, by Application 2019 & 2032
- Table 30: Global Fingerprint Sensors Industry Revenue Million Forecast, by Type 2019 & 2032
- Table 31: Global Fingerprint Sensors Industry Revenue Million Forecast, by Application 2019 & 2032
- Table 32: Global Fingerprint Sensors Industry Revenue Million Forecast, by End-user Industries 2019 & 2032
- Table 33: Global Fingerprint Sensors Industry Revenue Million Forecast, by Country 2019 & 2032
- Table 34: Germany Fingerprint Sensors Industry Revenue (Million) Forecast, by Application 2019 & 2032
- Table 35: United Kingdom Fingerprint Sensors Industry Revenue (Million) Forecast, by Application 2019 & 2032
- Table 36: France Fingerprint Sensors Industry Revenue (Million) Forecast, by Application 2019 & 2032
- Table 37: Global Fingerprint Sensors Industry Revenue Million Forecast, by Type 2019 & 2032
- Table 38: Global Fingerprint Sensors Industry Revenue Million Forecast, by Application 2019 & 2032
- Table 39: Global Fingerprint Sensors Industry Revenue Million Forecast, by End-user Industries 2019 & 2032
- Table 40: Global Fingerprint Sensors Industry Revenue Million Forecast, by Country 2019 & 2032
- Table 41: China Fingerprint Sensors Industry Revenue (Million) Forecast, by Application 2019 & 2032
- Table 42: Japan Fingerprint Sensors Industry Revenue (Million) Forecast, by Application 2019 & 2032
- Table 43: India Fingerprint Sensors Industry Revenue (Million) Forecast, by Application 2019 & 2032
- Table 44: South Korea Fingerprint Sensors Industry Revenue (Million) Forecast, by Application 2019 & 2032
- Table 45: Global Fingerprint Sensors Industry Revenue Million Forecast, by Type 2019 & 2032
- Table 46: Global Fingerprint Sensors Industry Revenue Million Forecast, by Application 2019 & 2032
- Table 47: Global Fingerprint Sensors Industry Revenue Million Forecast, by End-user Industries 2019 & 2032
- Table 48: Global Fingerprint Sensors Industry Revenue Million Forecast, by Country 2019 & 2032
- Table 49: Global Fingerprint Sensors Industry Revenue Million Forecast, by Type 2019 & 2032
- Table 50: Global Fingerprint Sensors Industry Revenue Million Forecast, by Application 2019 & 2032
- Table 51: Global Fingerprint Sensors Industry Revenue Million Forecast, by End-user Industries 2019 & 2032
- Table 52: Global Fingerprint Sensors Industry Revenue Million Forecast, by Country 2019 & 2032
- Table 53: Global Fingerprint Sensors Industry Revenue Million Forecast, by Type 2019 & 2032
- Table 54: Global Fingerprint Sensors Industry Revenue Million Forecast, by Application 2019 & 2032
- Table 55: Global Fingerprint Sensors Industry Revenue Million Forecast, by End-user Industries 2019 & 2032
- Table 56: Global Fingerprint Sensors Industry Revenue Million Forecast, by Country 2019 & 2032
Frequently Asked Questions
1. What is the projected Compound Annual Growth Rate (CAGR) of the Fingerprint Sensors Industry?
The projected CAGR is approximately 11.96%.
2. Which companies are prominent players in the Fingerprint Sensors Industry?
Key companies in the market include Next Biometrics Group ASA, Sonavation Inc, Idemia France SAS, Fingerprint Cards AB, Synaptics Inc, Qualcomm Technologies Inc, NEC Corporation, Thales Group (Gemalto NV), TDK Corporation, Shenzhen Goodix Technology Co Ltd, Idex Biometrics ASA, Vkansee Technology Inc, Crucialtec Co Ltd, Egis Technology Inc.
3. What are the main segments of the Fingerprint Sensors Industry?
The market segments include Type, Application, End-user Industries.
4. Can you provide details about the market size?
The market size is estimated to be USD 9.54 Million as of 2022.
5. What are some drivers contributing to market growth?
Increasing Usage of Fingerprint Sensors for Smart Wearable Devices and Smartphones; Need for Secured Security and Business Applications; Government Initiatives to Adopt Biometrics in Various Fields.
6. What are the notable trends driving market growth?
Smartphones Under the Application Segment is Expected to Hold a Major Share.
7. Are there any restraints impacting market growth?
Increase in Adoption of Substitute Technologies. such as Face and Iris Scanning.
8. Can you provide examples of recent developments in the market?
September 2023 - Mastercard launched an in-car payment partnership aimed at Mercedes drivers in Germany. The collaboration will allow customers to use a fingerprint sensor in their car to make digital payments at more than 3,600 service stations in Germany.
9. What pricing options are available for accessing the report?
Pricing options include single-user, multi-user, and enterprise licenses priced at USD 4750, USD 5250, and USD 8750 respectively.
10. Is the market size provided in terms of value or volume?
The market size is provided in terms of value, measured in Million.
11. Are there any specific market keywords associated with the report?
Yes, the market keyword associated with the report is "Fingerprint Sensors Industry," which aids in identifying and referencing the specific market segment covered.
12. How do I determine which pricing option suits my needs best?
The pricing options vary based on user requirements and access needs. Individual users may opt for single-user licenses, while businesses requiring broader access may choose multi-user or enterprise licenses for cost-effective access to the report.
13. Are there any additional resources or data provided in the Fingerprint Sensors Industry report?
While the report offers comprehensive insights, it's advisable to review the specific contents or supplementary materials provided to ascertain if additional resources or data are available.
14. How can I stay updated on further developments or reports in the Fingerprint Sensors Industry?
To stay informed about further developments, trends, and reports in the Fingerprint Sensors Industry, consider subscribing to industry newsletters, following relevant companies and organizations, or regularly checking reputable industry news sources and publications.
Methodology
Step 1 - Identification of Relevant Samples Size from Population Database


Step 2 - Approaches for Defining Global Market Size (Value, Volume* & Price*)

Note*: In applicable scenarios
Step 3 - Data Sources
Primary Research
- Web Analytics
- Survey Reports
- Research Institute
- Latest Research Reports
- Opinion Leaders
Secondary Research
- Annual Reports
- White Paper
- Latest Press Release
- Industry Association
- Paid Database
- Investor Presentations

Step 4 - Data Triangulation
Involves using different sources of information in order to increase the validity of a study
These sources are likely to be stakeholders in a program - participants, other researchers, program staff, other community members, and so on.
Then we put all data in single framework & apply various statistical tools to find out the dynamic on the market.
During the analysis stage, feedback from the stakeholder groups would be compared to determine areas of agreement as well as areas of divergence


