
Key Insights
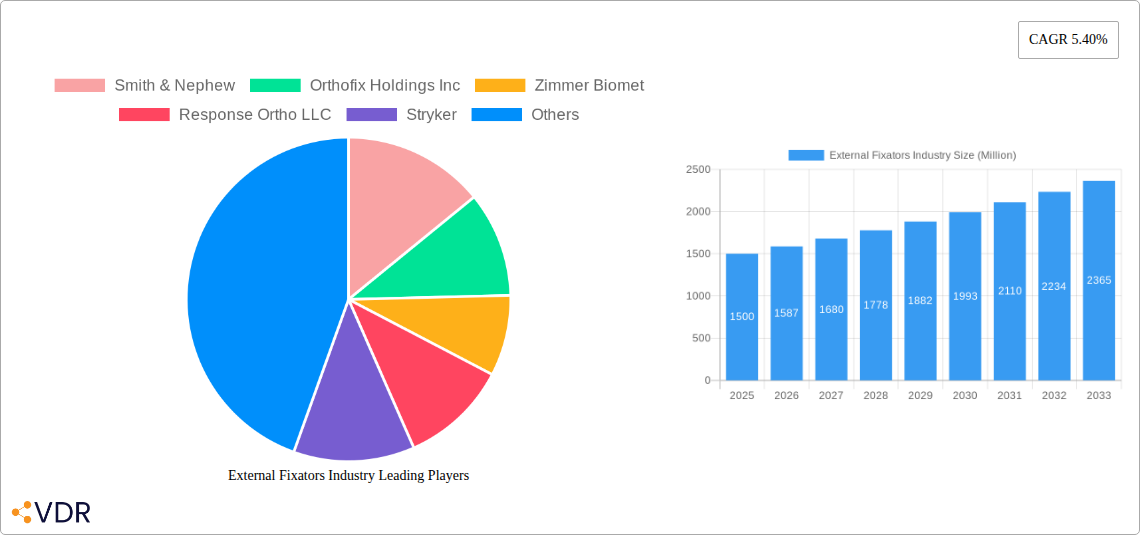
The global external fixators market, valued at approximately $1.5 billion in 2025, is projected to experience robust growth, driven by a compound annual growth rate (CAGR) of 5.40% from 2025 to 2033. This expansion is fueled by several key factors. Rising incidence of fractures and orthopedic deformities, particularly in aging populations and due to increased trauma cases globally, create significant demand for effective fixation solutions. Technological advancements in external fixators, including the development of computer-aided and minimally invasive techniques, are enhancing surgical precision and patient outcomes, thereby boosting market adoption. Furthermore, the growing preference for ambulatory surgical procedures, coupled with rising healthcare expenditure in several regions, is contributing to market growth. The market is segmented by end-user (hospitals, ambulatory surgical centers, orthopedic and trauma centers), product type (manual, computer-aided), fixation type (unilateral, bilateral, circular, hybrid), and application (orthopedic deformities, fracture fixation, infected fractures, limb correction). The competitive landscape comprises established players like Smith & Nephew, Zimmer Biomet, and Stryker, alongside emerging companies specializing in innovative fixator designs.
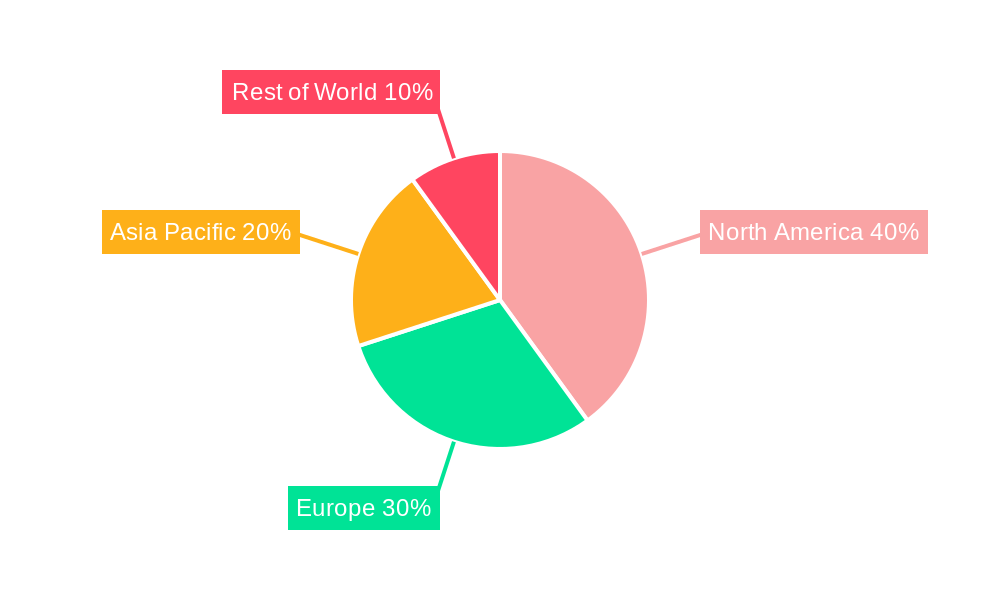
Geographic distribution reveals strong market presence in North America and Europe, driven by established healthcare infrastructure and high adoption rates of advanced medical technologies. However, significant growth potential exists in Asia-Pacific and other emerging markets due to increasing healthcare awareness, rising disposable incomes, and improving healthcare infrastructure. Challenges remain, including high costs associated with advanced fixator systems and potential risks associated with infection and complications. Nevertheless, the continuous development of innovative products, alongside strategic partnerships and acquisitions within the industry, are expected to mitigate these challenges and further propel market growth in the forecast period. The increasing adoption of minimally invasive surgical techniques, and the integration of digital technologies into surgical planning and execution, are expected to shape the future of the external fixators market.
External Fixators Industry Market Report: 2019-2033
This comprehensive report provides a detailed analysis of the External Fixators market, encompassing market dynamics, growth trends, regional analysis, product landscape, key players, and future outlook. The study period covers 2019-2033, with 2025 as the base and estimated year. This report is invaluable for industry professionals, investors, and researchers seeking a deep understanding of this evolving market. The global market size is projected to reach xx Million units by 2033.
External Fixators Industry Market Dynamics & Structure
The external fixators market is characterized by a moderately consolidated structure, with key players such as Smith & Nephew, Orthofix Holdings Inc., Zimmer Biomet, and Stryker holding significant market share. Technological innovation, particularly in computer-aided fixators and robotic-assisted systems, is a major driver of growth. Regulatory frameworks, including FDA approvals and CE markings, play a crucial role in product adoption. Competitive substitutes include internal fixation devices and other fracture management techniques. The end-user demographics are primarily hospitals, ambulatory surgical centers, and orthopedic & trauma centers, with hospitals currently dominating market share. The market has witnessed several significant M&A activities in recent years, reflecting the industry's dynamic nature.
- Market Concentration: Moderately consolidated, with top players holding xx% market share in 2024.
- Technological Innovation: Focus on computer-aided design, lightweight materials (e.g., carbon fiber), and robotic integration.
- Regulatory Landscape: Stringent FDA and CE regulations influence product development and market entry.
- Competitive Substitutes: Internal fixation devices and other fracture management techniques pose competition.
- End-User Demographics: Hospitals (xx%), Ambulatory Surgical Centers (xx%), Orthopedic & Trauma Centers (xx%).
- M&A Activity: xx major acquisitions and mergers recorded between 2019 and 2024.
External Fixators Industry Growth Trends & Insights
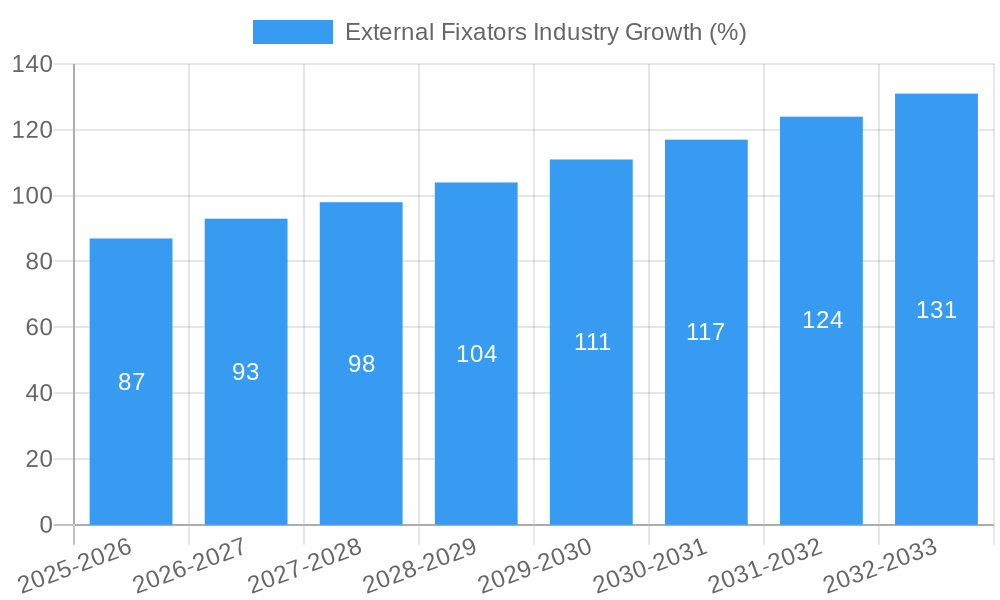
The external fixators market exhibits a robust growth trajectory, driven by rising incidence of fractures, increasing demand for minimally invasive surgeries, and advancements in product technology. The market size expanded from xx Million units in 2019 to xx Million units in 2024, exhibiting a CAGR of xx%. Technological disruptions, such as the introduction of computer-aided fixators and robotic systems, are accelerating market growth and improving treatment outcomes. Consumer behavior shifts towards minimally invasive procedures and personalized medicine further contribute to market expansion. Adoption rates are expected to increase significantly in emerging economies.
- Market Size Evolution: Significant growth from xx Million units (2019) to xx Million units (2024).
- CAGR (2019-2024): xx%
- Adoption Rates: Increasing adoption across various settings, particularly in developed countries.
- Technological Disruptions: Computer-aided fixators and robotic systems enhance accuracy and efficiency.
- Consumer Behavior: Preference for minimally invasive procedures and improved patient outcomes.
Dominant Regions, Countries, or Segments in External Fixators Industry
North America currently dominates the external fixators market, driven by high healthcare expenditure, advanced medical infrastructure, and a large patient pool. Within the product segments, computer-aided fixators are experiencing faster growth compared to manual fixators due to their improved precision and reduced surgical time. Among applications, fracture fixation holds the largest market share, followed by orthopedic deformities and limb correction. Hospitals constitute the largest end-user segment. Growth in emerging economies, particularly in Asia-Pacific and Latin America, presents significant opportunities.
- Leading Region: North America (xx% market share).
- Leading Product Type: Computer-Aided Fixators (growing at xx% CAGR).
- Leading Application: Fracture Fixation (xx% market share).
- Leading End-User: Hospitals (xx% market share).
- High-Growth Regions: Asia-Pacific and Latin America.
External Fixators Industry Product Landscape
The external fixators market showcases a range of products, from traditional manual fixators to advanced computer-aided systems. Innovations include lightweight materials like carbon fiber, improved fixation mechanisms, and integrated monitoring capabilities. These advancements enhance patient comfort, reduce surgical time, and improve treatment outcomes. Unique selling propositions often focus on precision, ease of use, and minimally invasive surgery capabilities.
Key Drivers, Barriers & Challenges in External Fixators Industry
Key Drivers: The rising incidence of fractures and orthopedic deformities, advancements in product technology (lightweight materials, computer-aided systems), increasing demand for minimally invasive procedures, and favorable reimbursement policies are primary growth drivers.
Challenges: High initial costs of computer-aided systems, stringent regulatory requirements, competition from alternative treatments (internal fixation), and supply chain disruptions pose challenges to market growth. These factors can result in a xx% decrease in market growth in specific regions.
Emerging Opportunities in External Fixators Industry
Untapped markets in emerging economies, the development of innovative applications (e.g., customized fixators), and the growing adoption of telehealth monitoring represent significant opportunities for market expansion. Evolving consumer preferences for minimally invasive procedures and personalized medicine create further growth potential.
Growth Accelerators in the External Fixators Industry Industry
Technological advancements such as the integration of artificial intelligence and 3D printing in external fixator design and manufacturing, strategic partnerships between device manufacturers and healthcare providers, and expansion into emerging markets through joint ventures or distribution agreements will accelerate market growth.
Key Players Shaping the External Fixators Industry Market
- Smith & Nephew
- Orthofix Holdings Inc
- Zimmer Biomet
- Response Ortho LLC
- Stryker
- Ortho-SUV Ltd
- Johnson & Johnson (DePuy Synthes)
Notable Milestones in External Fixators Industry Sector
- March 2022: Orthofix receives USFDA 510(k) clearance for its TrueLok Evo Ring Fixation system.
- December 2021: Johnson & Johnson's DePuy Synthes acquires OrthoSpin, a developer of robot-assisted external fixation systems.
In-Depth External Fixators Industry Market Outlook
The external fixators market is poised for continued growth, driven by technological innovations, expanding applications, and increasing demand in emerging markets. Strategic partnerships, product diversification, and a focus on minimally invasive techniques will be crucial for companies to capitalize on future opportunities and maintain a competitive edge. The market is expected to reach xx Million units by 2033, presenting significant investment and growth potential for stakeholders.
External Fixators Industry Segmentation
-
1. Product Type
- 1.1. Manual Fixators
- 1.2. Computer-Aided Fixators
-
2. Fixation Type
- 2.1. Unilateral and Bilateral
- 2.2. Circular
- 2.3. Hybrid
- 2.4. Others
-
3. Application
- 3.1. Orthopedic Deformities
- 3.2. Fracture Fixation
- 3.3. Infected Fracture
- 3.4. Limb Correction
- 3.5. Other Applications
-
4. End-User
- 4.1. Hospitals
- 4.2. Ambulatory Surgical Centers
- 4.3. Orthopedic and Trauma Centers
External Fixators Industry Segmentation By Geography
-
1. North America
- 1.1. United States
- 1.2. Canada
- 1.3. Mexico
-
2. Europe
- 2.1. Germany
- 2.2. United Kingdom
- 2.3. France
- 2.4. Italy
- 2.5. Spain
- 2.6. Rest of Europe
-
3. Asia Pacific
- 3.1. China
- 3.2. Japan
- 3.3. India
- 3.4. Australia
- 3.5. South Korea
- 3.6. Rest of Asia Pacific
-
4. Middle East and Africa
- 4.1. GCC
- 4.2. South Africa
- 4.3. Rest of Middle East and Africa
-
5. South America
- 5.1. Brazil
- 5.2. Argentina
- 5.3. Rest of South America
External Fixators Industry REPORT HIGHLIGHTS
| Aspects | Details |
|---|---|
| Study Period | 2019-2033 |
| Base Year | 2024 |
| Estimated Year | 2025 |
| Forecast Period | 2025-2033 |
| Historical Period | 2019-2024 |
| Growth Rate | CAGR of 5.40% from 2019-2033 |
| Segmentation |
|
Table of Contents
- 1. Introduction
- 1.1. Research Scope
- 1.2. Market Segmentation
- 1.3. Research Methodology
- 1.4. Definitions and Assumptions
- 2. Executive Summary
- 2.1. Introduction
- 3. Market Dynamics
- 3.1. Introduction
- 3.2. Market Drivers
- 3.2.1 Surging Road Accidents
- 3.2.2 Sports-Related and Other Injuries; Rising Preference for Minimally Invasive Surgeries
- 3.3. Market Restrains
- 3.3.1. Availability of Alternative Treatments in line with the Shortage of Skilled Orthopaedic Surgeons
- 3.4. Market Trends
- 3.4.1. Fracture Fixation is Expected to Witness Significant Growth over the Forecast Period
- 4. Market Factor Analysis
- 4.1. Porters Five Forces
- 4.2. Supply/Value Chain
- 4.3. PESTEL analysis
- 4.4. Market Entropy
- 4.5. Patent/Trademark Analysis
- 5. Global External Fixators Industry Analysis, Insights and Forecast, 2019-2031
- 5.1. Market Analysis, Insights and Forecast - by Product Type
- 5.1.1. Manual Fixators
- 5.1.2. Computer-Aided Fixators
- 5.2. Market Analysis, Insights and Forecast - by Fixation Type
- 5.2.1. Unilateral and Bilateral
- 5.2.2. Circular
- 5.2.3. Hybrid
- 5.2.4. Others
- 5.3. Market Analysis, Insights and Forecast - by Application
- 5.3.1. Orthopedic Deformities
- 5.3.2. Fracture Fixation
- 5.3.3. Infected Fracture
- 5.3.4. Limb Correction
- 5.3.5. Other Applications
- 5.4. Market Analysis, Insights and Forecast - by End-User
- 5.4.1. Hospitals
- 5.4.2. Ambulatory Surgical Centers
- 5.4.3. Orthopedic and Trauma Centers
- 5.5. Market Analysis, Insights and Forecast - by Region
- 5.5.1. North America
- 5.5.2. Europe
- 5.5.3. Asia Pacific
- 5.5.4. Middle East and Africa
- 5.5.5. South America
- 5.1. Market Analysis, Insights and Forecast - by Product Type
- 6. North America External Fixators Industry Analysis, Insights and Forecast, 2019-2031
- 6.1. Market Analysis, Insights and Forecast - by Product Type
- 6.1.1. Manual Fixators
- 6.1.2. Computer-Aided Fixators
- 6.2. Market Analysis, Insights and Forecast - by Fixation Type
- 6.2.1. Unilateral and Bilateral
- 6.2.2. Circular
- 6.2.3. Hybrid
- 6.2.4. Others
- 6.3. Market Analysis, Insights and Forecast - by Application
- 6.3.1. Orthopedic Deformities
- 6.3.2. Fracture Fixation
- 6.3.3. Infected Fracture
- 6.3.4. Limb Correction
- 6.3.5. Other Applications
- 6.4. Market Analysis, Insights and Forecast - by End-User
- 6.4.1. Hospitals
- 6.4.2. Ambulatory Surgical Centers
- 6.4.3. Orthopedic and Trauma Centers
- 6.1. Market Analysis, Insights and Forecast - by Product Type
- 7. Europe External Fixators Industry Analysis, Insights and Forecast, 2019-2031
- 7.1. Market Analysis, Insights and Forecast - by Product Type
- 7.1.1. Manual Fixators
- 7.1.2. Computer-Aided Fixators
- 7.2. Market Analysis, Insights and Forecast - by Fixation Type
- 7.2.1. Unilateral and Bilateral
- 7.2.2. Circular
- 7.2.3. Hybrid
- 7.2.4. Others
- 7.3. Market Analysis, Insights and Forecast - by Application
- 7.3.1. Orthopedic Deformities
- 7.3.2. Fracture Fixation
- 7.3.3. Infected Fracture
- 7.3.4. Limb Correction
- 7.3.5. Other Applications
- 7.4. Market Analysis, Insights and Forecast - by End-User
- 7.4.1. Hospitals
- 7.4.2. Ambulatory Surgical Centers
- 7.4.3. Orthopedic and Trauma Centers
- 7.1. Market Analysis, Insights and Forecast - by Product Type
- 8. Asia Pacific External Fixators Industry Analysis, Insights and Forecast, 2019-2031
- 8.1. Market Analysis, Insights and Forecast - by Product Type
- 8.1.1. Manual Fixators
- 8.1.2. Computer-Aided Fixators
- 8.2. Market Analysis, Insights and Forecast - by Fixation Type
- 8.2.1. Unilateral and Bilateral
- 8.2.2. Circular
- 8.2.3. Hybrid
- 8.2.4. Others
- 8.3. Market Analysis, Insights and Forecast - by Application
- 8.3.1. Orthopedic Deformities
- 8.3.2. Fracture Fixation
- 8.3.3. Infected Fracture
- 8.3.4. Limb Correction
- 8.3.5. Other Applications
- 8.4. Market Analysis, Insights and Forecast - by End-User
- 8.4.1. Hospitals
- 8.4.2. Ambulatory Surgical Centers
- 8.4.3. Orthopedic and Trauma Centers
- 8.1. Market Analysis, Insights and Forecast - by Product Type
- 9. Middle East and Africa External Fixators Industry Analysis, Insights and Forecast, 2019-2031
- 9.1. Market Analysis, Insights and Forecast - by Product Type
- 9.1.1. Manual Fixators
- 9.1.2. Computer-Aided Fixators
- 9.2. Market Analysis, Insights and Forecast - by Fixation Type
- 9.2.1. Unilateral and Bilateral
- 9.2.2. Circular
- 9.2.3. Hybrid
- 9.2.4. Others
- 9.3. Market Analysis, Insights and Forecast - by Application
- 9.3.1. Orthopedic Deformities
- 9.3.2. Fracture Fixation
- 9.3.3. Infected Fracture
- 9.3.4. Limb Correction
- 9.3.5. Other Applications
- 9.4. Market Analysis, Insights and Forecast - by End-User
- 9.4.1. Hospitals
- 9.4.2. Ambulatory Surgical Centers
- 9.4.3. Orthopedic and Trauma Centers
- 9.1. Market Analysis, Insights and Forecast - by Product Type
- 10. South America External Fixators Industry Analysis, Insights and Forecast, 2019-2031
- 10.1. Market Analysis, Insights and Forecast - by Product Type
- 10.1.1. Manual Fixators
- 10.1.2. Computer-Aided Fixators
- 10.2. Market Analysis, Insights and Forecast - by Fixation Type
- 10.2.1. Unilateral and Bilateral
- 10.2.2. Circular
- 10.2.3. Hybrid
- 10.2.4. Others
- 10.3. Market Analysis, Insights and Forecast - by Application
- 10.3.1. Orthopedic Deformities
- 10.3.2. Fracture Fixation
- 10.3.3. Infected Fracture
- 10.3.4. Limb Correction
- 10.3.5. Other Applications
- 10.4. Market Analysis, Insights and Forecast - by End-User
- 10.4.1. Hospitals
- 10.4.2. Ambulatory Surgical Centers
- 10.4.3. Orthopedic and Trauma Centers
- 10.1. Market Analysis, Insights and Forecast - by Product Type
- 11. North America External Fixators Industry Analysis, Insights and Forecast, 2019-2031
- 11.1. Market Analysis, Insights and Forecast - By Country/Sub-region
- 11.1.1 United States
- 11.1.2 Canada
- 11.1.3 Mexico
- 12. Europe External Fixators Industry Analysis, Insights and Forecast, 2019-2031
- 12.1. Market Analysis, Insights and Forecast - By Country/Sub-region
- 12.1.1 Germany
- 12.1.2 United Kingdom
- 12.1.3 France
- 12.1.4 Italy
- 12.1.5 Spain
- 12.1.6 Rest of Europe
- 13. Asia Pacific External Fixators Industry Analysis, Insights and Forecast, 2019-2031
- 13.1. Market Analysis, Insights and Forecast - By Country/Sub-region
- 13.1.1 China
- 13.1.2 Japan
- 13.1.3 India
- 13.1.4 Australia
- 13.1.5 South Korea
- 13.1.6 Rest of Asia Pacific
- 14. Middle East and Africa External Fixators Industry Analysis, Insights and Forecast, 2019-2031
- 14.1. Market Analysis, Insights and Forecast - By Country/Sub-region
- 14.1.1 GCC
- 14.1.2 South Africa
- 14.1.3 Rest of Middle East and Africa
- 15. South America External Fixators Industry Analysis, Insights and Forecast, 2019-2031
- 15.1. Market Analysis, Insights and Forecast - By Country/Sub-region
- 15.1.1 Brazil
- 15.1.2 Argentina
- 15.1.3 Rest of South America
- 16. Competitive Analysis
- 16.1. Global Market Share Analysis 2024
- 16.2. Company Profiles
- 16.2.1 Smith & Nephew
- 16.2.1.1. Overview
- 16.2.1.2. Products
- 16.2.1.3. SWOT Analysis
- 16.2.1.4. Recent Developments
- 16.2.1.5. Financials (Based on Availability)
- 16.2.2 Orthofix Holdings Inc
- 16.2.2.1. Overview
- 16.2.2.2. Products
- 16.2.2.3. SWOT Analysis
- 16.2.2.4. Recent Developments
- 16.2.2.5. Financials (Based on Availability)
- 16.2.3 Zimmer Biomet
- 16.2.3.1. Overview
- 16.2.3.2. Products
- 16.2.3.3. SWOT Analysis
- 16.2.3.4. Recent Developments
- 16.2.3.5. Financials (Based on Availability)
- 16.2.4 Response Ortho LLC
- 16.2.4.1. Overview
- 16.2.4.2. Products
- 16.2.4.3. SWOT Analysis
- 16.2.4.4. Recent Developments
- 16.2.4.5. Financials (Based on Availability)
- 16.2.5 Stryker
- 16.2.5.1. Overview
- 16.2.5.2. Products
- 16.2.5.3. SWOT Analysis
- 16.2.5.4. Recent Developments
- 16.2.5.5. Financials (Based on Availability)
- 16.2.6 Ortho-SUV Ltd
- 16.2.6.1. Overview
- 16.2.6.2. Products
- 16.2.6.3. SWOT Analysis
- 16.2.6.4. Recent Developments
- 16.2.6.5. Financials (Based on Availability)
- 16.2.7 Johnson & Johnson (DePuy Synthes)
- 16.2.7.1. Overview
- 16.2.7.2. Products
- 16.2.7.3. SWOT Analysis
- 16.2.7.4. Recent Developments
- 16.2.7.5. Financials (Based on Availability)
- 16.2.1 Smith & Nephew
List of Figures
- Figure 1: Global External Fixators Industry Revenue Breakdown (Million, %) by Region 2024 & 2032
- Figure 2: North America External Fixators Industry Revenue (Million), by Country 2024 & 2032
- Figure 3: North America External Fixators Industry Revenue Share (%), by Country 2024 & 2032
- Figure 4: Europe External Fixators Industry Revenue (Million), by Country 2024 & 2032
- Figure 5: Europe External Fixators Industry Revenue Share (%), by Country 2024 & 2032
- Figure 6: Asia Pacific External Fixators Industry Revenue (Million), by Country 2024 & 2032
- Figure 7: Asia Pacific External Fixators Industry Revenue Share (%), by Country 2024 & 2032
- Figure 8: Middle East and Africa External Fixators Industry Revenue (Million), by Country 2024 & 2032
- Figure 9: Middle East and Africa External Fixators Industry Revenue Share (%), by Country 2024 & 2032
- Figure 10: South America External Fixators Industry Revenue (Million), by Country 2024 & 2032
- Figure 11: South America External Fixators Industry Revenue Share (%), by Country 2024 & 2032
- Figure 12: North America External Fixators Industry Revenue (Million), by Product Type 2024 & 2032
- Figure 13: North America External Fixators Industry Revenue Share (%), by Product Type 2024 & 2032
- Figure 14: North America External Fixators Industry Revenue (Million), by Fixation Type 2024 & 2032
- Figure 15: North America External Fixators Industry Revenue Share (%), by Fixation Type 2024 & 2032
- Figure 16: North America External Fixators Industry Revenue (Million), by Application 2024 & 2032
- Figure 17: North America External Fixators Industry Revenue Share (%), by Application 2024 & 2032
- Figure 18: North America External Fixators Industry Revenue (Million), by End-User 2024 & 2032
- Figure 19: North America External Fixators Industry Revenue Share (%), by End-User 2024 & 2032
- Figure 20: North America External Fixators Industry Revenue (Million), by Country 2024 & 2032
- Figure 21: North America External Fixators Industry Revenue Share (%), by Country 2024 & 2032
- Figure 22: Europe External Fixators Industry Revenue (Million), by Product Type 2024 & 2032
- Figure 23: Europe External Fixators Industry Revenue Share (%), by Product Type 2024 & 2032
- Figure 24: Europe External Fixators Industry Revenue (Million), by Fixation Type 2024 & 2032
- Figure 25: Europe External Fixators Industry Revenue Share (%), by Fixation Type 2024 & 2032
- Figure 26: Europe External Fixators Industry Revenue (Million), by Application 2024 & 2032
- Figure 27: Europe External Fixators Industry Revenue Share (%), by Application 2024 & 2032
- Figure 28: Europe External Fixators Industry Revenue (Million), by End-User 2024 & 2032
- Figure 29: Europe External Fixators Industry Revenue Share (%), by End-User 2024 & 2032
- Figure 30: Europe External Fixators Industry Revenue (Million), by Country 2024 & 2032
- Figure 31: Europe External Fixators Industry Revenue Share (%), by Country 2024 & 2032
- Figure 32: Asia Pacific External Fixators Industry Revenue (Million), by Product Type 2024 & 2032
- Figure 33: Asia Pacific External Fixators Industry Revenue Share (%), by Product Type 2024 & 2032
- Figure 34: Asia Pacific External Fixators Industry Revenue (Million), by Fixation Type 2024 & 2032
- Figure 35: Asia Pacific External Fixators Industry Revenue Share (%), by Fixation Type 2024 & 2032
- Figure 36: Asia Pacific External Fixators Industry Revenue (Million), by Application 2024 & 2032
- Figure 37: Asia Pacific External Fixators Industry Revenue Share (%), by Application 2024 & 2032
- Figure 38: Asia Pacific External Fixators Industry Revenue (Million), by End-User 2024 & 2032
- Figure 39: Asia Pacific External Fixators Industry Revenue Share (%), by End-User 2024 & 2032
- Figure 40: Asia Pacific External Fixators Industry Revenue (Million), by Country 2024 & 2032
- Figure 41: Asia Pacific External Fixators Industry Revenue Share (%), by Country 2024 & 2032
- Figure 42: Middle East and Africa External Fixators Industry Revenue (Million), by Product Type 2024 & 2032
- Figure 43: Middle East and Africa External Fixators Industry Revenue Share (%), by Product Type 2024 & 2032
- Figure 44: Middle East and Africa External Fixators Industry Revenue (Million), by Fixation Type 2024 & 2032
- Figure 45: Middle East and Africa External Fixators Industry Revenue Share (%), by Fixation Type 2024 & 2032
- Figure 46: Middle East and Africa External Fixators Industry Revenue (Million), by Application 2024 & 2032
- Figure 47: Middle East and Africa External Fixators Industry Revenue Share (%), by Application 2024 & 2032
- Figure 48: Middle East and Africa External Fixators Industry Revenue (Million), by End-User 2024 & 2032
- Figure 49: Middle East and Africa External Fixators Industry Revenue Share (%), by End-User 2024 & 2032
- Figure 50: Middle East and Africa External Fixators Industry Revenue (Million), by Country 2024 & 2032
- Figure 51: Middle East and Africa External Fixators Industry Revenue Share (%), by Country 2024 & 2032
- Figure 52: South America External Fixators Industry Revenue (Million), by Product Type 2024 & 2032
- Figure 53: South America External Fixators Industry Revenue Share (%), by Product Type 2024 & 2032
- Figure 54: South America External Fixators Industry Revenue (Million), by Fixation Type 2024 & 2032
- Figure 55: South America External Fixators Industry Revenue Share (%), by Fixation Type 2024 & 2032
- Figure 56: South America External Fixators Industry Revenue (Million), by Application 2024 & 2032
- Figure 57: South America External Fixators Industry Revenue Share (%), by Application 2024 & 2032
- Figure 58: South America External Fixators Industry Revenue (Million), by End-User 2024 & 2032
- Figure 59: South America External Fixators Industry Revenue Share (%), by End-User 2024 & 2032
- Figure 60: South America External Fixators Industry Revenue (Million), by Country 2024 & 2032
- Figure 61: South America External Fixators Industry Revenue Share (%), by Country 2024 & 2032
List of Tables
- Table 1: Global External Fixators Industry Revenue Million Forecast, by Region 2019 & 2032
- Table 2: Global External Fixators Industry Revenue Million Forecast, by Product Type 2019 & 2032
- Table 3: Global External Fixators Industry Revenue Million Forecast, by Fixation Type 2019 & 2032
- Table 4: Global External Fixators Industry Revenue Million Forecast, by Application 2019 & 2032
- Table 5: Global External Fixators Industry Revenue Million Forecast, by End-User 2019 & 2032
- Table 6: Global External Fixators Industry Revenue Million Forecast, by Region 2019 & 2032
- Table 7: Global External Fixators Industry Revenue Million Forecast, by Country 2019 & 2032
- Table 8: United States External Fixators Industry Revenue (Million) Forecast, by Application 2019 & 2032
- Table 9: Canada External Fixators Industry Revenue (Million) Forecast, by Application 2019 & 2032
- Table 10: Mexico External Fixators Industry Revenue (Million) Forecast, by Application 2019 & 2032
- Table 11: Global External Fixators Industry Revenue Million Forecast, by Country 2019 & 2032
- Table 12: Germany External Fixators Industry Revenue (Million) Forecast, by Application 2019 & 2032
- Table 13: United Kingdom External Fixators Industry Revenue (Million) Forecast, by Application 2019 & 2032
- Table 14: France External Fixators Industry Revenue (Million) Forecast, by Application 2019 & 2032
- Table 15: Italy External Fixators Industry Revenue (Million) Forecast, by Application 2019 & 2032
- Table 16: Spain External Fixators Industry Revenue (Million) Forecast, by Application 2019 & 2032
- Table 17: Rest of Europe External Fixators Industry Revenue (Million) Forecast, by Application 2019 & 2032
- Table 18: Global External Fixators Industry Revenue Million Forecast, by Country 2019 & 2032
- Table 19: China External Fixators Industry Revenue (Million) Forecast, by Application 2019 & 2032
- Table 20: Japan External Fixators Industry Revenue (Million) Forecast, by Application 2019 & 2032
- Table 21: India External Fixators Industry Revenue (Million) Forecast, by Application 2019 & 2032
- Table 22: Australia External Fixators Industry Revenue (Million) Forecast, by Application 2019 & 2032
- Table 23: South Korea External Fixators Industry Revenue (Million) Forecast, by Application 2019 & 2032
- Table 24: Rest of Asia Pacific External Fixators Industry Revenue (Million) Forecast, by Application 2019 & 2032
- Table 25: Global External Fixators Industry Revenue Million Forecast, by Country 2019 & 2032
- Table 26: GCC External Fixators Industry Revenue (Million) Forecast, by Application 2019 & 2032
- Table 27: South Africa External Fixators Industry Revenue (Million) Forecast, by Application 2019 & 2032
- Table 28: Rest of Middle East and Africa External Fixators Industry Revenue (Million) Forecast, by Application 2019 & 2032
- Table 29: Global External Fixators Industry Revenue Million Forecast, by Country 2019 & 2032
- Table 30: Brazil External Fixators Industry Revenue (Million) Forecast, by Application 2019 & 2032
- Table 31: Argentina External Fixators Industry Revenue (Million) Forecast, by Application 2019 & 2032
- Table 32: Rest of South America External Fixators Industry Revenue (Million) Forecast, by Application 2019 & 2032
- Table 33: Global External Fixators Industry Revenue Million Forecast, by Product Type 2019 & 2032
- Table 34: Global External Fixators Industry Revenue Million Forecast, by Fixation Type 2019 & 2032
- Table 35: Global External Fixators Industry Revenue Million Forecast, by Application 2019 & 2032
- Table 36: Global External Fixators Industry Revenue Million Forecast, by End-User 2019 & 2032
- Table 37: Global External Fixators Industry Revenue Million Forecast, by Country 2019 & 2032
- Table 38: United States External Fixators Industry Revenue (Million) Forecast, by Application 2019 & 2032
- Table 39: Canada External Fixators Industry Revenue (Million) Forecast, by Application 2019 & 2032
- Table 40: Mexico External Fixators Industry Revenue (Million) Forecast, by Application 2019 & 2032
- Table 41: Global External Fixators Industry Revenue Million Forecast, by Product Type 2019 & 2032
- Table 42: Global External Fixators Industry Revenue Million Forecast, by Fixation Type 2019 & 2032
- Table 43: Global External Fixators Industry Revenue Million Forecast, by Application 2019 & 2032
- Table 44: Global External Fixators Industry Revenue Million Forecast, by End-User 2019 & 2032
- Table 45: Global External Fixators Industry Revenue Million Forecast, by Country 2019 & 2032
- Table 46: Germany External Fixators Industry Revenue (Million) Forecast, by Application 2019 & 2032
- Table 47: United Kingdom External Fixators Industry Revenue (Million) Forecast, by Application 2019 & 2032
- Table 48: France External Fixators Industry Revenue (Million) Forecast, by Application 2019 & 2032
- Table 49: Italy External Fixators Industry Revenue (Million) Forecast, by Application 2019 & 2032
- Table 50: Spain External Fixators Industry Revenue (Million) Forecast, by Application 2019 & 2032
- Table 51: Rest of Europe External Fixators Industry Revenue (Million) Forecast, by Application 2019 & 2032
- Table 52: Global External Fixators Industry Revenue Million Forecast, by Product Type 2019 & 2032
- Table 53: Global External Fixators Industry Revenue Million Forecast, by Fixation Type 2019 & 2032
- Table 54: Global External Fixators Industry Revenue Million Forecast, by Application 2019 & 2032
- Table 55: Global External Fixators Industry Revenue Million Forecast, by End-User 2019 & 2032
- Table 56: Global External Fixators Industry Revenue Million Forecast, by Country 2019 & 2032
- Table 57: China External Fixators Industry Revenue (Million) Forecast, by Application 2019 & 2032
- Table 58: Japan External Fixators Industry Revenue (Million) Forecast, by Application 2019 & 2032
- Table 59: India External Fixators Industry Revenue (Million) Forecast, by Application 2019 & 2032
- Table 60: Australia External Fixators Industry Revenue (Million) Forecast, by Application 2019 & 2032
- Table 61: South Korea External Fixators Industry Revenue (Million) Forecast, by Application 2019 & 2032
- Table 62: Rest of Asia Pacific External Fixators Industry Revenue (Million) Forecast, by Application 2019 & 2032
- Table 63: Global External Fixators Industry Revenue Million Forecast, by Product Type 2019 & 2032
- Table 64: Global External Fixators Industry Revenue Million Forecast, by Fixation Type 2019 & 2032
- Table 65: Global External Fixators Industry Revenue Million Forecast, by Application 2019 & 2032
- Table 66: Global External Fixators Industry Revenue Million Forecast, by End-User 2019 & 2032
- Table 67: Global External Fixators Industry Revenue Million Forecast, by Country 2019 & 2032
- Table 68: GCC External Fixators Industry Revenue (Million) Forecast, by Application 2019 & 2032
- Table 69: South Africa External Fixators Industry Revenue (Million) Forecast, by Application 2019 & 2032
- Table 70: Rest of Middle East and Africa External Fixators Industry Revenue (Million) Forecast, by Application 2019 & 2032
- Table 71: Global External Fixators Industry Revenue Million Forecast, by Product Type 2019 & 2032
- Table 72: Global External Fixators Industry Revenue Million Forecast, by Fixation Type 2019 & 2032
- Table 73: Global External Fixators Industry Revenue Million Forecast, by Application 2019 & 2032
- Table 74: Global External Fixators Industry Revenue Million Forecast, by End-User 2019 & 2032
- Table 75: Global External Fixators Industry Revenue Million Forecast, by Country 2019 & 2032
- Table 76: Brazil External Fixators Industry Revenue (Million) Forecast, by Application 2019 & 2032
- Table 77: Argentina External Fixators Industry Revenue (Million) Forecast, by Application 2019 & 2032
- Table 78: Rest of South America External Fixators Industry Revenue (Million) Forecast, by Application 2019 & 2032
Frequently Asked Questions
1. What is the projected Compound Annual Growth Rate (CAGR) of the External Fixators Industry?
The projected CAGR is approximately 5.40%.
2. Which companies are prominent players in the External Fixators Industry?
Key companies in the market include Smith & Nephew, Orthofix Holdings Inc, Zimmer Biomet, Response Ortho LLC, Stryker, Ortho-SUV Ltd, Johnson & Johnson (DePuy Synthes).
3. What are the main segments of the External Fixators Industry?
The market segments include Product Type, Fixation Type, Application, End-User.
4. Can you provide details about the market size?
The market size is estimated to be USD XX Million as of 2022.
5. What are some drivers contributing to market growth?
Surging Road Accidents. Sports-Related and Other Injuries; Rising Preference for Minimally Invasive Surgeries.
6. What are the notable trends driving market growth?
Fracture Fixation is Expected to Witness Significant Growth over the Forecast Period.
7. Are there any restraints impacting market growth?
Availability of Alternative Treatments in line with the Shortage of Skilled Orthopaedic Surgeons.
8. Can you provide examples of recent developments in the market?
In March 2022, Orthofix announced that it received United States Food and Drug Administration (USFDA) 510(k) clearance for its TrueLok Evo Ring Fixation system. TrueLok is an advanced external fixation system made of carbon fiber to create a lightweight device for patient comfort and it is interred for fixation of open and closed fractures, and correction of bony or soft tissue defects or deformities in adults and pediatric patients.
9. What pricing options are available for accessing the report?
Pricing options include single-user, multi-user, and enterprise licenses priced at USD 4750, USD 5250, and USD 8750 respectively.
10. Is the market size provided in terms of value or volume?
The market size is provided in terms of value, measured in Million.
11. Are there any specific market keywords associated with the report?
Yes, the market keyword associated with the report is "External Fixators Industry," which aids in identifying and referencing the specific market segment covered.
12. How do I determine which pricing option suits my needs best?
The pricing options vary based on user requirements and access needs. Individual users may opt for single-user licenses, while businesses requiring broader access may choose multi-user or enterprise licenses for cost-effective access to the report.
13. Are there any additional resources or data provided in the External Fixators Industry report?
While the report offers comprehensive insights, it's advisable to review the specific contents or supplementary materials provided to ascertain if additional resources or data are available.
14. How can I stay updated on further developments or reports in the External Fixators Industry?
To stay informed about further developments, trends, and reports in the External Fixators Industry, consider subscribing to industry newsletters, following relevant companies and organizations, or regularly checking reputable industry news sources and publications.
Methodology
Step 1 - Identification of Relevant Samples Size from Population Database


Step 2 - Approaches for Defining Global Market Size (Value, Volume* & Price*)

Note*: In applicable scenarios
Step 3 - Data Sources
Primary Research
- Web Analytics
- Survey Reports
- Research Institute
- Latest Research Reports
- Opinion Leaders
Secondary Research
- Annual Reports
- White Paper
- Latest Press Release
- Industry Association
- Paid Database
- Investor Presentations

Step 4 - Data Triangulation
Involves using different sources of information in order to increase the validity of a study
These sources are likely to be stakeholders in a program - participants, other researchers, program staff, other community members, and so on.
Then we put all data in single framework & apply various statistical tools to find out the dynamic on the market.
During the analysis stage, feedback from the stakeholder groups would be compared to determine areas of agreement as well as areas of divergence


