


Key Insights
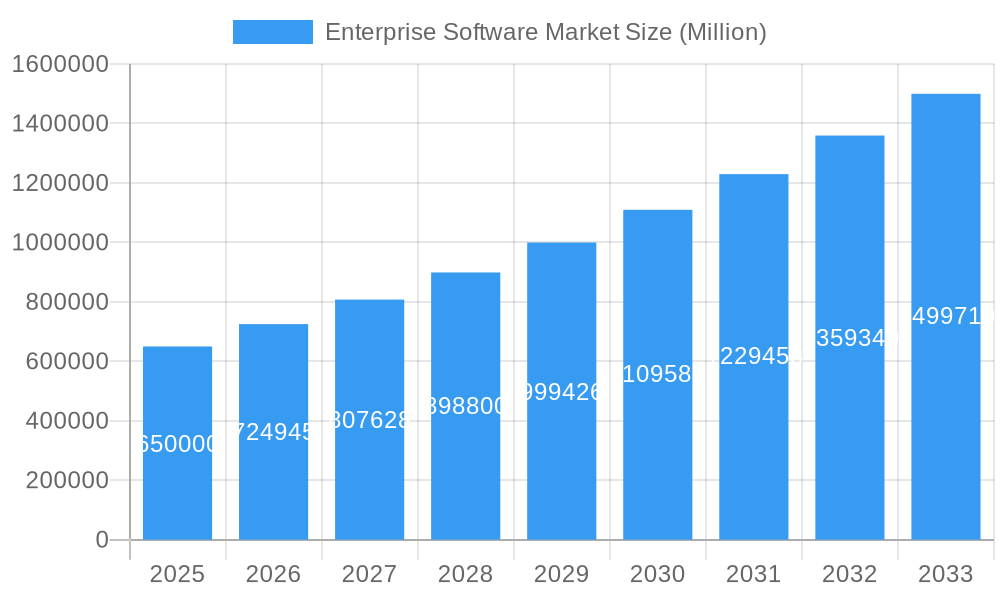
The global enterprise software market, valued at $0.65 trillion in 2025, is projected to experience robust growth, exhibiting a Compound Annual Growth Rate (CAGR) of 11.23% from 2025 to 2033. This expansion is fueled by several key drivers. The increasing adoption of cloud-based solutions offers scalability, cost-effectiveness, and enhanced accessibility, driving significant market penetration. Furthermore, the growing need for data-driven decision-making is boosting demand for Business Intelligence (BI) and related software. The digital transformation initiatives across various industries, including BFSI (Banking, Financial Services, and Insurance), healthcare, and manufacturing, are further accelerating the market's growth. Increased automation needs, improved supply chain management, and the rising adoption of advanced technologies like AI and machine learning within enterprise software are also contributing factors. While data security concerns and the complexities associated with integrating new software systems present some restraints, the overall market outlook remains positive.
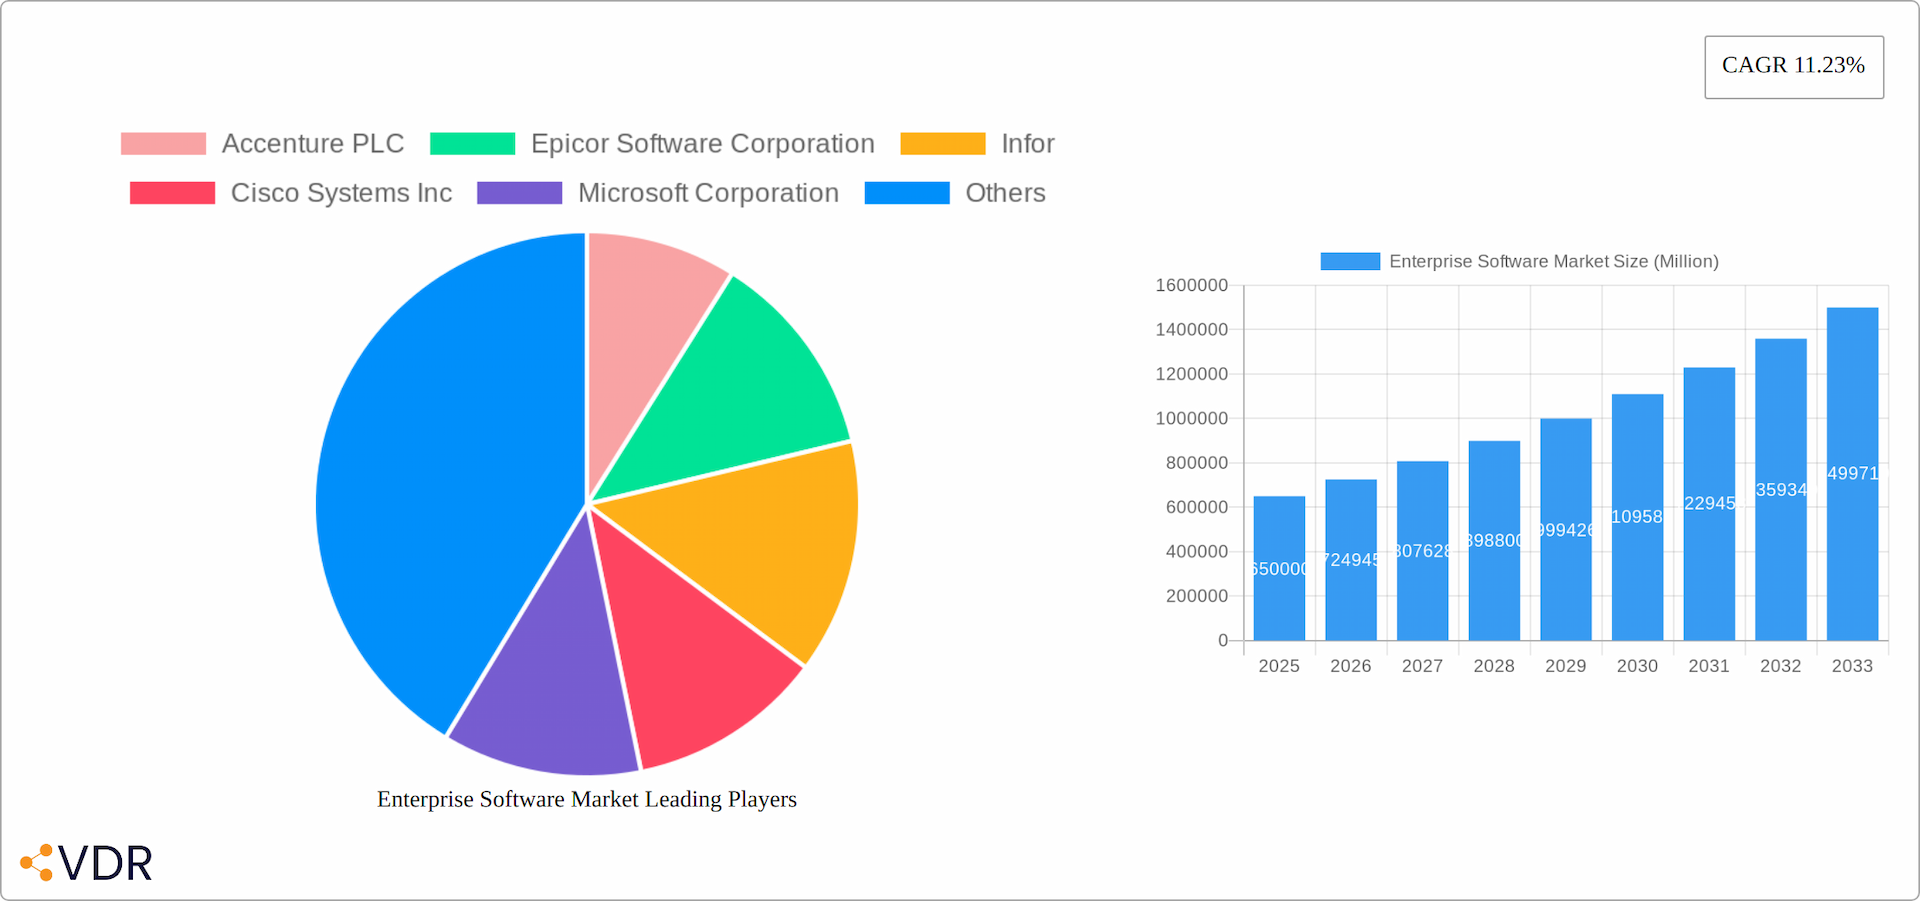
Enterprise Software Market Market Size (In Billion)

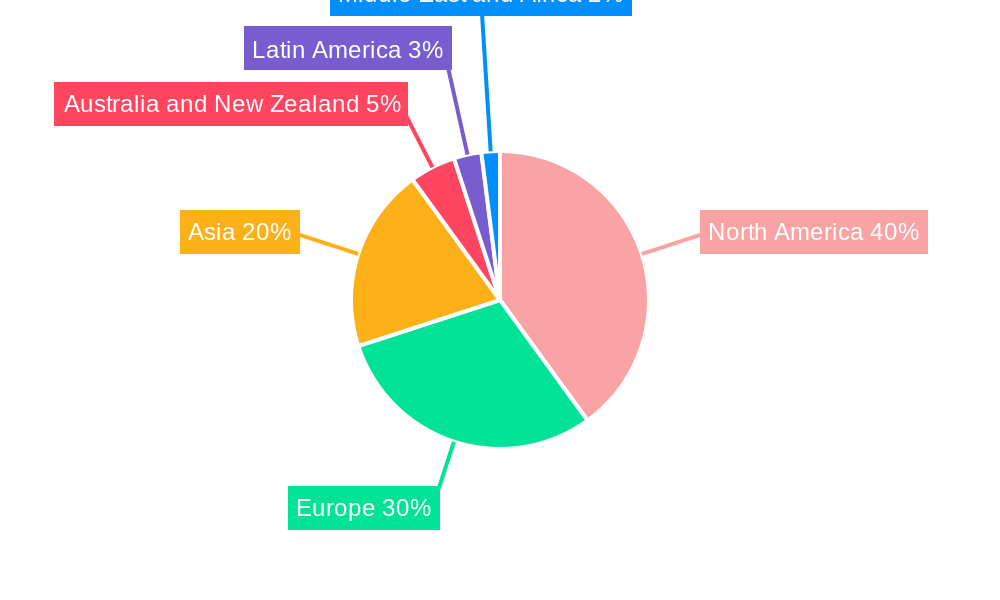
The market segmentation reveals a diverse landscape. Cloud deployment models are gaining traction over on-premise solutions due to their flexibility and reduced infrastructure costs. Among software types, ERP (Enterprise Resource Planning), CRM (Customer Relationship Management), and supply chain management software are experiencing high demand. North America currently holds a significant market share, but regions like Asia and Europe are witnessing rapid growth, driven by increasing digitalization and technological advancements. Major players like SAP, Oracle, Microsoft, and others are actively competing through innovation and strategic acquisitions, shaping the market's competitive dynamics. The long-term forecast indicates continued expansion, with the market poised to surpass $1.5 trillion by 2033, highlighting the immense growth potential of this dynamic sector.
Enterprise Software Market Company Market Share
Enterprise Software Market: A Comprehensive Analysis (2019-2033)
This in-depth report provides a comprehensive analysis of the Enterprise Software Market, encompassing market dynamics, growth trends, regional dominance, product landscape, and key players. The study period spans from 2019 to 2033, with 2025 serving as the base and estimated year. The report forecasts market performance from 2025 to 2033, building upon historical data from 2019 to 2024. This report is invaluable for industry professionals, investors, and strategists seeking to navigate this rapidly evolving market. The market size in 2025 is estimated at xx Million.
Enterprise Software Market Dynamics & Structure
The Enterprise Software Market is characterized by a moderately concentrated landscape with several major players holding significant market share. The market is driven by continuous technological innovation, particularly in areas like cloud computing, artificial intelligence (AI), and the Internet of Things (IoT). Regulatory frameworks, such as data privacy regulations (GDPR, CCPA), significantly influence market dynamics. Competitive product substitutes, including open-source solutions and niche specialized software, exert pressure on established players. End-user demographics are shifting towards increased adoption of software-as-a-service (SaaS) models, particularly among small and medium-sized enterprises (SMEs). Mergers and acquisitions (M&A) activity remains significant, with larger players consolidating their market position and expanding their product portfolios.
- Market Concentration: The top 5 players hold approximately xx% of the market share in 2025.
- Technological Innovation: AI-powered solutions and cloud-native architectures are key innovation drivers.
- Regulatory Landscape: Data privacy regulations are shaping product development and deployment strategies.
- M&A Activity: An average of xx M&A deals were recorded annually during the historical period (2019-2024).
- Innovation Barriers: High development costs and integration complexities hinder rapid innovation for niche solutions.
Enterprise Software Market Growth Trends & Insights
The Enterprise Software Market has exhibited strong growth over the historical period (2019-2024), fueled by increasing digital transformation initiatives across various industries. The market is expected to continue its growth trajectory during the forecast period (2025-2033), driven by factors such as rising adoption of cloud-based solutions, increasing demand for data analytics and business intelligence, and the growing need for improved operational efficiency. The market is witnessing a significant shift towards cloud deployment models, which offer scalability, flexibility, and cost-effectiveness. Consumer behavior shifts include a preference for user-friendly interfaces, integrated solutions, and subscription-based models. The Compound Annual Growth Rate (CAGR) is projected to be xx% from 2025 to 2033, with market penetration expected to reach xx% by 2033.
Dominant Regions, Countries, or Segments in Enterprise Software Market
The enterprise software market is a global landscape, with North America currently holding the largest market share due to its high technology adoption rates and advanced digital infrastructure. However, the Asia-Pacific region is poised for the most rapid growth in the coming years, fueled by booming economies and accelerating digital transformation initiatives. This growth is particularly evident in the increasing adoption of cloud-based solutions across various industries. European markets also represent a substantial and steadily growing segment, driven by increasing regulatory compliance demands and the adoption of innovative technologies.
By Software Type:
- ERP Software: Remains a cornerstone of enterprise software, maintaining a significant market share due to its critical role in streamlining business operations and integrating various functionalities. The market for ERP software is expected to reach [Insert Updated 2025 Market Value] in 2025, reflecting continued strong demand for integrated solutions.
- CRM Software: Experiencing robust growth driven by the increasing need for enhanced customer relationship management and personalized customer experiences. The focus on data-driven insights and improved customer engagement is driving significant investment in this segment. The market is projected to reach [Insert Updated 2025 Market Value] in 2025.
- BI Software: Continues its rapid expansion, fueled by the ever-growing demand for data-driven decision-making and the ability to extract actionable insights from complex data sets. The rise of AI and machine learning is further accelerating growth in this area. The market is expected to reach [Insert Updated 2025 Market Value] in 2025.
- Supply Chain Software: Demonstrates steady growth, driven by the ongoing focus on supply chain optimization, resilience, and enhanced visibility. The need to mitigate risks and improve efficiency across the entire supply chain is propelling demand for sophisticated supply chain management solutions. The market is projected to reach [Insert Updated 2025 Market Value] in 2025.
By Deployment:
- Cloud: Continues its dominance, driven by its inherent scalability, flexibility, cost-effectiveness, and ease of access. Businesses are increasingly adopting cloud-based solutions to reduce infrastructure costs and improve agility. The cloud segment is projected to reach [Insert Updated 2025 Market Value] in 2025.
- On-Premise: While still holding a notable share, on-premise deployments are gradually declining as businesses transition towards cloud-based solutions. However, certain industries with stringent data security regulations may continue to favor on-premise solutions. The market is expected to reach [Insert Updated 2025 Market Value] in 2025.
By End-User Vertical:
- BFSI (Banking, Financial Services, and Insurance): Remains a major driver of growth due to the stringent regulatory requirements and the need for secure, efficient, and compliant operations. The sector's investment in advanced technologies is fueling the growth of enterprise software adoption. The market is projected to reach [Insert Updated 2025 Market Value] in 2025.
- Healthcare: Experiences rapid growth due to the increasing adoption of electronic health records (EHRs), telehealth solutions, and the need for improved patient care and operational efficiency. This sector is expected to continue its significant investment in enterprise software solutions. The market is expected to reach [Insert Updated 2025 Market Value] in 2025.
- Manufacturing: Represents a significant segment, driven by the relentless pursuit of improved production efficiency, supply chain optimization, and automation across the manufacturing lifecycle. The adoption of Industry 4.0 technologies is pushing demand for specialized enterprise software solutions. The market is projected to reach [Insert Updated 2025 Market Value] in 2025.
- Retail: The retail sector is also a significant contributor, driven by the need for enhanced customer experience management, efficient inventory control, and supply chain optimization. The increasing use of omnichannel strategies fuels demand for advanced enterprise software solutions. The market is projected to reach [Insert Updated 2025 Market Value] in 2025.
Enterprise Software Market Product Landscape
The enterprise software market offers a diverse range of solutions, including ERP, CRM, BI, and supply chain management software. Recent innovations focus on AI-powered analytics, cloud-native architectures, and enhanced user interfaces. Key selling propositions include improved operational efficiency, enhanced decision-making capabilities, and cost optimization. Technological advancements such as automation, machine learning, and blockchain are transforming the functionality and capabilities of enterprise software, providing increased agility and intelligence.
Key Drivers, Barriers & Challenges in Enterprise Software Market
Key Drivers:
- Increasing digital transformation initiatives across industries.
- Growing demand for data analytics and business intelligence.
- The need for improved operational efficiency and cost optimization.
- Expansion of cloud computing and related services.
Key Challenges:
- High implementation costs and complexities, particularly for large-scale deployments.
- Data security and privacy concerns.
- The need for skilled IT professionals to manage and maintain enterprise software systems.
- Intense competition and the emergence of disruptive technologies.
Emerging Opportunities in Enterprise Software Market
- Growing adoption of AI and machine learning in enterprise software.
- Increasing demand for industry-specific solutions.
- Expansion of the Internet of Things (IoT) and its integration with enterprise software.
- Opportunities in emerging markets with high growth potential.
Growth Accelerators in the Enterprise Software Market Industry
Long-term growth is fueled by continuous technological innovation, strategic partnerships, and expansion into new markets. The increasing adoption of cloud-based solutions and the emergence of new technologies such as AI and blockchain will further accelerate market growth. Strategic acquisitions and partnerships will play a significant role in shaping the competitive landscape and driving innovation. Expansion into underserved markets and the development of industry-specific solutions will unlock new growth avenues.
Key Players Shaping the Enterprise Software Market Market
Notable Milestones in Enterprise Software Market Sector
- March 2023: Cisco Systems Inc. and Telenor Group announced an expanded partnership focusing on ESG initiatives, as-a-service solutions, and cybersecurity. This collaboration signifies a significant push towards cloud-based security offerings.
- March 2023: Epicor Software Corporation reported strong growth in Asian cloud adoption, indicating significant market potential in the region. Their strategic investments in various Asian markets signal a confident expansion strategy.
In-Depth Enterprise Software Market Market Outlook
The Enterprise Software Market is poised for sustained growth driven by ongoing digital transformation, increasing demand for cloud-based solutions, and the continuous innovation of AI and machine learning technologies. Strategic partnerships and M&A activity will further consolidate market leadership and drive innovation. The market presents significant opportunities for companies that can effectively address the challenges of data security, integration complexities, and the need for skilled IT professionals. The future outlook is positive, with substantial potential for market expansion across various regions and industries.
Enterprise Software Market Segmentation
-
1. Software Type
- 1.1. ERP Software
- 1.2. CRM Software
- 1.3. BI Software
- 1.4. Supply chain Software
-
2. Deployment
- 2.1. Cloud
- 2.2. On-Premise
-
3. End-User Vertical
- 3.1. BFSI
- 3.2. Healthcare
- 3.3. Public & Institutions
- 3.4. Retail
- 3.5. Transportation
- 3.6. Manufacturing
- 3.7. Other End-User Verticals (Telecom, Defense, etc.)
Enterprise Software Market Segmentation By Geography
- 1. North America
- 2. Europe
- 3. Asia
- 4. Australia and New Zealand
- 5. Latin America
- 6. Middle East and Africa
Enterprise Software Market Regional Market Share
Geographic Coverage of Enterprise Software Market
Enterprise Software Market REPORT HIGHLIGHTS
| Aspects | Details |
|---|---|
| Study Period | 2020-2034 |
| Base Year | 2025 |
| Estimated Year | 2026 |
| Forecast Period | 2026-2034 |
| Historical Period | 2020-2025 |
| Growth Rate | CAGR of 11.23% from 2020-2034 |
| Segmentation |
|
Table of Contents
- 1. Introduction
- 1.1. Research Scope
- 1.2. Market Segmentation
- 1.3. Research Methodology
- 1.4. Definitions and Assumptions
- 2. Executive Summary
- 2.1. Introduction
- 3. Market Dynamics
- 3.1. Introduction
- 3.2. Market Drivers
- 3.2.1. Cloud & Networking-Based Advancements; Growing Demand from SMEs
- 3.3. Market Restrains
- 3.3.1. Security Vulnerability of Transaction Across the Insurance Platform using Blockchain Technology; Lack of Awareness about Blockchain in the Industry Professionals
- 3.4. Market Trends
- 3.4.1. Cloud is Expected to Hold Significant Share
- 4. Market Factor Analysis
- 4.1. Porters Five Forces
- 4.2. Supply/Value Chain
- 4.3. PESTEL analysis
- 4.4. Market Entropy
- 4.5. Patent/Trademark Analysis
- 5. Global Enterprise Software Market Analysis, Insights and Forecast, 2020-2032
- 5.1. Market Analysis, Insights and Forecast - by Software Type
- 5.1.1. ERP Software
- 5.1.2. CRM Software
- 5.1.3. BI Software
- 5.1.4. Supply chain Software
- 5.2. Market Analysis, Insights and Forecast - by Deployment
- 5.2.1. Cloud
- 5.2.2. On-Premise
- 5.3. Market Analysis, Insights and Forecast - by End-User Vertical
- 5.3.1. BFSI
- 5.3.2. Healthcare
- 5.3.3. Public & Institutions
- 5.3.4. Retail
- 5.3.5. Transportation
- 5.3.6. Manufacturing
- 5.3.7. Other End-User Verticals (Telecom, Defense, etc.)
- 5.4. Market Analysis, Insights and Forecast - by Region
- 5.4.1. North America
- 5.4.2. Europe
- 5.4.3. Asia
- 5.4.4. Australia and New Zealand
- 5.4.5. Latin America
- 5.4.6. Middle East and Africa
- 5.1. Market Analysis, Insights and Forecast - by Software Type
- 6. North America Enterprise Software Market Analysis, Insights and Forecast, 2020-2032
- 6.1. Market Analysis, Insights and Forecast - by Software Type
- 6.1.1. ERP Software
- 6.1.2. CRM Software
- 6.1.3. BI Software
- 6.1.4. Supply chain Software
- 6.2. Market Analysis, Insights and Forecast - by Deployment
- 6.2.1. Cloud
- 6.2.2. On-Premise
- 6.3. Market Analysis, Insights and Forecast - by End-User Vertical
- 6.3.1. BFSI
- 6.3.2. Healthcare
- 6.3.3. Public & Institutions
- 6.3.4. Retail
- 6.3.5. Transportation
- 6.3.6. Manufacturing
- 6.3.7. Other End-User Verticals (Telecom, Defense, etc.)
- 6.1. Market Analysis, Insights and Forecast - by Software Type
- 7. Europe Enterprise Software Market Analysis, Insights and Forecast, 2020-2032
- 7.1. Market Analysis, Insights and Forecast - by Software Type
- 7.1.1. ERP Software
- 7.1.2. CRM Software
- 7.1.3. BI Software
- 7.1.4. Supply chain Software
- 7.2. Market Analysis, Insights and Forecast - by Deployment
- 7.2.1. Cloud
- 7.2.2. On-Premise
- 7.3. Market Analysis, Insights and Forecast - by End-User Vertical
- 7.3.1. BFSI
- 7.3.2. Healthcare
- 7.3.3. Public & Institutions
- 7.3.4. Retail
- 7.3.5. Transportation
- 7.3.6. Manufacturing
- 7.3.7. Other End-User Verticals (Telecom, Defense, etc.)
- 7.1. Market Analysis, Insights and Forecast - by Software Type
- 8. Asia Enterprise Software Market Analysis, Insights and Forecast, 2020-2032
- 8.1. Market Analysis, Insights and Forecast - by Software Type
- 8.1.1. ERP Software
- 8.1.2. CRM Software
- 8.1.3. BI Software
- 8.1.4. Supply chain Software
- 8.2. Market Analysis, Insights and Forecast - by Deployment
- 8.2.1. Cloud
- 8.2.2. On-Premise
- 8.3. Market Analysis, Insights and Forecast - by End-User Vertical
- 8.3.1. BFSI
- 8.3.2. Healthcare
- 8.3.3. Public & Institutions
- 8.3.4. Retail
- 8.3.5. Transportation
- 8.3.6. Manufacturing
- 8.3.7. Other End-User Verticals (Telecom, Defense, etc.)
- 8.1. Market Analysis, Insights and Forecast - by Software Type
- 9. Australia and New Zealand Enterprise Software Market Analysis, Insights and Forecast, 2020-2032
- 9.1. Market Analysis, Insights and Forecast - by Software Type
- 9.1.1. ERP Software
- 9.1.2. CRM Software
- 9.1.3. BI Software
- 9.1.4. Supply chain Software
- 9.2. Market Analysis, Insights and Forecast - by Deployment
- 9.2.1. Cloud
- 9.2.2. On-Premise
- 9.3. Market Analysis, Insights and Forecast - by End-User Vertical
- 9.3.1. BFSI
- 9.3.2. Healthcare
- 9.3.3. Public & Institutions
- 9.3.4. Retail
- 9.3.5. Transportation
- 9.3.6. Manufacturing
- 9.3.7. Other End-User Verticals (Telecom, Defense, etc.)
- 9.1. Market Analysis, Insights and Forecast - by Software Type
- 10. Latin America Enterprise Software Market Analysis, Insights and Forecast, 2020-2032
- 10.1. Market Analysis, Insights and Forecast - by Software Type
- 10.1.1. ERP Software
- 10.1.2. CRM Software
- 10.1.3. BI Software
- 10.1.4. Supply chain Software
- 10.2. Market Analysis, Insights and Forecast - by Deployment
- 10.2.1. Cloud
- 10.2.2. On-Premise
- 10.3. Market Analysis, Insights and Forecast - by End-User Vertical
- 10.3.1. BFSI
- 10.3.2. Healthcare
- 10.3.3. Public & Institutions
- 10.3.4. Retail
- 10.3.5. Transportation
- 10.3.6. Manufacturing
- 10.3.7. Other End-User Verticals (Telecom, Defense, etc.)
- 10.1. Market Analysis, Insights and Forecast - by Software Type
- 11. Middle East and Africa Enterprise Software Market Analysis, Insights and Forecast, 2020-2032
- 11.1. Market Analysis, Insights and Forecast - by Software Type
- 11.1.1. ERP Software
- 11.1.2. CRM Software
- 11.1.3. BI Software
- 11.1.4. Supply chain Software
- 11.2. Market Analysis, Insights and Forecast - by Deployment
- 11.2.1. Cloud
- 11.2.2. On-Premise
- 11.3. Market Analysis, Insights and Forecast - by End-User Vertical
- 11.3.1. BFSI
- 11.3.2. Healthcare
- 11.3.3. Public & Institutions
- 11.3.4. Retail
- 11.3.5. Transportation
- 11.3.6. Manufacturing
- 11.3.7. Other End-User Verticals (Telecom, Defense, etc.)
- 11.1. Market Analysis, Insights and Forecast - by Software Type
- 12. Competitive Analysis
- 12.1. Global Market Share Analysis 2025
- 12.2. Company Profiles
- 12.2.1 Accenture PLC
- 12.2.1.1. Overview
- 12.2.1.2. Products
- 12.2.1.3. SWOT Analysis
- 12.2.1.4. Recent Developments
- 12.2.1.5. Financials (Based on Availability)
- 12.2.2 Epicor Software Corporation
- 12.2.2.1. Overview
- 12.2.2.2. Products
- 12.2.2.3. SWOT Analysis
- 12.2.2.4. Recent Developments
- 12.2.2.5. Financials (Based on Availability)
- 12.2.3 Infor
- 12.2.3.1. Overview
- 12.2.3.2. Products
- 12.2.3.3. SWOT Analysis
- 12.2.3.4. Recent Developments
- 12.2.3.5. Financials (Based on Availability)
- 12.2.4 Cisco Systems Inc
- 12.2.4.1. Overview
- 12.2.4.2. Products
- 12.2.4.3. SWOT Analysis
- 12.2.4.4. Recent Developments
- 12.2.4.5. Financials (Based on Availability)
- 12.2.5 Microsoft Corporation
- 12.2.5.1. Overview
- 12.2.5.2. Products
- 12.2.5.3. SWOT Analysis
- 12.2.5.4. Recent Developments
- 12.2.5.5. Financials (Based on Availability)
- 12.2.6 International Business Machines Corporation
- 12.2.6.1. Overview
- 12.2.6.2. Products
- 12.2.6.3. SWOT Analysis
- 12.2.6.4. Recent Developments
- 12.2.6.5. Financials (Based on Availability)
- 12.2.7 NetSuite Inc
- 12.2.7.1. Overview
- 12.2.7.2. Products
- 12.2.7.3. SWOT Analysis
- 12.2.7.4. Recent Developments
- 12.2.7.5. Financials (Based on Availability)
- 12.2.8 Oracle Corporation
- 12.2.8.1. Overview
- 12.2.8.2. Products
- 12.2.8.3. SWOT Analysis
- 12.2.8.4. Recent Developments
- 12.2.8.5. Financials (Based on Availability)
- 12.2.9 Deltek Inc *List Not Exhaustive
- 12.2.9.1. Overview
- 12.2.9.2. Products
- 12.2.9.3. SWOT Analysis
- 12.2.9.4. Recent Developments
- 12.2.9.5. Financials (Based on Availability)
- 12.2.10 SAP SE
- 12.2.10.1. Overview
- 12.2.10.2. Products
- 12.2.10.3. SWOT Analysis
- 12.2.10.4. Recent Developments
- 12.2.10.5. Financials (Based on Availability)
- 12.2.1 Accenture PLC
List of Figures
- Figure 1: Global Enterprise Software Market Revenue Breakdown (Million, %) by Region 2025 & 2033
- Figure 2: North America Enterprise Software Market Revenue (Million), by Software Type 2025 & 2033
- Figure 3: North America Enterprise Software Market Revenue Share (%), by Software Type 2025 & 2033
- Figure 4: North America Enterprise Software Market Revenue (Million), by Deployment 2025 & 2033
- Figure 5: North America Enterprise Software Market Revenue Share (%), by Deployment 2025 & 2033
- Figure 6: North America Enterprise Software Market Revenue (Million), by End-User Vertical 2025 & 2033
- Figure 7: North America Enterprise Software Market Revenue Share (%), by End-User Vertical 2025 & 2033
- Figure 8: North America Enterprise Software Market Revenue (Million), by Country 2025 & 2033
- Figure 9: North America Enterprise Software Market Revenue Share (%), by Country 2025 & 2033
- Figure 10: Europe Enterprise Software Market Revenue (Million), by Software Type 2025 & 2033
- Figure 11: Europe Enterprise Software Market Revenue Share (%), by Software Type 2025 & 2033
- Figure 12: Europe Enterprise Software Market Revenue (Million), by Deployment 2025 & 2033
- Figure 13: Europe Enterprise Software Market Revenue Share (%), by Deployment 2025 & 2033
- Figure 14: Europe Enterprise Software Market Revenue (Million), by End-User Vertical 2025 & 2033
- Figure 15: Europe Enterprise Software Market Revenue Share (%), by End-User Vertical 2025 & 2033
- Figure 16: Europe Enterprise Software Market Revenue (Million), by Country 2025 & 2033
- Figure 17: Europe Enterprise Software Market Revenue Share (%), by Country 2025 & 2033
- Figure 18: Asia Enterprise Software Market Revenue (Million), by Software Type 2025 & 2033
- Figure 19: Asia Enterprise Software Market Revenue Share (%), by Software Type 2025 & 2033
- Figure 20: Asia Enterprise Software Market Revenue (Million), by Deployment 2025 & 2033
- Figure 21: Asia Enterprise Software Market Revenue Share (%), by Deployment 2025 & 2033
- Figure 22: Asia Enterprise Software Market Revenue (Million), by End-User Vertical 2025 & 2033
- Figure 23: Asia Enterprise Software Market Revenue Share (%), by End-User Vertical 2025 & 2033
- Figure 24: Asia Enterprise Software Market Revenue (Million), by Country 2025 & 2033
- Figure 25: Asia Enterprise Software Market Revenue Share (%), by Country 2025 & 2033
- Figure 26: Australia and New Zealand Enterprise Software Market Revenue (Million), by Software Type 2025 & 2033
- Figure 27: Australia and New Zealand Enterprise Software Market Revenue Share (%), by Software Type 2025 & 2033
- Figure 28: Australia and New Zealand Enterprise Software Market Revenue (Million), by Deployment 2025 & 2033
- Figure 29: Australia and New Zealand Enterprise Software Market Revenue Share (%), by Deployment 2025 & 2033
- Figure 30: Australia and New Zealand Enterprise Software Market Revenue (Million), by End-User Vertical 2025 & 2033
- Figure 31: Australia and New Zealand Enterprise Software Market Revenue Share (%), by End-User Vertical 2025 & 2033
- Figure 32: Australia and New Zealand Enterprise Software Market Revenue (Million), by Country 2025 & 2033
- Figure 33: Australia and New Zealand Enterprise Software Market Revenue Share (%), by Country 2025 & 2033
- Figure 34: Latin America Enterprise Software Market Revenue (Million), by Software Type 2025 & 2033
- Figure 35: Latin America Enterprise Software Market Revenue Share (%), by Software Type 2025 & 2033
- Figure 36: Latin America Enterprise Software Market Revenue (Million), by Deployment 2025 & 2033
- Figure 37: Latin America Enterprise Software Market Revenue Share (%), by Deployment 2025 & 2033
- Figure 38: Latin America Enterprise Software Market Revenue (Million), by End-User Vertical 2025 & 2033
- Figure 39: Latin America Enterprise Software Market Revenue Share (%), by End-User Vertical 2025 & 2033
- Figure 40: Latin America Enterprise Software Market Revenue (Million), by Country 2025 & 2033
- Figure 41: Latin America Enterprise Software Market Revenue Share (%), by Country 2025 & 2033
- Figure 42: Middle East and Africa Enterprise Software Market Revenue (Million), by Software Type 2025 & 2033
- Figure 43: Middle East and Africa Enterprise Software Market Revenue Share (%), by Software Type 2025 & 2033
- Figure 44: Middle East and Africa Enterprise Software Market Revenue (Million), by Deployment 2025 & 2033
- Figure 45: Middle East and Africa Enterprise Software Market Revenue Share (%), by Deployment 2025 & 2033
- Figure 46: Middle East and Africa Enterprise Software Market Revenue (Million), by End-User Vertical 2025 & 2033
- Figure 47: Middle East and Africa Enterprise Software Market Revenue Share (%), by End-User Vertical 2025 & 2033
- Figure 48: Middle East and Africa Enterprise Software Market Revenue (Million), by Country 2025 & 2033
- Figure 49: Middle East and Africa Enterprise Software Market Revenue Share (%), by Country 2025 & 2033
List of Tables
- Table 1: Global Enterprise Software Market Revenue Million Forecast, by Software Type 2020 & 2033
- Table 2: Global Enterprise Software Market Revenue Million Forecast, by Deployment 2020 & 2033
- Table 3: Global Enterprise Software Market Revenue Million Forecast, by End-User Vertical 2020 & 2033
- Table 4: Global Enterprise Software Market Revenue Million Forecast, by Region 2020 & 2033
- Table 5: Global Enterprise Software Market Revenue Million Forecast, by Software Type 2020 & 2033
- Table 6: Global Enterprise Software Market Revenue Million Forecast, by Deployment 2020 & 2033
- Table 7: Global Enterprise Software Market Revenue Million Forecast, by End-User Vertical 2020 & 2033
- Table 8: Global Enterprise Software Market Revenue Million Forecast, by Country 2020 & 2033
- Table 9: Global Enterprise Software Market Revenue Million Forecast, by Software Type 2020 & 2033
- Table 10: Global Enterprise Software Market Revenue Million Forecast, by Deployment 2020 & 2033
- Table 11: Global Enterprise Software Market Revenue Million Forecast, by End-User Vertical 2020 & 2033
- Table 12: Global Enterprise Software Market Revenue Million Forecast, by Country 2020 & 2033
- Table 13: Global Enterprise Software Market Revenue Million Forecast, by Software Type 2020 & 2033
- Table 14: Global Enterprise Software Market Revenue Million Forecast, by Deployment 2020 & 2033
- Table 15: Global Enterprise Software Market Revenue Million Forecast, by End-User Vertical 2020 & 2033
- Table 16: Global Enterprise Software Market Revenue Million Forecast, by Country 2020 & 2033
- Table 17: Global Enterprise Software Market Revenue Million Forecast, by Software Type 2020 & 2033
- Table 18: Global Enterprise Software Market Revenue Million Forecast, by Deployment 2020 & 2033
- Table 19: Global Enterprise Software Market Revenue Million Forecast, by End-User Vertical 2020 & 2033
- Table 20: Global Enterprise Software Market Revenue Million Forecast, by Country 2020 & 2033
- Table 21: Global Enterprise Software Market Revenue Million Forecast, by Software Type 2020 & 2033
- Table 22: Global Enterprise Software Market Revenue Million Forecast, by Deployment 2020 & 2033
- Table 23: Global Enterprise Software Market Revenue Million Forecast, by End-User Vertical 2020 & 2033
- Table 24: Global Enterprise Software Market Revenue Million Forecast, by Country 2020 & 2033
- Table 25: Global Enterprise Software Market Revenue Million Forecast, by Software Type 2020 & 2033
- Table 26: Global Enterprise Software Market Revenue Million Forecast, by Deployment 2020 & 2033
- Table 27: Global Enterprise Software Market Revenue Million Forecast, by End-User Vertical 2020 & 2033
- Table 28: Global Enterprise Software Market Revenue Million Forecast, by Country 2020 & 2033
Frequently Asked Questions
1. What is the projected Compound Annual Growth Rate (CAGR) of the Enterprise Software Market?
The projected CAGR is approximately 11.23%.
2. Which companies are prominent players in the Enterprise Software Market?
Key companies in the market include Accenture PLC, Epicor Software Corporation, Infor, Cisco Systems Inc, Microsoft Corporation, International Business Machines Corporation, NetSuite Inc, Oracle Corporation, Deltek Inc *List Not Exhaustive, SAP SE.
3. What are the main segments of the Enterprise Software Market?
The market segments include Software Type, Deployment, End-User Vertical.
4. Can you provide details about the market size?
The market size is estimated to be USD 0.65 Million as of 2022.
5. What are some drivers contributing to market growth?
Cloud & Networking-Based Advancements; Growing Demand from SMEs.
6. What are the notable trends driving market growth?
Cloud is Expected to Hold Significant Share.
7. Are there any restraints impacting market growth?
Security Vulnerability of Transaction Across the Insurance Platform using Blockchain Technology; Lack of Awareness about Blockchain in the Industry Professionals.
8. Can you provide examples of recent developments in the market?
March 2023: Cisco Systems Inc and Telenor Group announced an expanded relationship through the fifth iteration of their Joint Purpose Agreement (JPA) to advance strategic priorities that benefit markets in which the companies jointly operate. The focus areas of this collaboration include environmental, social, and governance (ESG) initiatives, as well as innovations related to as-a-service and automation. Additionally, the partnership will prioritize cybersecurity and the development of multi-cloud-as-a-service solutions. Cisco and Telenor plan to accelerate the availability of flexible, scalable, and reliable cybersecurity solutions as-a-service for both business and consumer customers.
9. What pricing options are available for accessing the report?
Pricing options include single-user, multi-user, and enterprise licenses priced at USD 4750, USD 5250, and USD 8750 respectively.
10. Is the market size provided in terms of value or volume?
The market size is provided in terms of value, measured in Million.
11. Are there any specific market keywords associated with the report?
Yes, the market keyword associated with the report is "Enterprise Software Market," which aids in identifying and referencing the specific market segment covered.
12. How do I determine which pricing option suits my needs best?
The pricing options vary based on user requirements and access needs. Individual users may opt for single-user licenses, while businesses requiring broader access may choose multi-user or enterprise licenses for cost-effective access to the report.
13. Are there any additional resources or data provided in the Enterprise Software Market report?
While the report offers comprehensive insights, it's advisable to review the specific contents or supplementary materials provided to ascertain if additional resources or data are available.
14. How can I stay updated on further developments or reports in the Enterprise Software Market?
To stay informed about further developments, trends, and reports in the Enterprise Software Market, consider subscribing to industry newsletters, following relevant companies and organizations, or regularly checking reputable industry news sources and publications.
Methodology
Step 1 - Identification of Relevant Samples Size from Population Database


Step 2 - Approaches for Defining Global Market Size (Value, Volume* & Price*)

Note*: In applicable scenarios
Step 3 - Data Sources
Primary Research
- Web Analytics
- Survey Reports
- Research Institute
- Latest Research Reports
- Opinion Leaders
Secondary Research
- Annual Reports
- White Paper
- Latest Press Release
- Industry Association
- Paid Database
- Investor Presentations

Step 4 - Data Triangulation
Involves using different sources of information in order to increase the validity of a study
These sources are likely to be stakeholders in a program - participants, other researchers, program staff, other community members, and so on.
Then we put all data in single framework & apply various statistical tools to find out the dynamic on the market.
During the analysis stage, feedback from the stakeholder groups would be compared to determine areas of agreement as well as areas of divergence